

In applications utilizing synthetic biomaterials, such as drug delivery,[1–4] bioimaging,[5,6] and tissue engineering,[7–11] the material mechanical properties represent an important set of design parameters.[12] Most studies of mechanical properties in biomaterials have focused on how cells interact with or move on surfaces of different rigidity in the context of mechanotransduction[7,10,11] and cell proliferation or differentiation.[8,9] However, few studies have investigated the effects of the mechanical softness of nanoparticles in nano- or micro-biological environments. It has been suggested, however, that the softness of nanoparticles may be relevant in processes such as phagocytosis or endocytosis.[13,14] This indicates that not only are cells affected by the mechanics of large surfaces or interfaces, but also by the rigidity of individual nanoparticles. The in vivo performance of nanoparticles is strongly dependent on a variety of biological processes, including, lymphatic drainage, endocytosis, extravasation, and kidney filtration. It stands to reason that any process that has a rigid size dependence may also be dependent on mechanical flexibility of the biomaterial.[15] Therefore, it is necessary to consider mechanics when outlining the nanoparticle size restrictions relevant for certain processes. This might especially be important when the process involves passage through small, well-defined pores, such as in renal filtration.
Renal or glomerular filtration is one of two routes of clearance of biomaterials from the body for particles smaller than 500 nm.[12,15,16] The other clearance route is biliary clearance through the liver; however, in nanomedicine applications biliary clearance is generally bypassed due to the small particle sizes typically used.[16] Therefore, renal clearance is a desired mechanism of nanoparticle excretion. This mechanism requires passage through approximately 8-nm diameter pores (as defined by endothelial gaps) under a pressure differential of 40 to 80 mmHg (0.7 to 1.5 psi).[17–21] Obviously, for most carrier systems these figures of merit are not easily met and require the integration of degradability into the nanoparticle design or rigorous control over small particle sizes.[22–25] In some cases these modifications may negatively alter drug loading/release, circulation times, cell uptake, and cytotoxicity. Therefore, it may be desirable to develop a carrier system that has the ability to be excreted without additional design complexity. For a hard sphere system, such as quantum dots, this implies a strict particle size limit,[26] which may negatively impact payload or may result in clearance through lymphatic drainage.[27] However, soft conformable nanoparticles that are able to deliver a large cargo yet are flexible enough to fit through small pores are a potentially attractive alternative. One example of such a construct is that of hydrogel colloids (i.e. nanogels or microgels), which are nanoparticles that can be dramatically compressed, due to their significant network flexibility.[28]
Herein we describe the first demonstration of microgel translocation through cylindrical pores under pressure differentials relevant to renal filtration. We observe that microgel particles easily pass through such pores, even when the opening is >10 fold smaller than the unperturbed microgel diameter. For this study, track-etch membranes were used as the model for pores in the renal system. As shown in Scheme 1, track-etch membranes were placed into gasket-sealed syringe filter holders and placed onto a luer-lock syringe that was enclosed at one end. A fluorescently-labeled microgel dispersion was added to the syringe and ~0.5 psi of hydrostatic pressure was applied from a compressed air cylinder to the head space of the syringe. Eluant was then be collected and analyzed by steady-state fluorescence.
Scheme 1.
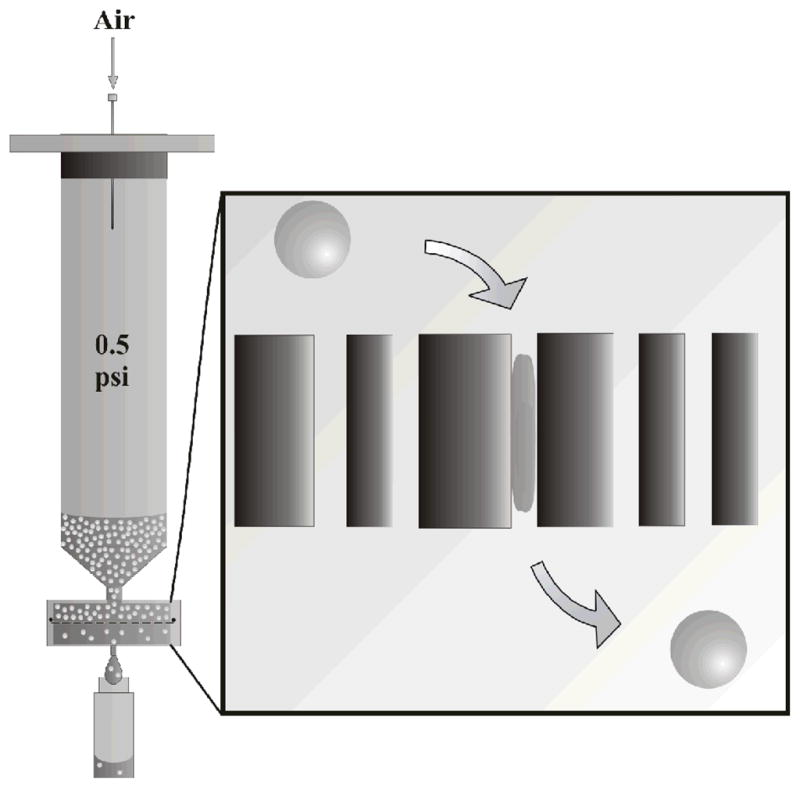
Scheme of filtration setup and microgel filtration through a track-etch membrane.
The microgels used in this study were prepared via copolymerization of N-isopropylacrylamide (NIPAm), acrylic acid (AAc, 10 mol%), and 4-acrylamidofluorescein (AFA, 0.02 mol %) with N,N′-methylenebis(acrylamide) (BIS) as a cross-linker. The microgel sizes as a function of pH (pH dependence arises from the AAc co-monomer) are shown in Table 1. The 1% cross-linked particles were approximately 1140 nm in diameter fully swollen at pH 7, whereas the 3% cross-linked microgels were smaller (648 nm) as expected due to the increased cross-linking. Also, the deswelling due to protonation of the AAc at pH = 3 was 43% for the 1% and 30% for the 3% cross-linked microgels. Thus, these two microgel types provided two different sizes with two different pH-dependent compressabilities to investigate the generality of the phenomenon. Note that the cross-linking density difference only should account for a small difference in swollen particle elastic modulus (~8 kPa vs. ~13 kPa) based on previous bulk gel literature.[29] More important than the differences in the microgels is the fact that both are significantly larger than the 100 nm track-etch membrane pores. For comparison, volume conserving, rigid polystyrene beads with diameters of 200 nm (negative control) and 88 nm (positive control) were used in identical filtration experiments.
Table 1.
Hydrodynamic radii (Rh) and swelling properties of microgels under different pH conditions.
| Particle Type | Rh (nm) pH 7.4 | Rh (nm) pH 3.0 | ζ (mV) pH 7.4 | ζ (mV) pH 3.0 | D %* |
|---|---|---|---|---|---|
| 1% x-link μGel | 570 | 324 | −20.5 | −4.1 | 43 |
| 3% x-link μGel | 433 | 303 | −17.3 | −3.3 | 30 |
| 88 nm PS | 48 | 46 | N/A | N/A | N/A** |
| 200 nm PS | 101 | 96 | N/A | N/A | N/A** |
All Rh values were determined by DLS @ 25 °C.
All ζ potentials were determined by electrophoretic light scattering
pH dependent deswelling percentage.
No statistical difference in radii between pH 3 and 7. (t-test 95%)
As shown in Figure 1, after filtration the unfiltered solutions and the resulting eluants were analyzed by steady-state fluorescence spectroscopy, fluorescence microscopy, and bright field microscopy. The spectra of 3% particle solution unfiltered, filtered, and a buffer solution are shown. Also shown in Figure 1, a more concentrated solution of the same microgels was filtered through the 100 nm track-membranes and the solutions before and after filtration were dried on glass cover slips and analyzed via optical microscopy. Since the track-etch membranes have an extremely small pore density (100 nm pores: 4 pores/μm2; 10 nm pores: 6 pores/μm2), they do not allow for a high flux of particles, even if they are smaller than the pores. Therefore, steady-state fluorescence was used for quantification of the polymer mass passed through the filter. The fluorophore loading of the microgels and control polystyrene particles is not equal, however the unfiltered solutions contained the same polymer weight percent (wt%). Therefore, calculation of the particle wt% in the filtered solution allowed for fair comparison of particle flux. The background-subtracted fluorescence was converted to polymer wt% by creating standard curves of background-subtracted fluorescence to wt% for each particle at each pH condition.
Figure 1.
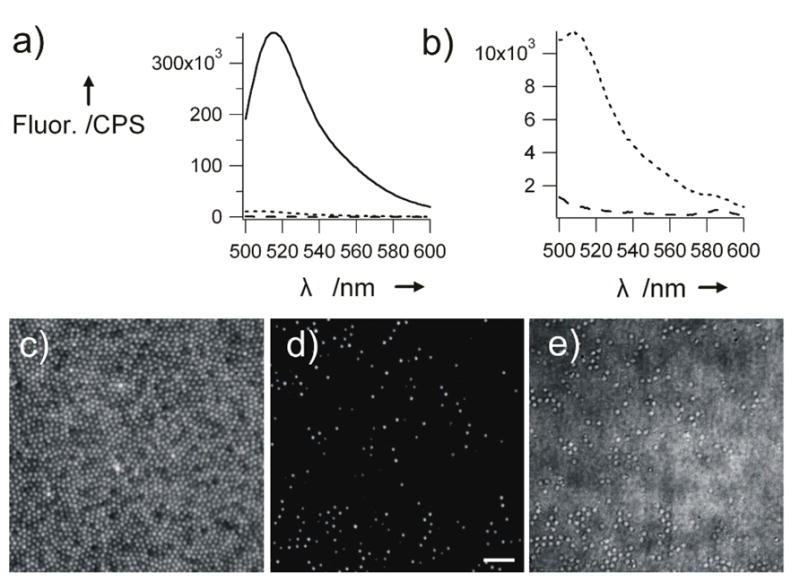
Fluorescence spectra, a) and b), of a 0.01 wt% solution of 3% cross-linked microgels (Dh = 648 nm) before (black) and after (dotted) filtration through 100 nm pores at pH 7. The black-dashed line in panel b) represents the pure pH 7 buffer. The spectrum of the filtrate is an average of 4 spectra. Panels (c), (d), and (e) are fluorescence microscopy images before and after flitration and a bright field microscopy image after filtration of the same microgels. Scale bar = 5 μm
The data in Figure 2 display the surprising result that the flux of both microgel types at pH = 7 was equal to that of the much smaller PS positive control. A greater difference between the microgels and the PS control is observed when the overall particle concentration is increased, Figure 3. We tentatively ascribe this concentration dependence to jamming of the PS particles in the pores (vide infra). It appears, however, that the deformable microgel particles do not display jamming effects at pH = 7, presumably due to their conformational flexibility and Coulombic interparticle repulsion (see Table 1 for measured ζ potentials) during passage.
Figure 2.
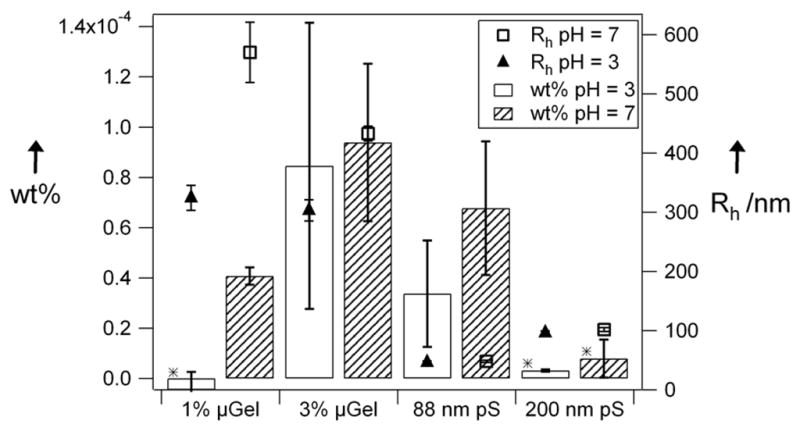
Filtration comparison of 1% and 3% microgels, 88 nm polystyrene, and 200 nm polystyrene particles (0.001 wt%). Error bars represent the uncertainty over 3 or 4 filtration experiments. Stars represent statistically significant data at the 95% confidence interval relative to 88 nm polystyrene at pH 7. Open circles are the hydrodynamic radii of particles at pH 7. Filled triangles are hydrodynamic radii of particles at pH 3.
Figure 3.

Filtration comparison of 1% and 3% microgels, 88 nm polystyrene, and 200 nm polystyrene particles (0.01 wt%). Error bars represent the uncertainty over 3 or 4 filtration experiments. Stars represent statistically significant data at the 95% confidence interval relative to 88 nm polystyrene at pH 7. Open circles are the hydrodynamic radii of all particles at pH 7. Filled triangles are hydrodynamic radii of all particles at pH 3.
Two pH conditions were studied to evaluate the influence of microgel swelling on passage through the pores. At low concentration (Figure 2), the flux of the 1% cross-linked microgels at pH 3 is indistinguishable from the background. However, at pH 7 the 1% microgels pass readily through the pores, presumably due to the increased flexibility of the swollen microgel, and decreased jamming due to Coulombic particle-particle repulsion. In the case of the 3% cross-linked microgels, there seems to be no difference between the two pH conditions. This is curious since both microgel types have a similar size at pH 3. Therefore, it could be the case that for this concentration and size, a jamming limit is being approached, and subtle differences in microgel modulus and interparticle potential produce large changes in pore passage. This is almost certainly the case when the concentration is increased further (Figure 3, 10-fold concentration increase); the observed flux for the microgels at pH 3 is much lower than that of the microgels at pH 7. This again suggests a jamming effect when the more rigid and less repulsive microgels try to fit through the small pores. This effect is emphasized by increasing the concentration another order of magnitude to 0.1 wt%, as shown in Figure 4. This figure shows that as the feed concentration increases only the flux of the 3% cross-linked particles in there fully swollen state (pH 7) increases, suggesting that the pS and deswollen microgels are jamming. It should be noted, however, that when the concentration is increased to 1 wt%, the passage increases for the microgels at both pH 7 and pH 3. The origin of this observation is still under investigation, but given our previous studies of microgel phase behavior at such concentrations,[30–32] it is likely that particle-particle interactions strongly perturb the actual hydrodynamic radii under these conditions. It should also be noted that the particle to pore size ratio of ~10:1 appears to be the rough limit for these particles, as larger microgels (Dh ≥ 1.5 μm) did not appear to pass through 100 nm pores.
Figure 4.
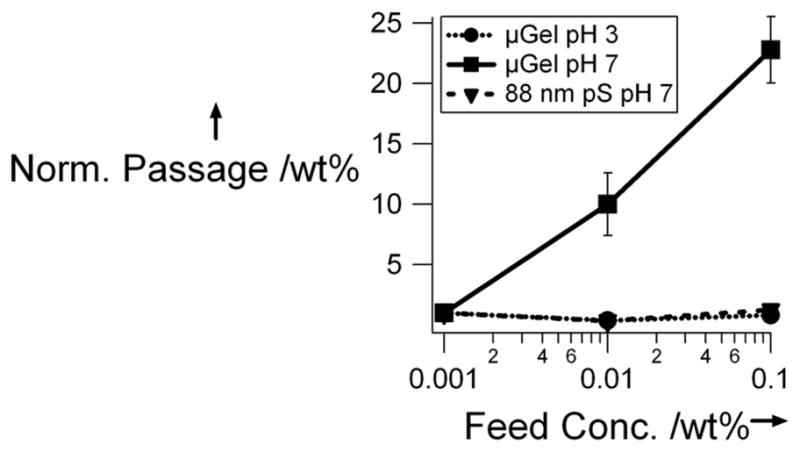
Normalized wt% passed versus feed concentration of 3% microgels at pH 3 and pH 7 and 88 nm pS at pH 7. The wt% passed was normalized to that as the lowest feed concentration.
Having observed that pNIPAm-AAc microgels are able to translocate through pores 10 times smaller in diameter, we investigated the generality of this phenomenon to smaller pore sizes with more biologically relevant dimensions. Here, track-etch membranes with 10 nm pores were used in the same experimental setup (Scheme 1) with the same applied pressure differential of ~0.5 psi. The particles used in this experiment were fluorescent pNIPMAm microgels with a dilute solution diameter of 116 nm; 88 nm diameter fluorescently-labeled polystyrene beads were used as a negative control. The synthesis of the microgels has been published previously and is discussed briefly in the experimental section.[33] As shown in Figure 5, even at these smaller dimensions, the microgels still pass through the pores (pH 7) while the negative control does not. These data are compelling due to the similarity in pores size and pressures between those found in the kidney and used in these experiments. Also, it should be noted that when various FITC-dextran (fluorescein isothiocyanate–dextran) samples (MW = 20 or 150 kDa) were used as a positive control, they readily passed through the pores, as expected for a random chain flexible polymer.
Figure 5.
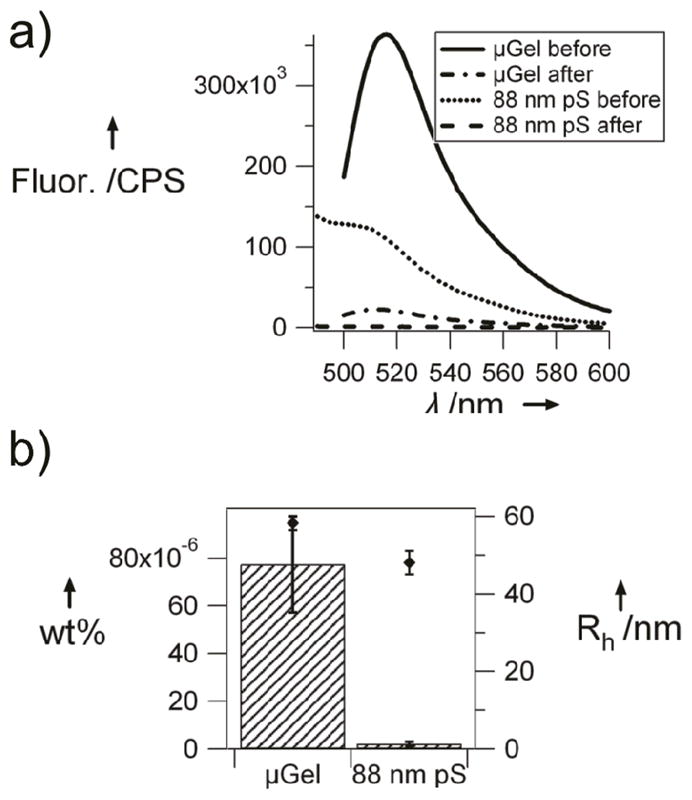
a) Fluorescence spectra of 0.001 wt% solutions before (solid) and after (dotted) filtration through 10 nm pores of 116 nm microgels (black) and 88 nm polystyrene beads (gray). After filtration spectra is an average of 4 spectra. b) Filtered wt% comparison of 116 nm microgels and 88 nm polystyrene. Diamonds are hydrodynamic radii of particles at pH 7.
Although the fundamental mechanisms underlying these observations are not understood quantitatively, the biology and physiology community has studied the glomerular filtration rate of macromolecules for many years.[17–20,34,35] It has been found that linear polysaccharides such as dextran have a much greater filtration rate and larger hydrodynamic radius cutoff than do proteins, due to the rigidity and well-defined secondary structure of the latter.[17] Also, the soft matter community has extensively studied the passage of polymers through pores.[36–40] Translocation of a linear polymer through pores or in confined spaces is generally most probable if the polymer can go end first through the pore (as opposed to folding). Likewise, it has been found that a branched polymer has a higher probability of passage through a pore if more than one chain end can find the pore opening.[15] Therefore, a polymer nanoparticle with low connectivity and many different chain ends may have the conformational freedom to pass through a pore much smaller than its dilute solution diameter, due to the high number of energetically degenerate conformations with statistically identical passage probabilities. Also, the compressibility of these particles cannot be underestimated. It has been shown that the combination of polymer and colloidal osmotic pressures, in a colloidal crystal of pNIPAm microgels was able to induce the dramatic deswelling of a much larger microgel “defect”.[28] In that case the “defect” was compressed to a volume 15 times smaller than its dilute solution equilibrium volume, without imposing any direct mechanical force to the particle. It is therefore not unreasonable to hypothesize that similar microgels could adopt a configuration in which many chains enter the pore under a driving pressure differential, followed by particle collapse/compression, and subsequent re-swelling as it emerges from the other side of the membrane.
In conclusion, we have observed phenomena that illustrate the ability of hydrogel microparticles to pass through pores at least 10-fold smaller in size under hydrostatic pressures relevant to renal filtration. This extremely surprising result can be rationalized by considering the extreme softness of these nano-objects and conformational flexibility of the polymer chains comprising the particles. Importantly, we have illustrated the generality of the phenomenon to absolute pore sizes that are relevant to renal filtration by using nanogels appropriate in size for injectable drug delivery formulations. These studies illustrate the importance of considering the mechanical flexibility as a critical design component of nano-biomaterials. This network flexibility and compressibility of microgels is not only interesting in terms of their performance as biomaterials for drug delivery but is also of fundamental interest, as soft colloid physics has become a vibrant field of study. Indeed, both the fundamental physics of microgel softness and the biological impacts thereof have been and continue to be an active area of investigation within our research group.
Experimental Section
Materials
Monomers N-isopropylacrylamide (NIPAm; Aldrich) and N-isopropylmethacrylamide (NIPMAm) were recrystallized from hexanes (Fisher Scientific) before microgel synthesis. The fluorescent monomer 4-acrylamidofluorescein (AFA) was previously synthesized.[41] Cross-linker N,N′-methylenebis(acrylamide) (BIS; Aldrich), ammonium persulfate (APS; Aldrich), and acrylic acid (AAc; Fluka) were all used as received. The polystyrene standards (Duke Scientific) were diluted in a 0.003 wt% surfactant (sodium dodecyl sulfate (SDS; Aldrich)) solution. The track-etch membranes were purchased from Sterlitech (Kent, WA). The pH 7 buffer was a 10 mM (IS = 100 mM) phosphate buffer and the pH 3 buffer was a 10 mM (IS = 100 mM) formate buffer. All water used in the experiments was purified to 18 mΩ (Barnstead E-pure system).
Synthesis
The larger microgels were synthesized by precipitation polymerization of NIPAm, BIS (1 or 3 mol%), AFA (0.02 mol%), and AAc (10 mol%) with a total monomer concentration of 100 mM in 100 mL. All components were dissolved in distilled, deionized water and stirred under a nitrogen purge while heating to 68 °C. Then APS (0.01 mM) was added to initiate the reaction. The reaction was allowed to stir under nitrogen at 68 °C overnight. For the smaller microgel synthesis, NIPMAm was used with BIS and AFA, in the same manner except 8 mM SDS was added to stabilize the l particles, the syntheses were performed at 70 °C, and 8 mM APS was used.[33] All particle solutions were filtered and purified via centrufucation. The samples were then freeze-dried for storage.
Size Characterization
Dynamic light scattering (DLS) was used to determine the hydrodynamic radius (Rh) under different pH conditions as described earlier.[42,43] This was done with a Wyatt Technologies DynaPro plate reader DLS using a laser wavelength of 830 nm. Scattering intensity fluctuations were detected for 10 s per reading by an avalanche photodiode at and angle of 158° (back scattering) from the incident laser. Dynamics software (Wyatt Technologies Corp.) was used to calculate and fit an autocorrelation function plotted from the random fluctuations in scattering intensity. These fits of the autocorrelation functions were used to calculate the diffusion coefficients and then through the Stokes-Einstein equation, the Rh. The plate reader DLS provided the opportunity to use small volumes (50 μL) of particle solution and to run different aliquots in series without further sample preparation.
Zeta Potential Measurements
Zeta potential measurements were carried out in 5 mM ionic strength HEPES (pH 7.4) and formate (3.0) buffers by electrophoretic light scattering with a Malvern Instruments Zetasizer.
Filtration Experiments
Syringes (30 mL) were used for the filtration experiments by removing the plunger. Epoxy was used to seal a septum stopper in the top of the syringe. A manufacturer-supplied, luer lock membrane holder was used to hold the 25-mm radius membranes at the end of the syringe. The holders and syringes were sonicated and rinsed with a dilute Alconox solution and distilled, deionized water before assembly and use. After clamping the syringe vertically, a particle solution (~ 4 mL) was injected through the septum at the top of the syringe. Lastly a needle attached to a step-down (0–15 psi) regulator was placed into the septum to control the hydrostatic pressure. A particle solution of approximately 2 mL was collected which took anywhere from 4 to 8 hrs for the 100 nm pore experiments and 24 hrs to 48 hrs for the 10-nm pore experiments. After collection, all solutions were analyzed on a steady-state fluorescence spectrometer (Photon Technology International), equipped with a Model 814 PMT photon counting detector. For all microgels containing fluorescein the excitation wavelength was set to 490 nm and emission was detected between 500–600 nm. For the polystyrene standards, excitation was set to 468 nm and emission was collect from 480–600 nm based on the literature from the manufacturer. Then the fluorescence at peak max [515 nm (μGels) 508 nm (pS)] of the solutions was recorded. Readings of particles in pH 3 buffer were done by spiking and aliquot of 0.5 mL of sample with 50 μL of a 100 mM pH 9 borate buffer to raise the pH to ~ 8 so that fluorescence would not be quenched. All data was analyzed by a q-test and outliers at the 95% confidence interval were removed from the data set. Also, the stars in the data sets represent data that is statistically different from the 88-nm pStyrene control at a 95% confidence level determined by a t-test. Standard curves for each particle type and pH condition were made by serial dilutions around the concentrations that passed through the membrane. Then using linear regression the background-subtracted fluorescence from the filtration experiments was used to calculate concentrations.
Acknowledgments
Financial support from the NIH (1 R01 GM088291-01) is acknowledged. The authors thank Michael H. Smith for synthesis of the pNIPMAm nanogels.
References
- 1.Jain TK, Reddy MK, Morales MA, Leslie-Pelecky DL, Labhasetwar V. Mol Pharm. 2008;5:316. doi: 10.1021/mp7001285. [DOI] [PubMed] [Google Scholar]
- 2.Jie P, Venkatraman SS, Min F, Freddy BYC, Huat GL. J Controlled Release. 2005;110:20. doi: 10.1016/j.jconrel.2005.09.011. [DOI] [PubMed] [Google Scholar]
- 3.Shirota K, Kato Y, Suzuki K, Sugiyama Y. J Pharmacol Exp Ther. 2001;299:459. [PubMed] [Google Scholar]
- 4.Tabata T, Murakami Y, Ikada Y. J Controlled Release. 1998;50:123. doi: 10.1016/s0168-3659(97)00129-6. [DOI] [PubMed] [Google Scholar]
- 5.He XX, Nie HL, Wang KM, Tan WH, Wu X, Zhang PF. Anal Chem. 2008;80:9597. doi: 10.1021/ac801882g. [DOI] [PubMed] [Google Scholar]
- 6.Schipper ML, Iyer G, Koh AL, Cheng Z, Ebenstein Y, Aharoni A, Keren S, Bentolila LA, Li JQ, Rao JH, Chen XY, Banin U, Wu AM, Sinclair R, Weiss S, Gambhir SS. Small. 2009;5:126. doi: 10.1002/smll.200800003. [DOI] [PMC free article] [PubMed] [Google Scholar]
- 7.Chen CS, Mrksich M, Huang S, Whitesides GM, Ingber DE. Science. 1997;276:1425. doi: 10.1126/science.276.5317.1425. [DOI] [PubMed] [Google Scholar]
- 8.Engler AJ, Griffin MA, Sen S, Bonnetnann CG, Sweeney HL, Discher DE. J Cell Biol. 2004;166:877. doi: 10.1083/jcb.200405004. [DOI] [PMC free article] [PubMed] [Google Scholar]
- 9.Engler AJ, Sen S, Sweeney HL, Discher DE. Cell. 2006;126:677. doi: 10.1016/j.cell.2006.06.044. [DOI] [PubMed] [Google Scholar]
- 10.Shen H, Tan J, Saltzman WM. Nat Mater. 2004;3:569. doi: 10.1038/nmat1179. [DOI] [PubMed] [Google Scholar]
- 11.Ingber DE. Faseb J. 2006;20:811. doi: 10.1096/fj.05-5424rev. [DOI] [PubMed] [Google Scholar]
- 12.Mitragotri S, Lahann J. Nat Mater. 2009;8:15. doi: 10.1038/nmat2344. [DOI] [PMC free article] [PubMed] [Google Scholar]
- 13.Beningo KA, Wang YL. J Cell Sci. 2002;115:849. doi: 10.1242/jcs.115.4.849. [DOI] [PubMed] [Google Scholar]
- 14.Banquy X, Suarez F, Argaw A, Rabanel JM, Grutter P, Bouchard JF, Hildgen P, Giasson S. Soft Matter. 2009;5:3984. [Google Scholar]
- 15.Fox ME, Szoka FC, Frechet JMJ. Acc Chem Res. 2009;42:1141. doi: 10.1021/ar900035f. [DOI] [PMC free article] [PubMed] [Google Scholar]
- 16.Nel AE, Madler L, Velegol D, Xia T, Hoek EMV, Somasundaran P, Klaessig F, Castranova V, Thompson M. Nat Mater. 2009;8:543. doi: 10.1038/nmat2442. [DOI] [PubMed] [Google Scholar]
- 17.Asgeirsson D, Venturoli D, Rippe B, Rippe C. Am J Physiol Renal Physiol. 2006;291:F1083. doi: 10.1152/ajprenal.00488.2005. [DOI] [PubMed] [Google Scholar]
- 18.Deen WM, Lazzara MJ, Myers BD. Am J Physiol Renal Physiol. 2001;281:F579. doi: 10.1152/ajprenal.2001.281.4.F579. [DOI] [PubMed] [Google Scholar]
- 19.Rippe C, Rippe A, Torffvit O, Rippe B. Am J Physiol Renal Physiol. 2007;293:F1533. doi: 10.1152/ajprenal.00271.2007. [DOI] [PubMed] [Google Scholar]
- 20.Salmon AHJ, Toma I, Sipos A, Muston PR, Harper SJ, Bates DO, Neal CR, Peti-Peterdi J. Am J Physiol Renal Physiol. 2007;293:F1777. doi: 10.1152/ajprenal.00187.2007. [DOI] [PubMed] [Google Scholar]
- 21.Lau C, Sudbury I, Thomson M, Howard PL, Magil AB, Cupples WA. Am J Physiol Regul Integr Comp Physiol. 2009;296:R1761. doi: 10.1152/ajpregu.90731.2008. [DOI] [PubMed] [Google Scholar]
- 22.Atzet S, Curtin S, Trinh P, Bryant S, Ratner B. Biomacromolecules. 2008;9:3370. doi: 10.1021/bm800686h. [DOI] [PMC free article] [PubMed] [Google Scholar]
- 23.Hua N, Sun J. J Mater Sci: Mater Med. 2008;19:3243. doi: 10.1007/s10856-008-3460-z. [DOI] [PubMed] [Google Scholar]
- 24.Park JH, Gu L, von Maltzahn G, Ruoslahti E, Bhatia SN, Sailor MJ. Nat Mater. 2009;8:331. doi: 10.1038/nmat2398. [DOI] [PMC free article] [PubMed] [Google Scholar]
- 25.Troutman TS, Barton JK, Romanowski M. Adv Mater. 2008;20:2604. doi: 10.1002/adma.200703026. [DOI] [PMC free article] [PubMed] [Google Scholar]
- 26.Choi HS, Liu W, Misra P, Tanaka E, Zimmer JP, Ipe BI, Bawendi MG, Frangioni JV. Nat Biotechnol. 2007;25:1165. doi: 10.1038/nbt1340. [DOI] [PMC free article] [PubMed] [Google Scholar]
- 27.Parungo CP, Soybel DI, Colson YL, Kim SW, Ohnishi S, DeGrand AM, Laurence RG, Soltesz EG, Chen FY, Cohn LH, Bawendi MG, Frangioni JV. Ann Surg Oncol. 2007;14:286. doi: 10.1245/s10434-006-9044-6. [DOI] [PMC free article] [PubMed] [Google Scholar]
- 28.Iyer AS, Lyon LA. Angew Chem, Int Ed. 2009;48:4562. doi: 10.1002/anie.200901670. [DOI] [PubMed] [Google Scholar]
- 29.Matzelle TR, Geuskens G, Kruse N. Macromolecules. 2003;36:2926. [Google Scholar]
- 30.Meng Z, Cho JK, Breedveld V, Lyon LA. J Phys Chem B. 2009;113:4590. doi: 10.1021/jp8104979. [DOI] [PubMed] [Google Scholar]
- 31.Meng ZY, Cho JK, Debord S, Breedveld V, Lyon LA. J Phys Chem B. 2007;111:6992. doi: 10.1021/jp073122n. [DOI] [PubMed] [Google Scholar]
- 32.St John AN, Breedveld V, Lyon LA. J Phys Chem B. 2007;111:7796. doi: 10.1021/jp071630r. [DOI] [PubMed] [Google Scholar]
- 33.Blackburn WH, Lyon LA. Colloid Polym Sci. 2008;286:563. doi: 10.1007/s00396-007-1805-7. [DOI] [PMC free article] [PubMed] [Google Scholar]
- 34.Fissell WH, Manley S, Dubnisheva A, Glass J, Magistrelli J, Eldridge AN, Fleischman AJ, Zydney AL, Roy S. Am J Physiol Renal Physiol. 2007;293:F1209. doi: 10.1152/ajprenal.00097.2007. [DOI] [PubMed] [Google Scholar]
- 35.Tanner GA, Rippe C, Shao YZ, Evan AP, Williams JC. Am J Physiol Renal Physiol. 2009;296:F1269. doi: 10.1152/ajprenal.00371.2007. [DOI] [PubMed] [Google Scholar]
- 36.de Gennes PG. Polymers in Confined Environments. Vol. 138. 1999. p. 91. [Google Scholar]
- 37.Muthukumar M. Phys Rev Lett. 2001;86:3188. doi: 10.1103/PhysRevLett.86.3188. [DOI] [PubMed] [Google Scholar]
- 38.Papisov MI. Adv Drug Delivery Rev. 1995;16:127. doi: 10.1016/s0169-409x(97)00135-x. [DOI] [PubMed] [Google Scholar]
- 39.Wong CTA, Muthukumar M. Biophys J. 2008;95:3619. doi: 10.1529/biophysj.108.135525. [DOI] [PMC free article] [PubMed] [Google Scholar]
- 40.Wong CTA, Muthukumar M. J Chem Phys. 2008:128. doi: 10.1063/1.2897932. [DOI] [PMC free article] [PubMed] [Google Scholar]
- 41.Serpe MJ, Jones CD, Lyon LA. Langmuir. 2003;19:8759. [Google Scholar]
- 42.Debord JD, Lyon LA. J Phys Chem B. 2000;104:6327. [Google Scholar]
- 43.Yi YD, Bae YC. J Appl Polym Sci. 1998;67:2087. [Google Scholar]