Abstract
Nanoparticles have enormous potential in diagnostic and therapeutic studies. We have demonstrated that the amyloid beta mixed with and conjugated to dihydrolipoic acid- (DHLA) capped CdSe/ZnS quantum dots (QDs) of size approximately 2.5 nm can be used to reduce the fibrillation process. Transmission electron microscopy (TEM) and atomic force microscopy (AFM) were used as tools for analysis of fibrillation. There is a significant change in morphology of fibrils when amyloid β (1–42) (Aβ (1–42)) is mixed or conjugated to the QDs. The length and the width of the fibrils vary under modified conditions. Thioflavin T (ThT) fluorescence supports the decrease in fibril formation in presence of DHLA-capped QDs.
1. Introduction
Nanochemistry is predominating in major fields of science and technology, specifically in biotechnology and information technology. In the near future, nanochemistry will direct and guide towards nanomedicine and nanodiagnostics [1]. However, obtaining suitable nanoparticles that can be used for diagnostic and medicinal purposes remains a significant challenge. Moreover, the effect of these nanoparticles on biological entities such as proteins is considerably significant when it comes to AD.
Oligomeric aggregates Aβ and tau protein or the protofibrils are considered as precursors for amyloid fibrillation in Alzheimer's disease [2]. A few articles have been published on the effect of nanoparticles on fibrillation process. Recently, the effect of fluorinated magnetic core-shell nanoparticles with the size range of 15.0 ± 2.1 nm has been observed on amyloid model protein insulin; these fluorinated nanoparticles show inhibition of insulin fibrils [3, 4]. Furthermore, the effect of various nanoparticles within the dimensions of 6–200 nm on another model protein, β2 microglobulin, has been investigated [5]. Previously published studies have demonstrated that nanoparticles can act as catalysts for protein fibrillation [1, 5]. Very recently, Li and coworkers have showed an inhibition effect of N-acetyl cysteine-capped CdTe QDs of size of 3–5 nm on Aβ (1–40) fibrillation [6]. In another case, dual effect of commercial polystyrene nanoparticles with amino modification having various sizes (57, 120, and 180 nm) was observed on Aβ (1–40) and recombinant Aβ (1–40) and Aβ (1–42) proteins [7]. Furthermore, there is only one recent publication on the effect of nanoparticles on Aβ (1–42) fibrils. In this case, it was observed an increase in rate of amyloid fibrillation in presence of TiO2 nanoparticles with size of approximately 20 nm [8].
The interaction of nanoparticles with different proteins depends upon various factors such as surface coating of nanoparticles with ligands, surface properties, size, and composition of nanoparticles [1, 5]. From the previous studies, [1, 3–8] we cannot generalize the concept that different nanoparticles can promote or inhibit the fibril formation for various amyloid model proteins. Specifically, the only investigation that explains the effect of TiO2 on Aβ (1–42) shows that nanoparticles promote the fibrillation process by becoming nucleation centers [8].
We report for the first time in our knowledge that CdSe/ZnS QDs of size of 2.5 ± 1.3 nm can inhibit fibrillation of Aβ (1–42). In the present study, we have investigated the effect of the presence of DHLA-capped CdSe/ZnS QDs either mixed with or conjugated to Aβ (1–42) on fibrillation process of Aβ (1–42) in aqueous phase. TEM and AFM studies show that the QDs behave uniquely when they are conjugated to Aβ (1–42) in comparison to a mixed sample of Aβ (1–42) and QDs. Our study illustrates a considerable difference in morphology of the fibrils and the inhibition of fibrillation process when Aβ (1–42) is conjugated to QDs versus the mixed system Aβ (1–42) and QDs. These results are further supported by Thioflavin T (ThT) assay using fluorescence spectroscopy.
2. Experimental Section
2.1. Materials and Methods
All Chemicals were commercially purchased and used without further purification. Cadmium oxide (CdO), selenium (Se), trioctylphosphine oxide (TOPO), trioctylphosphine (TOP), and hexamethyldisilathiane [(TMS)2S] were purchased from Sigma-Aldrich (Milwaukee, WI). The tetradecylphosphonic acid (TDPA) was obtained from Alfa Aesar (Ward Hill, MA). The diethylzinc (ZnEt2, 15 wt% solution in hexane) was obtained from Acros Organics (MorrisPlains, New Jersey). DL-α-lipoic acid, Aβ (1–42), and ThT were purchased from MP Biomedicals (Solon, OH).
2.2. Synthesis of DHLA-Capped QDs
CdSe/ZnS QDs were synthesized using an already given protocol [9]. Briefly, cadmium oxide was reacted with a selenium reagent in the presence of a phosphine oxide surfactant at high temperature under argon flow. After the formation of the CdSe core, the diethyl zinc and hexamethyldisilathiane in TOP was added dropwise at 130°C. After the synthesis of TOPO-capped hydrophobic QDs, modification to hydrophilic DHLA-capped QDs was carried out [10]. Briefly, first DL-α-lipoic acid (1 g) was reduced using sodium borohydride (2 g) in methanol/water (v/v, 1:1) solution. After workup product was isolated in chloroform and characterized using 1H NMR (400 MHz, CDCl3): δ (ppm) 1.3 (d, 1H), 1.35 (t, 1H), 1.4–1.8 (m, 6H), 1.9 (m, 2H), 2.4 (t, 2H), 2.6–2.8 (m, 2H), 2.9 (m, 1H), and 11 (s, 1H).
DHLA was used for ligand exchange with TOPO; excess of DHLA (0.5 g) was added in 5 mL of TOPO-capped QDs in methanol and heated at 60°C–70°C for 4 h. Once a homogeneous QDs solution was obtained, solution was basified using potassium tert-butoxide and centrifuged to get the precipitates. The precipitates were suspended in water to obtain the hydrophilic QDs. The water-soluble QDs were filtered through 0.2 μm filter to get a clear solution.
2.3. Preparation of Aβ (1–42) Mixed and Conjugated with DHLA-Capped QDs
Aβ(1–42) was chemically conjugated to QDs by the formation of an amide bond between Asp-NH2 end of the polypeptide chain and the –COOH end of the DHLA ligand using the protocol to conjugate proteins [11]. Freshly prepared DHLA-capped QDs (1.51 × 10⁻⁵ M, 100 μL) were taken in a clean borosilicate glass vial, and 500 μL PBS buffer (pH 7.4) was added to the QDs. To lyophilize the peptide, 0.5 mg Aβ (1–42) was dissolved in hexafluoroisopropanol (HFIP) to bring the peptide in monomer form and evaporated under gentle flow of N2. The dried protein was then dissolved in 500 μL PBS buffer (pH 7.4) to get the final concentration of 1 mg/mL. Freshly prepared Aβ(1–42) solution was then mixed in QDs solution. 57 μL of freshly prepared 10 mg/mL EDC (1-ethyl-3-(3-dimethylaminopropyl) carbodiimide hydrochloride) solution in deionized water was then added to the mixture of peptide and QDs, total volume of solution prepared was 1157 μL. The solution was stirred for 4 h at the speed of 200 rpm. There was no precipitate observed after the reaction. Aβ (1–42) mixed with DHLA-capped QDs was prepared according to the above-mentioned protocol except for the addition of EDC. Total volume of the solution was kept at 1157 μL. For the induction of fibrillation the solutions were incubated at 37°C.
2.4. Preparation of Pure Aβ (1–42) Sample for Fibrillation
Pure Aβ (1–42) solution was prepared similarly, first by lyophilizing the peptide in HFIP and evaporating the solvent under gentle nitrogen flow and then redissolving the dried peptide in 1157 μL of PBS buffer (pH 7.4). The solution was then incubated at 37°C to induce the fibril formation.
2.5. Gel Electrophoresis
Electrophoresis of QDs was performed using a MiniCuve 8.10 Electrophoresis Unit (MP Biomedicals, Solon, OH). Hand cast gels were composed of 1% agarose in 1× TBE (0.089 M Tris base, 0.089 M boric acid, and 0.002 M ethylenediaminetetraaceticacid, pH 8.3). 10 μL of each sample was loaded into wells on the agarose gel using a micropipet. The samples were run in 1× TBE buffer on the 1% agarose gel at 84 V for 75 min. For visualization, the gel was placed on a UV transilluminator, and an image was captured with a Gel Doc XR system (Bio-Rad, Hercules, CA).
2.6. TEM Measurements
TEM measurements were performed at the Center of Advanced Microscopy, Scripps Research Institute (La Jolla, CA) and at the Center of Advanced Microscopy, (CMA), Trinity College Dublin (Ireland). For the images containing amyloid, negative staining was performed using 2% uranyl acetate. Briefly, copper grids (carbon and Formvar coated 400 mesh: Electron Microscopy Sciences, Hatfield, PA) were glow discharged and inverted on an 5 μL aliquot of sample for 3 min. Excess sample was removed and the grids immediately placed briefly on a droplet of double-distilled water. Grids requiring the negative stain were then placed on droplets of 2% uranyl acetate solution for 2 min. Excess stain was removed and the grid was allowed to dry thoroughly. For unstained grids, the excess water was removed, and the dried grids were examined on a Philips CM100 electron microscope (FEI, Hillsbrough, OR) at 80 kV and images collected using a Megaview III CCD camera (Olympus Soft Imaging Solutions, Lakewood, CO). Grids at Ireland were examined on a Jeol 2100 electron microscope (Zeiss) operating at 200 kV and images collected using a CCD camera. Analysis of TEM images was performed using Image J software from NIH (http://rsbweb.nih.gov/ij/).
2.7. AFM Measurements
Briefly, 4 μL aliquots of Aβ solutions were deposited on freshly cleaned and dried silicon wafers (approximately 1 mm thick). After waiting for 10 min, nonadsorbed portions of the samples were washed with deionized water (400 μL). The wet surface of the silicon wafer was then dried using gentle flow of air. The samples were analyzed by atomic force microscopy (AFM, βA multimode SPM, Model no. 920-006-101, Veeco, Fremont, CA). Tapping mode approach was used to acquire the images, which allows intermittent contact of the tip with the sample and minimizes the chances of deformation of the peptide samples. The cantilever and the tip were made up of silicon. The cantilever force constant was approximately 20–100 N/m with the resonance frequency between 200 and 400 kHz. The scan rate was between 1.0 and 1.2 Hz. The software used for the analysis of fibrils was the NanoScope Control, version 5.30 and the histogram analysis was performed using the postanalysis pico image software (pico view version 1.6.2).
2.8. UV-Vis and Fluorescence Spectroscopy
UV-vis spectra of solutions were recorded on a Perkin-Elmer Lambda 900 UV/vis/NIR spectrometer (Norwalk, CT). Fluorescence spectra were obtained using Spex FluoroLog Fluorospectrometer (Horiba Jobin Yvon, Edison, NJ). Both UV-vis and fluorescence measurements were obtained using quartz cuvette with1 cm optical path length.
2.9. ThT Fluorescence
10 μM solution of ThT was prepared in 1xPBS buffer at pH 7.4. 30 μL of Aβ (1–42) aliquots were extracted at different time periods, and 300 μL of ThT (10 μM) was added to the samples. The ThT fluorescence was measured at 482 nm at an excitation wavelength of 440 nm in a semimicro quartz cuvette of an optical pathlength of 1 cm. Slit widths at excitation and emission were set at 5 nm.
3. Results and Discussion
3.1. Characterization of QDs and QDs Mixed and Conjugated with Aβ (1–42)
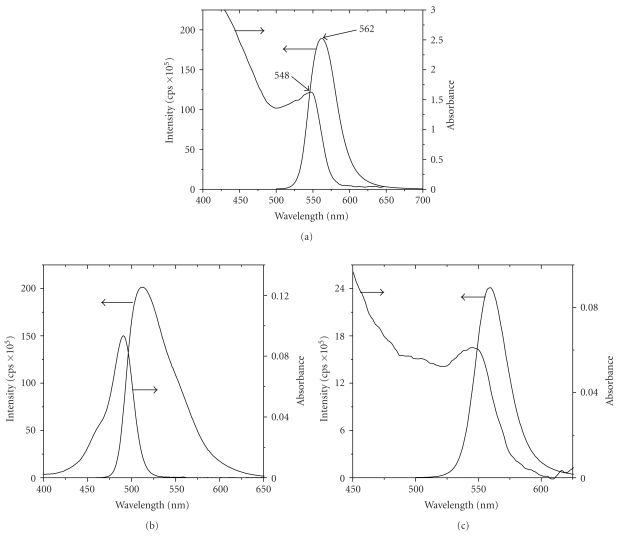
Characterization of DHLA-capped QDs was carried out using UV-vis and fluorescence spectroscopy (Figure 1(a)). Quantum yield (QY) has been calculated for the QDs investigated. The fluorescein (QY is 0.94 in 0.1 M NaOH) was employed as reference. The QY was calculated by using the following equation:
Figure 1.
(a) Absorption and emission spectra of DHLA-capped QDs. Fluorescence spectrum was obtained using a quartz cell with an optical path length of 1 cm, excitation wavelength at 467 nm, and 2, 2 nm slit width at the excitation and emission, respectively; (b) UV-vis and fluorescence spectra for fluorescein; (c) DHLA-capped QDs used for quantum yield measurements.
| (1) |
A is the absorbance at the excitation wavelength, n is the refractive index of the solvent used, I is the emission wavelength-dependent emission intensity, and λ is the emission wavelength. Subscripts q and f represent the QDs and the fluorescein, respectively. QY was calculated from the intensity of luminescence and the absorbance in Figures 1(b) and 1(c) for fluorescein (0.1 M NaOH as solvent) and QDs (water as solvent), respectively. The QY of the DHLA-capped CdSe/ZnS QDs was around 25%.
3.1.1. Estimation of Aβ/QDs Ratio
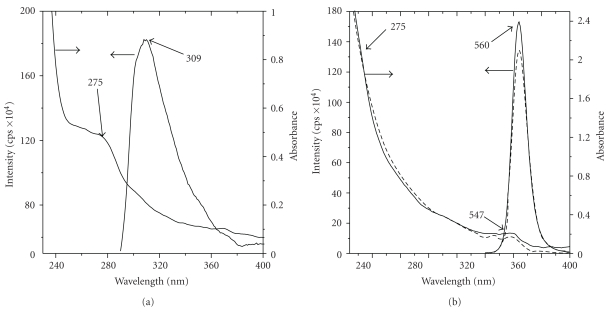
To characterize the QDs conjugated to Aβ (1–42), it is important to estimate the number of Aβ monomers bound to QDs after conjugation. Firstly, characterization of samples of pure Aβ (1–42), Aβ (1–42) mixed and conjugated to QDs was performed using UV-vis and fluorescence spectroscopy (Figure 2). The emission band for the tyrosine moiety in Aβ (1–42) was observed at 309 nm at the excitation wavelength of 280 nm, slit width at emission and excitation was set at 5 nm. The absorption band for Aβ (1–42) was observed at 275 nm (Figure 2(a)), whereas the emission band for the Aβ (1–42) mixed and conjugated to QDs was observed at 560 nm at the excitation wavelength of 467 nm. The absorption band for the QDs was observed at 547 nm and for the Aβ (1–42) a little hump was observed at 275 nm as shown in Figure 2(b). Molar concentration of the QDs and Aβ (1–42) was calculated from UV-vis spectrum of the solution [12, 13], the optical path length used was 1 cm. The ratio of these concentration values gave the average number of Aβ per quantum dot nanoparticles. The molar extinction coefficient of QDs at 547 nm is 105.8 × 10³ M−1 cm−1 and at 275 nm is 2.6 × 10³ M−1 cm−1. Extinction coefficient for Aβ (1–42) [14] at 275 nm is 1.4 × 10³ M−1 cm−1. The calculations to determine the ratio of Aβ (1–42) and QDs are shown below.
Figure 2.
(a) UV-vis and fluorescence spectra of Aβ (1–42). Fluorescence spectrum was obtained using a quartz cell with an optical path length of 1 cm, excitation wavelength at 280 nm, and 5, 5 nm slit width at the excitation and emission, respectively; (b) UV-vis and fluorescence spectra for Aβ (1–42) mixed (—) and conjugated (- - -) to QDs. Fluorescence spectrum was obtained using a quartz cell with an optical path length of 1 cm, excitation wavelength at 467 nm, and 2, 2 nm slit width at the excitation and emission, respectively.
3.1.2. Aβ Conjugated to DHLA-Capped QDs
QDs concentration (conjugated sample) is
| (2) |
Absorption at 275 nm from QDs is
| (3) |
Absorption at 275 nm from Aβ (1–42) is
| (4) |
Aβ (1–42) concentration in the sample conjugated to QDs is
| (5) |
Theoretically, the total number of molecules/particle of Aβ (1–42) (molecular weight 4514.1 g) present in 0.5 mg of the 1157 μL of sample can be calculated by multiplying the number of moles with NA (Avogadro's number) number of molecules. Hence, the total number of molecules of Aβ (1–42) present in the sample is 5.8 × 10²¹. Similarly, the total number of QDs particles present in the solution is 9.0 × 10¹⁷. Therefore, the ratio of Aβ (1–42) molecules per QD particle is 6400. Subtracting the experimental value (1100) from the theoretical value (6400), it can be inferred that there are 5300 molecules of Aβ (1–42) that are free in the solution per QD particle that is conjugated to Aβ (1–42).
3.1.3. Gel Electrophoresis
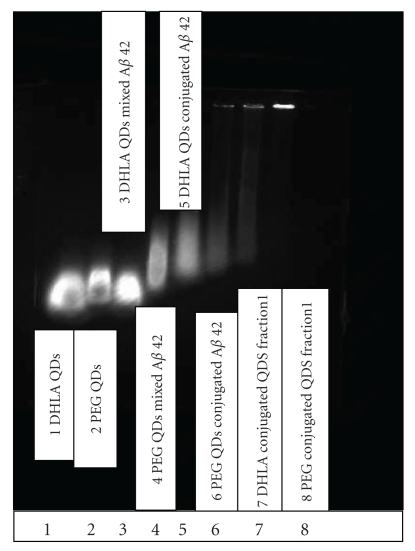
To confirm that the QDs were indeed conjugated to Aβ (1–42), we have used the agarose gel electrophoresis for the control DHLA-capped CdSe/ZnS QDs along with Aβ (1–42) mixed and conjugated to the QDs (Figure 3). The gel was run in TAE buffer (pH 7.4) at 84 V for 75 min, and the volume of the samples in each well was 10 μL. Figure 3 shows the distance moved by three different samples: DHLA-capped QDs (1), Aβ (1–42) mixed with DHLA-capped QDs (3), and Aβ (1–42) conjugated with DHLA-capped QDs (5). From the gel electrophoresis, we can clearly distinguish that the distance moved by the QDs mixed with Aβ (1–42) is the same as for the pure DHLA-capped QDs. Whereas when the QDs are conjugated to Aβ (1–42), the distance moved is lower. This shows that when the QDs are chemically conjugated to Aβ (1–42), the distance moved is reduced due to the higher molecular weight. Moreover, comparison of polyethylene glycol (PEG)-capped QDs (2), Aβ (1–42) mixed PEG-capped QDs (4), and Aβ (1–42) conjugated PEG-capped QDs (6) shows that PEG-capped QDs when conjugated travel the least distance. Purified fractions of DHLA- (7) and PEG-capped (8) QDs conjugated to peptide show that free Aβ (1–42) can be separated from the Aβ (1–42) conjugated QDs. Different fractions of 1 mL each obtained from gel chromatography were checked for the presence of free Aβ (1–42) using UV-vis absorption and fluorescence spectroscopy.
Figure 3.
Gel electrophoresis image of DHLA-capped QDs (1) in comparison to DHLA-capped QDs mixed (3) and conjugated (5) to Aβ (1–42). PEG-capped QDs (2) in comparison to PEG-capped mixed (4) and conjugated (6) to Aβ (1–42). The purified fractions using gel chromatography for DHLA- and PEG-capped QDs conjugated to Aβ (1–42) are shown in wells 7 and 8, respectively.
4. Imaging and Analysis
4.1. TEM
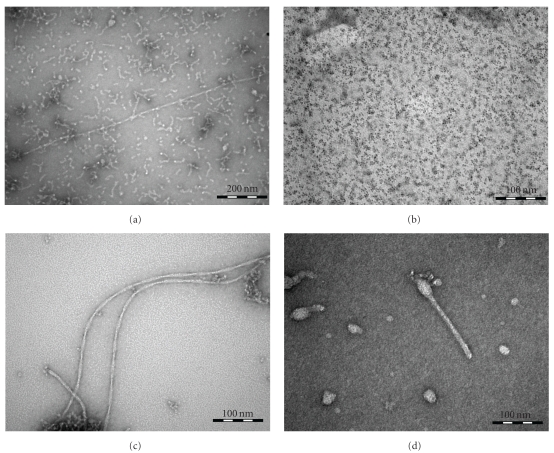
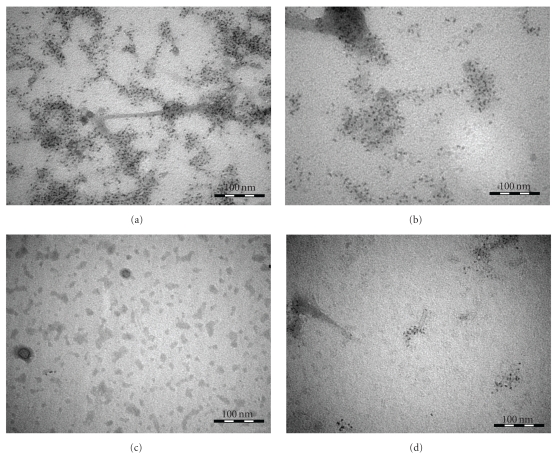
First evidence on the inhibition in fibrillation comes from TEM images (Figure 4) taken on the 7th day of incubation at 37°C. TEM images containing Aβ (1–42) are negatively stained using 2% uranyl acetate solution. Three different samples, namely, pure Aβ (1–42), Aβ (1–42) mixed with DHLA-capped CdSe/ZnS QDs, and Aβ (1–42) conjugated to DHLA-capped CdSe/ZnS QDs, are shown in Figures 4(a), 4(c), and 4(d), respectively. In all the three samples, the concentration of Aβ (1–42) is 0.96 × 10⁻⁴ M and the concentration of QDs is 1.4 μM. Figure 4(a) shows a TEM image of pure Aβ (1–42). Analysis of this image indicates that the length of the fibrils varies from 30 to 1730 nm. The width of the shorter fibrils is 4.0 ± 0.7 nm whereas for the longer fibrils it is 7.5 ± 0.5 nm. Figure 4(b) presents the pure DHLA-capped CdSe/ZnS QDs, the average particle size is 2.5 ± 1.3 nm (Figure 5(a)). The size of QDs is an important parameter for the biodiagnostic studies, since smaller size QDs are capable of passing through the blood-brain barrier [15, 16]. Figure 4(c) shows the incubated sample of Aβ (1–42) in the presence of QDs whereas Figure 4(d) shows Aβ (1–42) conjugated QDs. Comparison of the results in the three images containing Aβ (1–42) illustrates very interesting pattern. Sample containing pure Aβ (1–42), Figure 4(a), has a large number of fibrils ranging from short fibrils around 30 nm to long fibrils around 2 micron whereas images of samples in presence of QDs are very different. Figure 4(c) is the image of Aβ (1–42) mixed with QDs; it shows long-length fibrils of around 1 micron. The short-length fibrils are not very significant in this case. The width of the fibrils for the sample having mixed QDs is 7.7 ± 0.7 nm. Figure 4(d) for Aβ (1–42) conjugated to QDs shows short-length fibrils ranging from 30 to 80 nm. For this sample, the thickness or width of the fibrils is 10 ± 3 nm. The variation in the thickness of fibrils is significant in this case as compared to the other two. One can see a distinguishable inhibition of the fibrillation when Aβ (1–42) is conjugated to QDs.
Figure 4.
TEM images: (a) Aβ (1–42) in PBS buffer (pH 7.4); (b) DHLA-capped QDs; (c) Aβ (1–42) mixed with DHLA-capped QDs in PBS buffer (pH 7.4); (d) Aβ (1–42) conjugated to DHLA-capped QDs in PBS buffer (pH 7.4).
Figure 5.
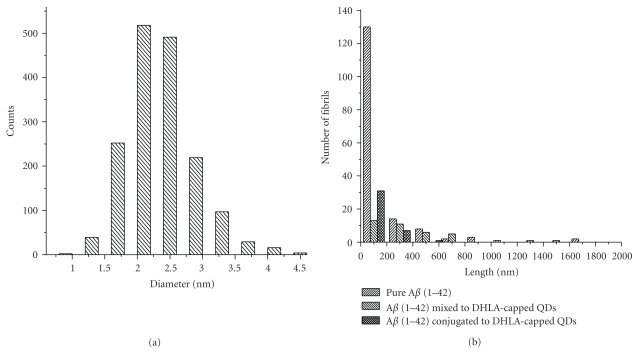
(a) Histogram for the size distribution of DHLA-capped CdSe/ZnS QDs; (b) statistical analysis of number of fibrils versus length of fibrils for three different samples containing Aβ (1–42) mixed to DHLA-capped QDs, Aβ (1–42) conjugated to DHLA-capped QDs, and pure Aβ (1–42).
Histogram showing the size of DHLA-capped QDs is shown in Figure 5(a). The average size analyzed from the histogram obtained from TEM images is 2.5 ± 1.3 nm. Furthermore, to consolidate the results, we have performed the statistical analysis on the TEM images (13–18 images per sample). The number of short-length fibrils (80–150 nm) observed in the sample containing pure Aβ (1–42) was extremely high as compared to samples containing QDs. Statistical analysis showed (Figure 5(b)) that the number of fibrils having length 50–100 nm dropped to 90% in the case of Aβ (1–42) mixed to QDs. There were only 26% of short-length fibrils observed for Aβ (1–42) conjugated to QDs. The total number of fibrils in the samples containing QDs mixed or conjugated to Aβ (1–42) was similar (35 fibrils approximately). These results confirm that elongation of fibrils is inhibited by the presence of the QDs. Figures 6(a) and 6(b) show the TEM images of unstained samples of Aβ (1–42) mixed with QDs. Contrary to the TEM images of stained samples where we can observe only fibrils and no QDs, in this case, we were able to observe the QDs, as well as fibrils. It could be discerned from the results that QDs are enveloping the fibrils and more number of QDs are observed at the ends of the fibrils. For the samples containing Aβ (1–42) conjugated to QDs (Figures 6(c) and 6(d)), we could observe less number of QDs and short-length fibrils. The QDs observed in this case are segregated at one end of the fibrils as seen in Figure 6(d). It could be infered from the results obtained using unstained samples (Figure 6) that QDs envelop the fibrils and could block the ends to elongate. Importance of the C terminus of the Aβ (1–42) in controlling the self-assembly of fibrillation was revealed before [17]. The reason for the inhibition of fibrillation in presence of QDs could be that the small size of particles could block the C-terminal end of the fibrils (~10 nm) or the protofibrils (~5 nm in diameter), which is considered as the terminus with lower degree of freedom and accessibility for elongation mechanism [18]. Furthermore, binding between the QDs and the Aβ (1–42) could block the active sites leading to low local protein concentration, hence increasing the lag time for nucleation or disrupting the nucleation process leading to inhibition of the fibrillation process [19]. Besides, presence of Aβ (1–42) conjugated to QDs in the sample containing free Aβ (1–42) may perturb the nucleation mechanism with decrease in localised concentration of the Aβ (1–42) as thereby inhibiting fibrillation process [19, 20]. However, mixed sample of Aβ (1–42) and the QDs might increase the localised concentration of the polypeptide, thereby increasing the length of fibrils but the number of fibrils still remains low suggesting that there is a perturbation in the mechanism of the fibrillation process [20].
Figure 6.
TEM images of the unstained samples of Aβ (1–42) mixed to DHLA-capped QDs (a), (b) and Aβ (1–42) conjugated to DHLA-capped QDs (c), (d).
4.2. AFM
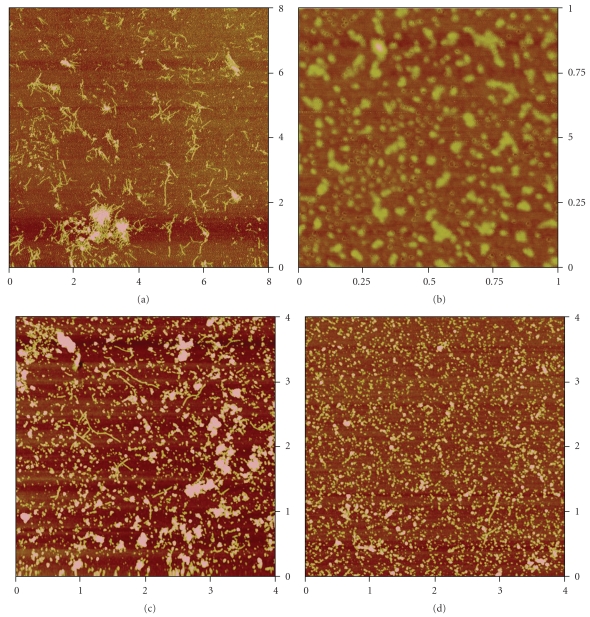
The TEM results are supported by the AFM images as shown in Figure 7 for the 7th day of incubation at 37°C. Analysis of AFM image for Aβ (1–42) in absence of QDs (Figure 7(a)) shows that the length of the longest fibril is 523 nm and the shortest fibril is 30 nm. A bigger number of short length fibrils (30–80 nm) are observed as witnessed by the TEM images whereas in the sample containing Aβ (1–42) mixed to QDs (Figure 7(c)) the length of the longest fibrils is 849 nm, comparable to the length of fibrils (1 μm) found in the TEM images. However, when we compare the length of fibrils (Figure 7(d)) in the sample containing Aβ (1–42) conjugated to QDs, very few long fibrils were observed, which correspond to the TEM images of the same sample. The length of the longest fibrils found is 468 nm and the shortest fibril is 58 nm, while in the case of the TEM images the length of fibrils is between 30 and 80 nm. The height analysis of QDs (Figure 7(b)) shows that the root mean square height of QDs is 2.3 nm, which is comparable to the average height of QDs found in TEM images (2.5 ± 1.3 nm).
Figure 7.
AFM images: (a) Aβ (1–42) in PBS buffer (pH 7.4), 8 μm × 8 μm; (b) DHLA-capped QDs, 1 μm × 1 μm; (c) Aβ (1–42) mixed with DHLA-capped QDs in PBS buffer (pH 7.4), 4 μm × 4 μm; (d) Aβ (1–42) conjugated to DHLA-capped QDs in PBS buffer (pH 7.4), 4 μm × 4 μm.
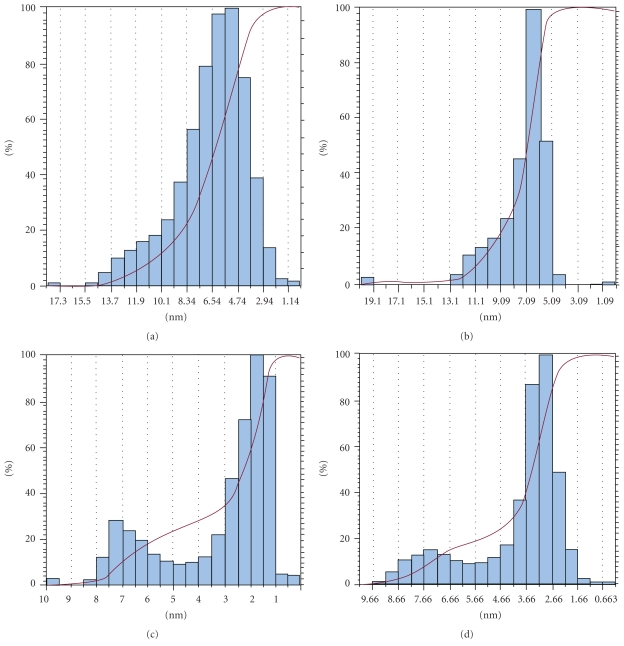
The measurement of Z-height of the Aβ aggregates shows that when Aβ (1–42) is conjugated to QDs the height distribution histogram changes significantly. It is known for the Aβ oligomers that the average height is between 3 and 5 nm, and for the fibrils it varies from 3 to 9 nm [21, 22]. From the height distribution curves (Figure 8) one can see that in the case of amyloid fibrils in absence of QDs 40% of aggregates have height greater than 8 nm whereas 60% of aggregates have height between 6 and 8 nm. For the sample of Aβ (1–42) mixed with QDs, 30% of the aggregates have height greater than 7 nm, and 70% of the aggregates have height between 1 and 3 nm. Interestingly, when we analyze the height distribution for Aβ (1–42) conjugated to QDs only 14% of the aggregates have height greater than 7 nm. Almost 90% of the aggregates have height between 2 and 4 nm.
Figure 8.
Histogram representing height of fibrils or particles versus percentage of fibrils or particles for (a) pure Aβ (1–42), (b) DHLA-capped QDs, (c) Aβ (1–42) mixed with DHLA-capped QDs, and (d) Aβ (1–42) conjugated to DHLA-capped QDs.
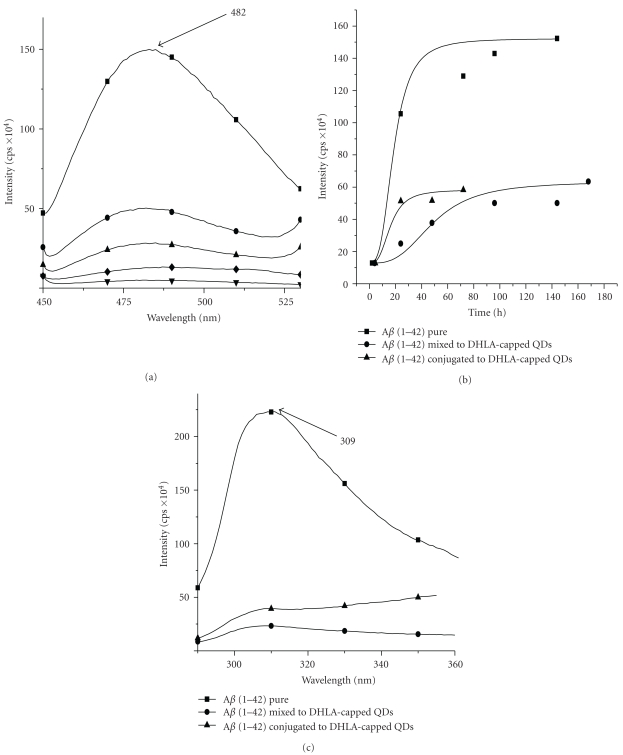
To further examine the fibrillation process and to support the image analysis, we have performed the ThT assay for the three incubated samples. It is known that the fluorescence intensity of the ThT dye grows with increasing concentration of fibrils. It has to be pointed out that previous studies confirmed that the fluorescence enhancement of ThT depends upon the structure of the aggregated state of the amyloid peptides [23, 24]. Figure 9(a) shows the ThT assay on the 7th day for the samples incubated at 37°C. When the pure solution of 10 μM ThT in PBS buffer (pH 7.4) is excited at 440 nm, the emission band at 482 nm is observed with a very low intensity. In the presence of amyloid fibrils, the ThT emission band at 482 nm is enhanced significantly. For the sample containing QDs mixed to the fibrils, the intensity of the emission band at 482 nm is decreased by 66% as compared to the band for pure amyloid fibrils. Whereas the amyloid fibrils, conjugated to QDs show a decrease in intensity for the emission band by 40% as compared to the QDs mixed to the fibrils. Time course of fibrillation process using ThT can be seen in Figure 9(b). The variation of ThT intensity yields information regarding the extent of fibrillation. For the sample containing pure Aβ (1–42), a sigmoidal curve is observed, lag phase is between 0 and 24 h, and rapid progress in fibrillation is observed after 50 h of incubation. However, for the sample containing DHLA-capped QDs mixed to Aβ (1–42), lag time is increased to 48 h and it can be observed with decrease in intensity of fluorescence that the QDs are inhibiting the fibril formation. Similarly, in the case of sample containing Aβ (1–42) conjugated to the DHLA-capped QDs, a decrease in intensity of fluorescence and completion of saturation in fibrillation are observed at 72 h. These results show, in the presence of QDs, that the self-assembly of Aβ (1–42) is perturbed.
Figure 9.
(a) ThT fluorescence after 7 days of incubation at 37°C for Aβ (1–42) (■); ThT assay after 7 days of incubation at 37°C for Aβ (1–42) mixed DHLA-capped QDs (•); ThT assay after 7 days of incubation at 37°C for Aβ (1–42) conjugated DHLA-capped QDs (▴);10 μM Thioflavin T (♦); 0.96 μM Aβ (1–42) (▾); (b) thioflavin T fluorescence monitored over a period of 7 days for incubated samples of pure Aβ (1–42) in comparison to Aβ (1–42) mixed and conjugated to QDs; (c) tyrosine emission intensity of the Aβ (1–42) at excitation wavelength 280 nm, quenched in the presence of QDs.
A remarkable diminution in fibrillation process in the presence of QDs and a significant change in morphology are observed. Contrary to the results that have been published previously on the nanoparticles such as TiO2, copolymer particles, cerium oxide, QDs, and carbon nanotubes behaving as catalyst for fibrillation [5, 8], we did not observe the same behavior for the DHLA-capped CdSe/ZnS QDs. Moreover, our results are in line with a very recent publication showing the inhibition of Aβ (1–40) by CdTe nanoparticles which have similar diameter size (3–5 nm) [6]. Major difference from other set of nanoparticles being used could be the composition and the size of the particles. The size range for the particles that have been used for the previous studies varies from 16 to 200 nm whereas the QDs used in our work have an average size of 2.5 ± 1.3 nm.
To investigate the effect on the tyrosine residue, which is an intrinsic probe of Aβ (1–42), we have examined the tyrosine fluorescence spectra for the three samples on the 7th day of incubation at 37°C. There is a notable quenching of the tyrosine fluorescence intensity at 309 nm (Figure 9(c)) in the presence of mixed or conjugated QDs. This effect could be due to the fact that the tyrosine moiety (Tyr10) interacts with the QDs. For example, the three histidine residues (His6, His13, and His14) in the vicinity of the tyrosine may interact or form coordination bond with the surface of QDs [25]. This phenomenon happens due to the presence of overcoated ZnS shell offering Zn ions [26], hence rendering tyrosine to interact with QDs and consequently decreasing significantly the fluorescence intensity of tyrosine band. Another explanation could be the FRET mechanism between the donor (tyrosine moiety) and the acceptor (QDs), since there is an overlap between the absorption spectrum of the acceptor (QDs) and the emission spectrum of the donor (tyrosine). FRET efficiency in case of Aβ (1–42) conjugated to QDs was 0.84 whereas for Aβ (1–42) mixed with QDs was 0.94. It could be interpreted that the Forster distance (Ro) between the Aβ (1–42) and QDs in aqueous solution was less than 60 Å which is the critical distance for energy transfer [27]. It means that in both the samples, Aβ (1–42) mixed with or conjugated to QDs, Aβ (1–42) is present very near to the QDs. This is an indirect evidence that QDs are present very near to fibrils; that is also observed in the TEM images of the unstained samples (Figure 6).
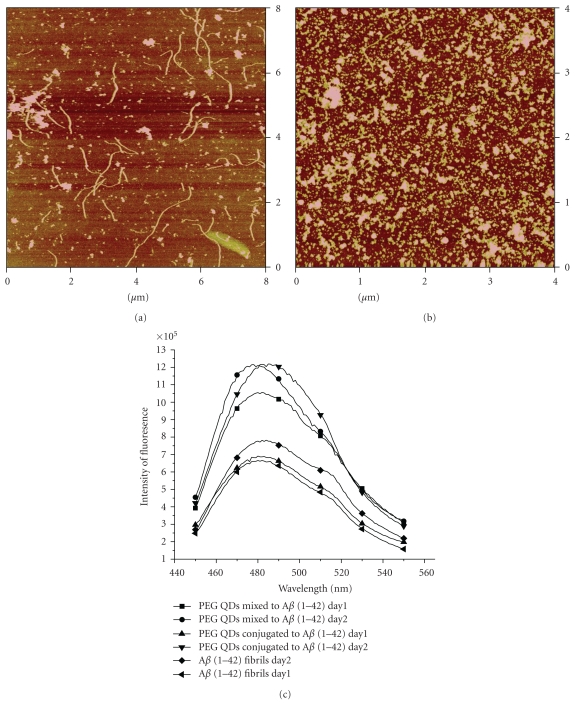
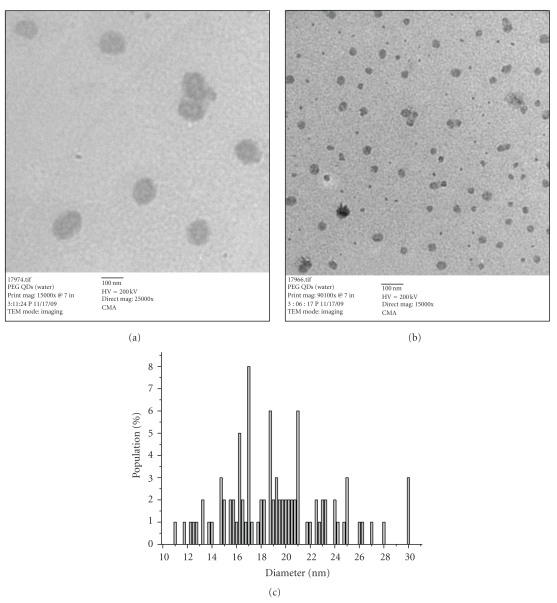
Furthermore, to examine the inhibition effect of CdSe/ZnS QDs, we performed the same set of experiments using polyethylene glycol (PEG) (MW 400)-capped CdSe/ZnS QDs. No inhibition on fibrillation process is observed when PEG-capped QDs are mixed or conjugated to Aβ (1–42). Figures 10(a) and 10(b) show the AFM images of PEG-capped QDs conjugated and mixed to Aβ (1–42), respectively, after 2 days. The length of the fibrils is between 700 nm and 3 μm and the height of oligomers is observed between 2.5 and 5.9 nm. Increase in intensity of fluorescence at 482 nm for the PEG-capped QDs mixed or conjugated with Aβ (1–42) shows that there is increase in fibrillation in presence of PEG-capped QDs. Experiments were also designed where DHLA- or PEG-capped QDs were purified using gel chromatography to check the inhibition effect. Similar results are obtained over a period of 72 h with the purified fractions of DHLA-or PEG-capped QDs, that is, inhibition and absence of inhibition on fibrillation process, respectively. It shows that if we change the ligand of the QDs, it changes its behavior towards the fibrillation process. The emission band for the PEG-capped QDs was observed at 472 nm, when the excitation wavelength was set at 467 nm. The absorption maxima was observed at 456 nm. The average size for the PEG-capped QDs obtained using TEM analysis was 19.4 ± 4.7 nm (Figure 10). This change in behavior might be due to the fact that PEG-capped QDs tend to aggregate in buffer solutions, and PEG polymer increases the size of the QDs [28]. These two factors make the QDs nanoparticles less dynamic in solution and less accessible for the Aβ (1–42) monomers, where the nanoparticles can block the active sites for extended fibrillation.
Figure 10.
AFM image of (a) PEG-capped QDs conjugated with Aβ (1–42) in PBS buffer (pH 7.4), 8 μm × 8 μm; (b) PEG-capped QDs mixed with Aβ (1–42) in PBS buffer (pH 7.4), 4 μm × 4 μm; (c) comparison of ThT fluorescence for 2 days for PEG-capped QDs mixed and conjugated with Aβ(1–42) and pure Aβ (1–42) fibrils.
Figures 11(a) and 11(b) show the TEM images of PEG-capped QDs. The average size for the PEG-capped QDs obtained using TEM analysis was 19.4 ± 4.7 nm as illustrated in the histogram (Figure 11(c)).
Figure 11.
((a), (b))TEM images of PEG-capped QDs (scale bar 100 nm). (c) Diameter distribution of PEG-capped QDs.
5. Conclusion
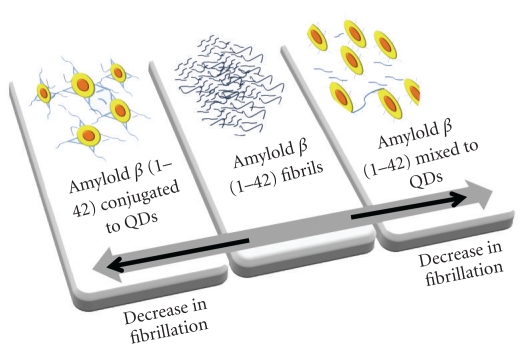
QDs mixed or conjugated to Aβ (1–42) show a decrease in the fibrillation as compared to pure Aβ (1–42), when incubated at 37°C for 7 days. TEM images show difference in morphology and length of the fibrils. Longer fibrils (2 micron) are observed in the sample containing Aβ (1–42) mixed with QDs. Pure Aβ (1–42) sample contained large number of short- and long-length fibrils (30–1730 nm). Thicker and shortest length fibrils (30–80 nm) are observed in the case of Aβ (1–42) conjugated to QDs. The height analysis of AFM images shows significant decrease in height of aggregates greater than 7 nm (only 14%) when QDs are conjugated to Aβ (1–42) and 30% when QDs are mixed to Aβ (1–42) as compared to pure Aβ (1–42) solution. ThT assay for the samples confirmed the inhibition of the fibrillation process when Aβ (1–42) is mixed or conjugated to QDs. Moreover, quenching of tyrosine signal is observed in the presence of QDs, which indicates an interaction of the QDs with the Tyr residue in Aβ (1–42). However, in presence of PEG-capped QDs mixed or conjugated to Aβ (1–42), an absence of inhibition on fibrillation is observed as revealed by AFM images and ThT fluorescence. The conclusion of this work is presented in Figure 12 that shows diminution in fibrillation in presence of DHLA-capped QDs, either mixed with or conjugated to Aβ (1–42).
Figure 12.
Diminution of fibrillation process in presence of DHLA-capped QDs.
To investigate the use of QDs in vivo studies is very important part of biomedical applications, there is a recent investigation showing the use of QDs for imaging and delivery purposes, where QDs carrying SNARE-tagged Rbd were delivered at the synaptic contacts in the cultures from hippocampal neurons obtained from mice [29]. Moreover, QDs doped with SiO2 nanoparticles showed imaging and gene carrier capabilities, it was demonstrated that these QDs were internalized by primary cortical neural cells without inducing cell death in vitro and in vivo [30]. Point to be noted is CdSe quantum dots are toxic and might not be used for medicinal purposes. However, some toxicology studies have shown that the toxicity of QDs is size and concentration dependent [19]. For example, cytotoxicity studies of CdSe QDs on B16 F10 melanoma cells, and C57/BL6 mice showed no detectable toxicity [31]. Early studies have shown high toxicity of CdSe QDs due to the release of toxic Cd2+ ions [32]; however, coating of ZnS has shown to reduce the toxicity in cell culture to a great extent [33]. Nevertheless, extensive studies are required in the field of toxicology. In the light of these studies, it would be important to test Aβ (1–42) mixed with or conjugated to QDs in the cultures from neurons of mice to investigate the effect of QDs in in vivo systems.
Acknowledgments
This work is supported by the Scientific Award Committee (SAC)-Pilot Study Award (Miller School of Medicine, University of Miami) and Science Foundation Ireland (PIYRA).
References
- 1.Colvin VL, Kulinowski KM. Nanoparticles as catalysts for protein fibrillation. Proceedings of the National Academy of Sciences of the United States of America. 2007;104(21):8679–8680. doi: 10.1073/pnas.0703194104. [DOI] [PMC free article] [PubMed] [Google Scholar]
- 2.Marina GB, Kirkitadze D, Lomakin A, Vollers SS, Benedek GB, Teplow DB. Amyloid β-protein (Aβ) assembly: Aβ40 and Aβ42 oligomerize through distinct pathways. Proceedings of the National Academy of Sciences of the United States of America. 2003;100(1):330–335. doi: 10.1073/pnas.222681699. [DOI] [PMC free article] [PubMed] [Google Scholar]
- 3.Skaat H, Belfort G, Margel S. Synthesis and characterization of fluorinated magnetic core-shell nanoparticles for inhibition of insulinamyloid fibril formation. Nanotechnology. 2009;20(22) doi: 10.1088/0957-4484/20/22/225106. Article ID 225106. [DOI] [PubMed] [Google Scholar]
- 4.Skaat H, Sorci M, Belfort G, Margel S. Effect of maghemite nanoparticles on insulin amyloid fibril formation: selective labeling, kinetics, and fibril removal by a magnetic field. Journal of Biomedical Materials Research A. 2009;91(2):342–351. doi: 10.1002/jbm.a.32232. [DOI] [PubMed] [Google Scholar]
- 5.Linse S, Cabaleiro-Lago C, Xue WF, et al. Nucleation of protein fibrillation by nanoparticles. Proceedings of the National Academy of Sciences of the United States of America. 2007;104(21):8691–8696. doi: 10.1073/pnas.0701250104. [DOI] [PMC free article] [PubMed] [Google Scholar]
- 6.Xiao L, Zhao D, Chan WH, Choi MMF, Li HW. Inhibition of beta 1–40 amyloid fibrillation with N-acetyl-l-cysteine capped quantum dots. Biomaterials. 2010;31(1):91–98. doi: 10.1016/j.biomaterials.2009.09.014. [DOI] [PubMed] [Google Scholar]
- 7.Cabaleiro-Lago C, Quinlan-Pluck F, Lynch I, Dawson KA, Linse S. Dual effect of amino modified polystyrene nanoparticles on amyloid β protein fibrillation. ACS Chemical Neuroscience. 2010;1(4):279–287. doi: 10.1021/cn900027u. [DOI] [PMC free article] [PubMed] [Google Scholar]
- 8.Wu WH, Sun X, Yu YEP, et al. TiO nanoparticles promote β-amyloid fibrillation in vitro. Biochemical and Biophysical Research Communications. 2008;373(2):315–318. doi: 10.1016/j.bbrc.2008.06.035. [DOI] [PubMed] [Google Scholar]
- 9.Peng ZA, Peng X. Formation of high-quality CdTe, CdSe, and CdS nanocrystals using CdO as precursor. Journal of the American Chemical Society. 2001;123(1):183–184. doi: 10.1021/ja003633m. [DOI] [PubMed] [Google Scholar]
- 10.Gunsalus IC, Barton LS, Gruber W. Biosynthesis and structure of lipoic acid derivatives. Journal of the American Chemical Society. 1956;78(8):1763–1766. [Google Scholar]
- 11.Hermanson GT. Bioconjugate Techniques. 2nd edition. chapter 9. San Diego, Calif, USA: Academic Press; 2008. pp. 491–495. [Google Scholar]
- 12.Hainfeld JF, Furuya FR. A 1.4 nm gold cluster covalently attached to antibodies improves immunolabeling. Journal of Histochemistry and Cytochemistry. 1992;40(2):177–184. doi: 10.1177/40.2.1552162. [DOI] [PubMed] [Google Scholar]
- 13.Takizawa T, Robinson JM. Use of 1.4 nm immungold particles for immunochemistry on ultra-thin cryosections. Journal of Histochemistry and Cytochemistry. 1994;42:1615–1623. doi: 10.1177/42.12.7983362. [DOI] [PubMed] [Google Scholar]
- 14.Carrotta R, Di Carlo M, Manno M, et al. Toxicity of recombinant beta-amyloid prefibrillar oligomers on the morphogenesis of the sea urchin Paracentrotus lividus. The FASEB Journal. 2006;20(11):1916–1917. doi: 10.1096/fj.06-5716fje. [DOI] [PubMed] [Google Scholar]
- 15.Thorne RG, Nicholson C. In vivo diffusion analysis with quantum dots and dextrans predicts the width of brain extracellular space. Proceedings of the National Academy of Sciences of the United States of America. 2006;103(14):5567–5572. doi: 10.1073/pnas.0509425103. [DOI] [PMC free article] [PubMed] [Google Scholar]
- 16.Bonoiu A, Mahajan SD, Ye L, et al. MMP-9 gene silencing by a quantum dot-siRNA nanoplex delivery to maintain the integrity of the blood brain barrier. Brain Research. 2009;1282:142–155. doi: 10.1016/j.brainres.2009.05.047. [DOI] [PMC free article] [PubMed] [Google Scholar]
- 17.Bitan G, Teplow DB. Rapid photochemical cross-linking—a new tool for studies of metastable, amyloidogenic protein assemblies. Accounts of Chemical Research. 2004;37(6):357–364. doi: 10.1021/ar000214l. [DOI] [PubMed] [Google Scholar]
- 18.Roychaudhuri R, Yang M, Hoshi MM, Teplow DB. Amyloid β-protein assembly and Alzheimer disease. Journal of Biological Chemistry. 2009;284(8):4749–4753. doi: 10.1074/jbc.R800036200. [DOI] [PMC free article] [PubMed] [Google Scholar]
- 19.Sanvicens N, Marco MP. Multifunctional nanoparticles—properties and prospects for their use in human medicine. Trends in Biotechnology. 2008;26(8):425–433. doi: 10.1016/j.tibtech.2008.04.005. [DOI] [PubMed] [Google Scholar]
- 20.Fei LI, Perrett S. Effect of nanoparticles on protein folding and fibrillogenesis. International Journal of Molecular Sciences. 2009;10(2):646–655. doi: 10.3390/ijms10020646. [DOI] [PMC free article] [PubMed] [Google Scholar]
- 21.Chromy BA, Nowak RJ, Lambert MP, et al. Self-assembly of Aβ1-42 into globular neurotoxins. Biochemistry. 2003;42(44):12749–12760. doi: 10.1021/bi030029q. [DOI] [PubMed] [Google Scholar]
- 22.Rangachari V, Moore BD, Reed DK, et al. Amyloid-β(1–42) rapidly forms protofibrils and oligomers by distinct pathways in low concentrations of sodium dodecylsulfate. Biochemistry. 2007;46(43):12451–12462. doi: 10.1021/bi701213s. [DOI] [PubMed] [Google Scholar]
- 23.LeVine H., III Thioflavin T interaction with amyloid β-sheet structure amyloid. International Journal of Clinical and Experimental Investigation. 1995;2:1–6. [Google Scholar]
- 24.LeVine III H. Thioflavine T interaction with synthetic Alzheimer's disease β-amyloid peptides: detection of amyloid aggregation in solution. Protein Science. 1993;2(3):404–410. doi: 10.1002/pro.5560020312. [DOI] [PMC free article] [PubMed] [Google Scholar]
- 25.Maiti NC, Jiang D, Wain AJ, Patel S, Dinh KL, Zhou F. Mechanistic studies of cu(II) binding to amyloid-β peptides and the fluorescence and redox behaviors of the resulting complexes. Journal of Physical Chemistry B. 2008;112(28):8406–8411. doi: 10.1021/jp802038p. [DOI] [PubMed] [Google Scholar]
- 26.Goldman ER, Medintz IL, Hayhurst A, et al. Self-assembled luminescent CdSe-ZnS quantum dot bioconjugates prepared using engineered poly-histidine terminated proteins. Analytica Chimica Acta. 2005;534(1):63–67. [Google Scholar]
- 27.Joseph R. Principles of Fluorescence Spectroscopy. 3rd edition. chapter 13. New York, NY, USA: Springer; 2006. Lakowics; pp. 443–448. [Google Scholar]
- 28.Muro E, Pons T, Lequeux N, et al. Small and stable sulfobetaine zwitterionic quantum dots for functional live-cell imaging. Journal of the American Chemical Society. 2010;132(13):4556–4557. doi: 10.1021/ja1005493. [DOI] [PubMed] [Google Scholar]
- 29.Darios F, Niranjan D, Ferrari E, et al. SNARE tagging allows stepwise assembly of a multimodular medicinal toxin. Proceedings of the National Academy of Sciences of the United States of America. 2010;107(42):18197–18201. doi: 10.1073/pnas.1007125107. [DOI] [PMC free article] [PubMed] [Google Scholar]
- 30.Bardi G, Malvindi MA, Gherardini L, et al. The biocompatibility of amino functionalized CdSe/ZnS quantum-dot-Doped SiO nanoparticles with primary neural cells and their gene carrying performance. Biomaterials. 2010;31(25):6555–6566. doi: 10.1016/j.biomaterials.2010.04.063. [DOI] [PubMed] [Google Scholar]
- 31.Voura EB, Jaiswal JK, Mattoussi H, Simon SM. Tracking metastatic tumor cell extravasation with quantum dot nanocrystals and fluorescence emission-scanning microscopy. Nature Medicine. 2004;10(9):993–998. doi: 10.1038/nm1096. [DOI] [PubMed] [Google Scholar]
- 32.Lovrić J, Cho SJ, Winnik FM, Maysinger D. Unmodified cadmium telluride quantum dots induce reactive oxygen species formation leading to multiple organelle damage and cell death. Chemistry and Biology. 2005;12(11):1227–1234. doi: 10.1016/j.chembiol.2005.09.008. [DOI] [PubMed] [Google Scholar]
- 33.Nel A, Xia T, Mädler L, Li N. Toxic potential of materials at the nanolevel. Science. 2006;311(5761):622–627. doi: 10.1126/science.1114397. [DOI] [PubMed] [Google Scholar]


