Abstract
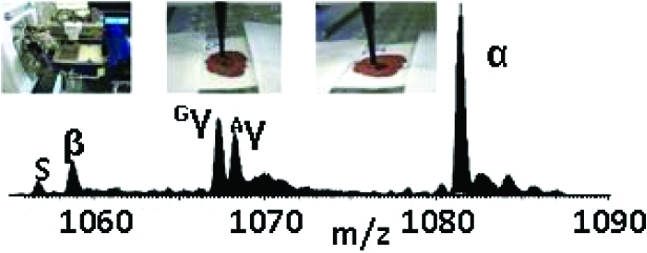
Hemoglobinopathies are the most common inherited disorders. Newborn blood screening for clinically significant hemoglobin variants, including sickle (HbS), HbC, and HbD, has been adopted in many countries as it is widely acknowledged that early detection improves the outcome. We present a method for determination of Hb variants by direct surface sampling of dried blood spots by use of an Advion Triversa Nanomate automated electrospray system coupled to a high-resolution mass spectrometer. The method involves no sample preparation. It is possible to unambiguously identify homozygous and heterozygous HbS, HbC, and HbD variants in <10 min without the need for additional confirmation. The method allows for repeated analysis of a single blood spot over a prolonged time period and is tolerant of blood spot storage conditions.
Adult hemoglobin (HbA) exists as a tetramer of noncovalently bound globin chains, consisting of two α and two β subunits. Fetal hemoglobin (HbF), with its increased oxygen affinity, is composed of two α and two γ subunits (α2γ2). The γ subunits are homologous to the β chain, differing by 39 amino acids, and fetal hemoglobin is usually present in the blood until six months after birth. The γ subunits comprise of one Aγ and one Gγ, which corresponds to the amino acid at position 136 in the globin chains (Aγ an alanine and Gγ a glycine).(1) Abnormalities of hemoglobin, hemoglobinopathies, are the most common type of inherited disease. According to the hemoglobin variant database HbVar (http://globin.cse.psu.edu), there are over 1000 hemoglobin (Hb) variations.(2) These variants are usually the result of point mutations in a globin gene producing a single amino acid substitution in a globin chain, most commonly the β chain.
The vast majority of Hb variants have little clinical significance; however, the HbS mutation, in which a glutamic acid at position 6 in the β chain is substituted for valine (Δm = 29.9745 Da), is responsible for sickle cell disease. Sickle cell disease affects the oxygen-carrying capacity of red blood cells. The sickle trait is caused by one abnormal allele of the hemoglobin β gene (heterozygous) and does not display the severe symptoms of homozygotes. Patients with sickle cell disease experience reduced life spans,(3) and 15% of young children with sickle cell disease die due to acute infections and other sickle-related complications. The rapid detection of sickle cell disease dramatically reduces mortality in the first 5 years of life.(4)
Other common hemoglobinopathies include hemoglobin C (HbC) in which position 6 of the β chain is substituted (glutamic acid to lysine) resulting in a mass difference of less than −1 Da (Δm = 0.9476 Da). The disease state requires both abnormal genes, HbCC (homozygote), whereas trait, HbAC (heterozygote), is asymptomatic. Symptoms of the disease state include mild/moderate anemia and hemolysis.(5) The coinheritance of βS and βC (HbSC) leads to a sickling disorder similar to sickle cell disease but generally less severe.(6) The hemoglobin D variant is caused by a mutation on the β chain at position 121 (glutamic acid for a glutamine), also resulting in a mass shift of less than −1 Da (Δm = 0.9840 Da). The hemoglobin D (HbAD) trait (heterozygote) again causes no clinical manifestations but if coinherited with sickle (HbSD) causes considerable sickle-like health problems. In its homozygous state, HbD causes hemoglobin D disease which manifests as mild to moderate anemia.7,8 Hb variants with significant clinical outcomes, such as homozygous sickle cell disease, have a prevalence rate of 1 in 2000 births.9,10 Over a 2 year screening period, 17 000 carriers (heterozygous for Hb variants) were identified from almost 1.2 million infants.(10)
Early screening for hemoglobinopathies allows for appropriate genetic counselling and an improvement in the outcome of patients with sickle cell disease. Newborn blood screening has been adopted in the majority of countries around the world. The U.K. screening program screens over 700 000 newborns a year for sickle cell disease,(10) as well as congenital hypothyroidism (CHT), phenylketonuria (PKU), cystic fibrosis (CF), and medium chain acyl-CoA dehydrogenase deficiency (MCADD).(11) Blood samples are taken 5−8 days after birth via a heel prick and collected on filter paper cards. The majority of laboratories participating in the screening process employ cation exchange high-performance liquid chromatography (ceHPLC) followed by isoelectric focusing (IEF) for result confirmation.10,12 Subsequent amino acid sequencing of unusual abnormalities means the entire process can take weeks or even months for some variants.(13) Preparation of samples for both ceHPLC and IEF involves punching out 3 mm blood spots discs from the blood spot card and elution of the sample for 20−30 min. For ceHPLC analysis, the run time per sample is 3 min whereas for IEF it is ∼2 h.(14) Hb has a characteristic retention time in ceHPLC, and variants are presumptively determined from deviations in that retention time. Problematically, some hemoglobin variants coelute, e.g., HbA2, Hb Lepore, and HbE, making results inconclusive and difficult to interpret.12,15 ceHPLC is advantageous in that it can be used for quantification.(16) Hb variants are identified by IEF by comparing pI values with those for control Hb. Again, identification is presumptive rather than absolute.
A procedure for identifying Hb variants by electrospray ionization (ESI) mass spectrometry of diluted whole blood has been described.17−19 That method involves molecular weight determination of intact globin chains to confirm the presence of a variant followed by tryptic digestion of the blood sample and tandem mass spectrometry to identify the site of mutation. Dalton and co-workers have shown that multiple reaction monitoring (MRM) ESI tandem mass spectrometry (MS/MS) of tryptic digests of whole blood can be applied to the identification of Hb variants.(20) In 2004, Wild et al.(21) described a method for the analysis of Hb variants from dried blood spots in which the blood spot is punched out and resolubilized prior to ESI MS of intact globin chains. Dalton and co-workers have since shown that the MRM method can be applied to samples that have been eluted from blood spots and digested with trypsin.(22)
The methods described above are characterized by lengthy sample preparation and/or ambiguous variant determination. The ideal method would encompass direct analysis of the dried blood spot (i.e., no requirement for sample preparation) and absolute identification of the variant from the intact globin chains. Direct analysis of dried blood spots by desorption electrospray ionization (DESI) has been demonstrated for the quantitation of xenobiotics.(23) Earlier this year, Van Berkel and co-workers showed that liquid microjunction surface sampling(24) (or liquid extraction surface analysis) could also be applied to the quantitation of xenobiotics.(25) Liquid microjunction surface sampling was achieved by use of an Advion TriVersa Nanomate via the advanced user interface (AUI) platform of the NanoMate ChipSoftManager software.
Here we have applied liquid microjunction surface sampling of dried blood spots coupled to a high-resolution orbitrap mass spectrometer for the analysis of Hb variants. The method involves no sample preparation other than mounting the dried blood spot card on a microtiter plate. Hb was directly extracted and electrosprayed into the mass spectrometer. The orbitrap mass spectrometer(26) is a high-resolution instrument, and it was possible in selected ion monitoring mode to unambiguously identify both homozygous and heterozygous sickle cell disease (Δm 29.9745 Da). The entire analysis time was 5 min. The variants HbC (both homo- and heterozygous) and HbD (heterozygous) (Δm < 1 Da) were unambiguously identified by collision-induced dissociation tandem mass spectrometry (CID MS/MS). The analysis time was 5−7 min. In addition to meeting the criteria above, namely, fast, direct, and unambiguous determination of Hb variants with no sample preparation, the method allows for repeated analysis of the dried blood spots with no loss of mass spectral response over a prolonged time period (months).
Experimental Section
Materials
Dried blood spots from normal adults (HbA) were collected on standard NHS blood spot cards. Anonymized dried blood spots from normal neonates (FA), heterozygous (FAS) and homozygous (FS) sickle trait neonates, heterozygous (FAC) and homozygous (FC) variant C, and heterozygous (FAD) variant D, acquired from newborn patients between 5 and 8 days, were supplied by Birmingham Children’s Hospital, in accordance with the Code of Practice for the Retention and Storage of Residual Spots.(27) Samples were stored at room temperature prior to analysis. The electrospray solution consisted of methanol (J.T. Baker, Deventer, The Netherlands) and water (J.T. Baker) (48.5:48.5), with 3% formic acid (Sigma-Aldrich Company Ltd., Dorset, U.K.).
Surface Sampling
The individual dried blood spot samples were attached to a 96-well microtiter plate (ABgene PCR plate Thermo Fisher Scientific, Leicestershire, U.K.) using clear tape and placed in the TriVersa Nanomate chip-based electrospray device (Advion, Ithaca, NY) (Figure 1a) coupled to the Thermo Fisher Scientific Orbitrap Velos (Thermo Fisher Scientific, Bremen, Germany).
Figure 1.
Liquid microjunction surface sampling of dried blood spots: (a) blood spot is mounted on TriVersa Nanomate autosampler, (b) sample is wetted with a solution comprising water/methanol/formic acid and the liquid microjunction forms, (c) solution containing the sample is reaspirated.
Sample analysis was performed using the advanced user interface (AUI) feature of the TriVersa NanoMate ChipSoft Manager software, which controls the TriVersa Nanomate. This platform was used to construct a surface-sampling routine based on robotic arm movements (X, Y, Z) of the Nanomate probe. The routine began with (1) the probe collecting a conductive tip (used for sample wetting/recovery and delivery) from the Advion tip rack and moving to a position above a well (located by predetermined grid coordinates) containing a wetting/aspirating solution comprising water/methanol/formic acid (48.5:48.5: 3, v/v). (2) The tip descended to a depth of 2 mm from the bottom of the well and aspirated 7 μL of the electrospray solution. (3) The robotic arm relocated to a predetermined discrete location above the dried blood spot sample (usually the center) then descended to just above the sample. (4) The tip was lowered, and a proportion of the volume of solution (6 μL) was dispensed forming a liquid microjunction (LMJ) between the tip and blood spot. For this study, the ideal depth for tip-to-sample LMJ formation equated to 15.6 mm from the base of the well (Figure 1b). (5) After a user-defined delay of 5 s, during which the LMJ was maintained allowing sufficient time for some of the sample to be dissolved and mixed, 5 μL of the solution was reaspirated into the tip (Figure 1c). (The disparity between volume dispensed and reaspirated allows for evaporation). Empirical observations suggest that delays <5 s result in poor signal-to-noise, and delays >8 s result in collapse of the LMJ. (6) The tip engaged with the back of the ESI chip, and nanospray ionization was initiated. The Triversa Nanomate was coupled with a Thermo Fisher Scientific Orbitrap Velos mass spectrometer.
Mass Spectrometry
The sample was introduced at flow rate of ∼80 nL/min, with a gas pressure of between 0.4 and 0.5 psi, a tip voltage of 1.75 kV, and a capillary temperature of 250 °C. MS data was collected in full scan mode (m/z 700−1400) with a resolution of 100 000 at m/z 400 and in selected ion monitoring (SIM) mode (m/z 1055−1090) at a resolution of 100 000 at m/z 400. Each scan comprises 15 coadded microscans. The mass spectra shown are comprised of approximately 20 scans. Automatic gain control (AGC) was used to accumulate sufficient ions for analysis. The AGC target was 1 × 10⁶ with a maximum fill time of 1 s in full scan mode and 1.5 s SIM mode. CID was performed in the ion trap, and the fragment ions detected in the orbitrap with a resolution of 100 000 at m/z 400. The AGC target was 1 × 10⁶ with a maximum fill time of 2 s and an isolation width of 10 Th. CID experiments were performed with helium gas at a normalized collision energy of 35%. Each CID scan comprises ∼30 coadded microscans. The MS/MS spectra shown (m/z 300−2000) are comprised of 10 coadded scans. Data were analyzed using Xcalibur 2.10 software (Thermo Fisher Scientific) where the Xtract program was used to calculate monoisotopic masses (44% fit factor, 25% remainder).
Results
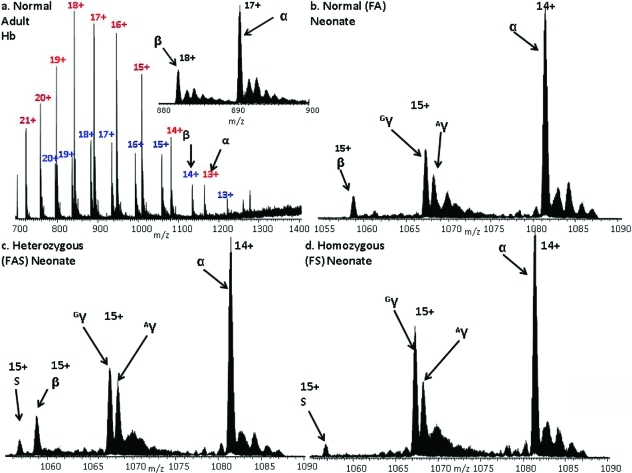
Figure 2a shows the full scan mass spectrum acquired following liquid microjunction surface sampling of a dried blood spot from a normal adult. Each sample was analyzed between 3 and 6 times over a period spanning 5 months. The mass spectrum shows peaks corresponding to α and β chains in various charge states and comprises 10 coadded scans acquired over 3 min. Note that the peaks corresponding to the β chain are less intense than those for the α chain. The β chain contains fewer basic amino acid residues than the α chain and consequently ionizes less readily.
Figure 2.
(a) Full scan and (inset) selected ion monitoring (SIM) mode mass spectra of adult hemoglobin HbA. Peaks labeled in red correspond to the α chains, blue to the β chains; SIM mode mass spectra of (b) normal neonate hemoglobin; (c) neonate heterozygous sickle hemoglobin FAS; (d) neonate homozygous sickle hemoglobin FS. Peaks labeled Gγ and Aγ denote γ chains containing glycine or alanine at position 136, respectively.
Once injected into the mass spectrometer, it is possible to continuously electrospray the sample for a lengthy period (60 min or more) allowing sufficient time to perform additional analyses (selected ion monitoring (SIM) mode, collision-induced dissociation (CID)) as discussed below. The inset of Figure 2a shows a mass spectrum acquired in SIM mode over the m/z range 880−900. Peaks corresponding to the 17+ charge state of the α chain (MWmeas 15 117.9479, MWcalc 15 117.8924, Δ 3.7 ppm) and the 18+ charge state of the β chain (MWmeas 15 858.4251, MWcalc 15 858.2570, Δ 10.6 ppm) are observed.
Peaks corresponding to ions of three major species are observed in the full scan mass spectrum obtained following liquid microjunction surface sampling of a dried blood spot from a normal neonate: α chain, fetal γ chain, and very low abundance β chain. Given that the most severe Hb variants occur in the β chain, the low abundance of these ions could be a problem. However, with acquisition of data in the SIM mode, the signal-to-noise is improved significantly, see Figure 2b. The measured masses of the α, β, and γ chains were MWmeas15 117.8208 Da, MWmeas 15 858.2680 Da, and MWmeas15 986.2933 Da (MWcalc 15 986.2626 Da, Δ 1.9 ppm), respectively.
HbS Variant
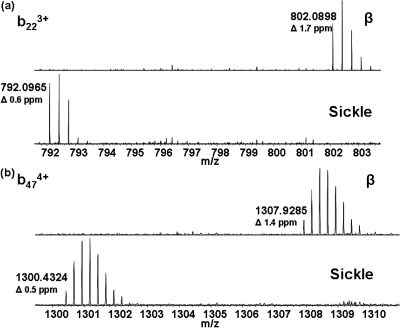
With confirmation that the method was suitable for the analysis of neonatal samples, it was applied to samples homozygous and heterozygous for HbS. It was not possible to determine the presence of HbS from the full scan mass spectra; however, with the data acquired in SIM mode, the variant could be identified unambiguously (MWmeas 15 828.2408 Da; MWcalc 15 828.2828 Da, Δ 2.7 ppm) (Figure 2c,d). The sickle trait sample (heterozygous) can clearly be identified as such by the presence of both the β-chain and the sickle chain, whereas the SIM mode mass spectrum of homozygous sample shows no peak corresponding to the β-chain. The [M + 15H]15+ ions of the β and sickle chains from the heterozygous sample were each selected for CID and the fragments detected in the orbitrap. The MS/MS spectra are shown in Figure SI-1 in the Supporting Information, with the sequence coverage obtained shown in the inset. CID of the β ions gave a sequence coverage of 39%. For the sickle chain ions, sequence coverage was 32%. The sickle variant is the result of substitution at position 6 on the β chain. Following CID of the β chain ions, the singly charged b6 fragment was observed at m/zmeas 677.3628 (m/zcalc 677.3617). No peak was observed at that m/z following CID of the sickle ions; however, a peak was observed at m/z 647.3854, corresponding to a mass shift of 29.9745 Da (Glu → Val) (m/zcalc 647.3875). For both β and sickle samples, peaks corresponding to singly charged b4 ions were observed at m/zmeas 451.2669 and 451.2661, respectively (m/zcalc 451.2663). Expanded m/z regions showing representative fragments b223+ and b474+ are shown in Figure 3a,b.
Figure 3.
Expanded regions of CID MS/MS spectra showing peaks corresponding to (a) b223+ fragment ions and (b) b474+ fragment ions of the β chain and sickle variant. Measured monoisotopic m/z values are given.
HbC Variant
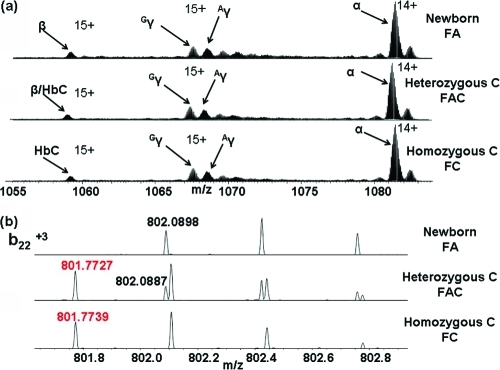
The HbC variant is the result of a Glu → Lys substitution at position 6 on the β chain with an associated mass shift of 0.9476 Da. Figure 4a shows the mass spectra obtained in SIM mode from normal, heterozygous HbC and homozygous HbC samples. Comparison of these SIM mode spectra does not reveal the presence of the HbC variant in either the heterozygous or homozygous form. The spectra were deconvoluted by use of the Xtract software (Thermo Fisher Scientific) to determine the monoisotopic masses of the ions. The measured MW of the β chain from the normal neonate sample was 15 858.2680 Da. For the homozygous variant C sample, the measured MW was 15 857.4033 Da (MWcalc 15 857.3094, Δ 5.9 ppm), suggesting the presence of a variant with a mass shift of −1 Da. However, the molecular weight obtained following deconvolution of the heterozygous sample was 15 857.2442 Da suggesting the presence of the variant but failing to reveal the presence of the β chain. To confirm the presence or otherwise of the HbC variant, in each sample the ions centered at m/z 1058 were selected and subjected to CID. Figure 4b (top) shows an expanded m/z region containing the b223+ fragment ion of the β chain (monoisotopic m/zmeas 802.0898, m/zcalc 802.0884). That fragment was also observed for the heterozygous sample (Figure 4 (middle)) and is accompanied by the b223+ fragment of the HbC variant (monoisotopic m/zmeas 801.7727, m/zcalc 801.7725). In the MS/MS spectrum obtained from the homozygous sample (Figure 4b (bottom)), only the b223+ fragment of the HbC variant is observed. Further examples (b142+ and b474+) are given in SI-2 in the Supporting Information.
Figure 4.
(a) SIM mode mass spectra from normal FA (top), heterozygous HbC (middle), and homozygous HbC (bottom). (α, β, γ (Gγ, and Aγ) chains are indicated; (b) Expanded m/z regions showing the b223+ fragments observed following CID of the β chain ions (m/zcalc 802.0884) (black) and HbC variant ions (m/zcalc 801.7725) (red).
HbD Variant
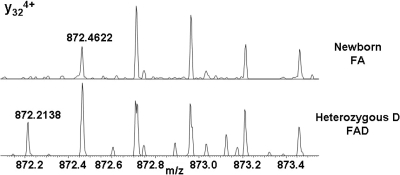
The HbD (Punjab/Los Angeles) variant is the result of a Glu → Gln substitution at position 121 of the β chain resulting in a mass shift of −0.9840 Da. Although the mass shift is greater than for HbC, the HbD variant is more challenging to identify because of the problem of overlapping isotope peaks. The difference in mass between the 13C isotope of HbD and the 12C isotope of the β chain is 0.0194 Da. Figure SI-3 in the Supporting Information shows the SIM mode mass spectra obtained from normal and heterozygous HbD. As for HbC, we are unable to confirm the presence of the variant directly from the SIM spectrum. The [M + 15H]15+ ions of HbD/β were isolated and subjected to CID. The resulting mass spectrum was compared with that obtained following CID of [M + 15H]15+ ions of the β chain. Expanded m/z regions showing the y324+ fragments are shown in Figure 5. Note that for the peaks at m/z 872.7 (13Cβ/13C2HbD) and m/z 872.95 (13C2β/13C3HbD) in the lower spectrum (heterozygous D), the peak shapes suggest the presence of the two species. Further examples are given in Figure SI-4 in the Supporting Information.
Figure 5.
Expanded m/z region showing peaks corresponding to y324+ fragments observed following CID of β chain ions (m/zmeas 872.4622, m/zcalc 872.4600), and variant HbD (m/zmeas 872.2138, m/zcalc 872.2140).
Discussion
The results demonstrate the suitability of direct liquid microjunction sampling of newborn dried blood spots, by use of a Triversa Nanomate chip-based electrospray device coupled with a high-resolution orbitrap mass spectrometer, for the unambiguous determination of Hb variants. No preparation of clinical samples is required, thus sample handling and any subsequent risks are minimized. The inherent low abundance of β chain in newborn blood samples can be addressed by acquiring mass spectral data in SIM mode. Detection of the HbS variant in the SIM mode is straightforward. The mass shift of ∼30 Da equates to an m/z shift of ∼2 for a 15+ ion which is easily detectable in an orbitrap mass spectrometer. The presence/absence of peaks at m/z ∼1056.7 (HbS) and ∼1058.7 (β) allows one to determine the presence and the type (disease or trait) of sickle cell disease without MS/MS. The entire analysis is complete in less than 5 min. Variants HbC and HbD can be identified following CID MS/MS analysis of the intact chains which takes a further 5−8 min. As HbC and HbD cannot be identified directly from the SIM mode scan, if this method were to be incorporated within a screening program, it would be necessary to perform CID analyses on all samples if the aim of the program is to detect these variants in addition to HbS.
At present, the method is automated in terms of analysis of the sample and semiautomated in terms of sample loading. Several dried blood spots are fixed to a single multiwell plate and their coordinates determined. A program sequence is set up such that each dried blood spot may be sampled (SIM mode and MS/MS) during an unattended run. Successful incorporation in a screening program would require automated loading of the samples onto the plate.
Although, clearly the method is destructive, each analysis samples such a tiny fraction of the blood spot that numerous repeats can be performed. Approximately 8.5% of the total surface area is wetted during each surface sampling routine, and empirical observation reveals that each discrete location can be reanalyzed 2−3 times. That suggests that each blood spot can be analyzed up to 35 times. The blood spots used in this study were stored at room temperature and subjected to multiple repeat analyses over a time period of 5 months without discernible loss of signal. The method is therefore tolerant of storage conditions. The possibility for repeat sampling also indicates a potential drawback of the method: so far, it is not possible to quantify the relative Hb components as would be required for the diagnosis of some thalassemias.(15)
The method is potentially applicable to other common Hb variants, including Hb O-Arab, and to unknown variants. Evaluation of the method for those purposes is ongoing.
In this study, we have demonstrated an effective method for direct surface sampling of dried blood spots for the clinical analysis of intact proteins. The method allows rapid, unambiguous determination of Hb variants HbS, HbC, and HbD, with no sample preparation and minimal sample handling. The method shows great promise as a tool for the screening for Hb variants in a clinical setting.
Acknowledgments
The Wellcome Trust (Grant 074131) (H.J.C.) and EPSRC (R.L.E.) are gratefully acknowledged for funding. The Advion TriVersa Nanomate and the Thermo Fisher Scientific Orbitrap Velos mass spectrometer used in this research was obtained through the Birmingham Science City Translational Medicine: Experimental Medicine Network of Excellence Project, with support from Advantage West Midlands (AWM).
Supporting Information Available
(Figure SI-1) CID MS/MS spectra of [M + 15H]15+ ions of the (a) β and (b) sickle chains from a heterozygous sample (sequence coverage shown in inset); (Figure SI-2) expanded m/z regions of the CID MS/MS spectra obtained from normal, heterozygous HbC and homozygous HbC showing the (a) b142+ and (b) b474+ fragment ions; (Figure SI-3) SIM mass spectra obtained from normal and heterozygous HbD samples; (Figure SI-4) expanded m/z regions of the CID MS/MS spectra obtained from normal, and heterozygous HbD showing the (a) y475+ and (b) y364+ fragment ions. This material is available free of charge via the Internet at http://pubs.acs.org.
Supplementary Material
References
- Edoh D.; Antwi-Bosaiko C.; Amuzu D. Afr. Health. Sci 2006, 6, 51–54. [DOI] [PMC free article] [PubMed] [Google Scholar]
- Hardison R. C.; Chui D. H. K.; Giardine B.; Riemer C.; Patrinos G. P.; Anagnou N.; Miller W.; Wajcman H. Hum. Mutat. 2002, 19, 225–233. [DOI] [PubMed] [Google Scholar]
- Platt O. S.; Brambilla D. J.; Rosse W. F.; Milner P. F.; Castro O.; Steinberg M. H.; Klug P. P. N. Engl. J. Med. 1994, 330, 1639–1644. [DOI] [PubMed] [Google Scholar]
- Vichinsky E.; Hurst D.; Earles A.; Kleman K.; Lubin B. Paediatrics 1988, 81, 749–755. [PubMed] [Google Scholar]
- Charache S.; Lockard Conley C.; Waugh D. F.; Ugoretz R. J.; Spurrell J. R. J. Clin. Invest. 1967, 46, 1795–1811. [DOI] [PMC free article] [PubMed] [Google Scholar]
- Black A. J.; Gompels B. M.; Green R. L.; Huntsman R. G.; Jenkins G. C.; Condon P. I. J. Clin. Pathol. 1972, 25, 49–55. [DOI] [PMC free article] [PubMed] [Google Scholar]
- Vella F.; Lehmann H. J. Med. Genet. 1974, 11, 341–348. [DOI] [PMC free article] [PubMed] [Google Scholar]
- Mukherjee M. S.; Gangakedkar R. R.; Mohanty R. R.; Colah R. B. Indian. J. Hum. Genet. 2005, 11, 154–155. [Google Scholar]
- Streetly A.; Clarke M.; Downing M.; Farrar L.; Foo Y.; Hall K.; Kemp H.; Newbold J.; Walsh P.; Yates P.; Henthorn J. J. Med. Screen. 2008, 15, 9–13. [DOI] [PubMed] [Google Scholar]
- Streetly A.; Latinovic R.; Hall K.; Henthorn J. J. Clin. Pathol. 2009, 62, 26–30. [DOI] [PMC free article] [PubMed] [Google Scholar]
- Loeber J. J. Inherit. Metab. Dis. 2007, 30, 430–438. [DOI] [PubMed] [Google Scholar]
- Ryan K.; Bain B. J.; Worthington D.; James J.; Plews D.; Manson A.; Roper D.; Rees D. C.; de la Salle B.; Streetly A. BCSH 2009, 1–36. [DOI] [PubMed] [Google Scholar]
- Almeida A. M.; Henthorn J. S.; Davies S. C. Br. J. Haematol. 2001, 112, 32–35. [DOI] [PubMed] [Google Scholar]
- Campbell M.; Henthorn J. S.; Davis S. C. Clin. Chem. 1999, 45, 969–975. [PubMed] [Google Scholar]
- Clarke G. M.; Higgins T. F. Clin. Chem. 2000, 46, 1284–1290. [PubMed] [Google Scholar]
- Galanello R.; Oringa R. Orphanet J. Rare Dis. 2010, 5. [DOI] [PMC free article] [PubMed] [Google Scholar]
- Wild B. J.; Green B. N.; Cooper E. K.; Lalloz M. R. A.; Erten S.; Stephens A. D.; Layton D. M. Blood Cells, Mol., Dis. 2001, 27, 691–704. [DOI] [PubMed] [Google Scholar]
- Williams J. P.; Creese A. J.; Roper D. R.; Green B. N.; Cooper H. J. J. Am. Soc. Mass Spectrom. 2009, 20, 1707–1713. [DOI] [PubMed] [Google Scholar]
- Rai D. K.; Griffiths W. J.; Landin B.; Wild B. J.; Alvekius G. Anal. Chem. 2003, 75, 1978–1982. [DOI] [PubMed] [Google Scholar]
- Daniel Y. A.; Turner C.; Haynes R. M.; Hunt B. J.; Dalton R. N. Brit. J. Haematol . 2004, 130, 635–643. [DOI] [PubMed] [Google Scholar]
- Wild B. J.; Green B. N.; Stephens A. D. Blood Cells, Mol., Dis. 2004, 33, 308–317. [DOI] [PubMed] [Google Scholar]
- Daniel Y. A.; Turner C.; Haynes R. M.; Hunt B. J.; Dalton R. N. Clin. Chem. 2007, 53, 1148–1454. [DOI] [PubMed] [Google Scholar]
- Wiseman J. M.; Evans C,A.; Bowen C. L.; Kennedy J. H. Analyst 2010, 135, 720–725. [DOI] [PubMed] [Google Scholar]
- Van Berkel G. J.; Kertesz V.; Koeplinger K. A.; Vavrek M.; Kong A. N. T. J. Mass Spectrom. 2008, 43, 500–508. [DOI] [PubMed] [Google Scholar]
- Kertesz V.; Van Berkel G. J. J. Mass Spectrom. 2010, 45, 2252–2260. [DOI] [PubMed] [Google Scholar]
- Olsen J. V.; Schwartz J. C.; Griep-Raming J.; Nielsen M. L.; Damoc E.; Denisov E.; Lange O.; Remes P.; Taylor D.; Splendore M.; Wouters E. R.; Senko M.; Makarov A.; Mann M.; Horning S. Mol. Cell. Proteomics 2009, 8, 2759–2769. [DOI] [PMC free article] [PubMed] [Google Scholar]
- Newborn blood spot screening in the UK-Policies and standards, April 2005.
Associated Data
This section collects any data citations, data availability statements, or supplementary materials included in this article.


