

Abstract
The structure of the human immunodeficiency virus (HIV) and some of its components have been difficult to study in three-dimensions (3D) primarily because of their intrinsic structural variability. Recent advances in cryoelectron tomography (cryo-ET) have provided a new approach for determining the 3D structures of the intact virus, the HIV capsid, and the envelope glycoproteins located on the viral surface. A number of cryo-ET procedures related to specimen preservation, data collection, and image processing are presented in this chapter. The techniques described herein are well suited for determining the ultrastructure of bacterial and viral pathogens and their associated molecular machines in situ at nanometer resolution.
1. Introduction
Human immunodeficiency virus (HIV) is a spherical retrovirus with a diameter of ~100–150 nm. The lipid-enveloped virus first buds from the host cell in an immature form (Freed, 1998). The major structural proteins are unprocessed at this point and are referred to as the Gag polyprotein. The proteins are arranged radially in the following order from the lipid bilayer: matrix (MA), capsid (CA), SP1, nucleocapsid (NC), SP2, and p6 (Fuller et al., 1997; Wilk et al., 2001). During the budding process, the viral protease (PR) becomes active and initiates cleavage of the major protein domains of the Gag polyprotein, which results in a major structural rearrangement known as “maturation.” It is during this process that the CA domains reorganize to form the bullet-shaped core or “capsid” that encompasses the viral genome of the mature virus. Throughout the entire process of budding and maturation, the virus is enclosed by a viral envelope consisting of a lipid bilayer in which the envelope glycoprotein (Env) is embedded. HIV Env binds CD4 receptors and coreceptors on target cells, thereby initiating viral entry and infection. Native HIV Env is a trimeric complex organized as three heterodimers. The heterodimers consist of a noncovalently associated extracellular subunit gp120 and a transmembrane subunit gp41. Although several crystal structures of the gp41 and the gp120 monomer are known (Chan et al., 1997; Chen et al., 2005, 2009; Huang et al., 2005; Kwong et al., 1998; Zhou et al., 2007), the crystal structure of the HIV Env trimer has not been determined.
Electron microscopy (EM) of sectioned materials and negatively stained virions has contributed significantly to our understanding of the morphology and fine structure of HIV (Gelderblom et al., 1987). However, conventional EM methods have been unable to provide information about the 3D architecture of the virus. The advent of cryoelectron microscopy (cryo-EM) made it possible for the structure of both the immature and mature forms of the virus to be readdressed. In several landmark papers, cryo-EM studies of the immature virus revealed the radial arrangement of the Gag polyprotein domains; determined that the CA domain forms a hexagonal lattice with a distinctive spacing of ~8.0 nm; and defined the number of individual CA proteins required to compose the core of the mature virus (Briggs et al., 2004, 2006b; Fuller et al., 1997; Nermut et al., 1998). Concurrently, the mature virus was examined by cryo-EM and it was determined that virion size remains constant through the maturation process; virions can have conical or altered shaped cores; virions can have multiple cores; subunits of the CA protein of the cores form a hexagonal lattice with a ~9.6-nm spacing; and the assembly of the core is most-likely template driven (Briggs et al., 2003). The 2D cryo-EM structures of intact immature and mature HIV virions dramatically changed how researchers thought about HIV, its assembly, and maturation. Simultaneous to studies of the intact virus, research groups have sought to address questions related to the individual proteins as they rearrange during viral maturation. A significant effort has been placed on studies of the CA protein and the dramatic conformation rearrangement it undergoes during maturation. Studies of the individual proteins have been driven forward through the combined use of computational modeling, 2D cryo-EM, electron crystallography, NMR, and X-ray crystallography methods (Byeon et al., 2009; Douglas et al., 2004; Ganser et al., 1999, 2003; Ganser-Pornillos et al., 2007; Lanman et al., 2002, 2003; Li et al., 2000; Massiah et al., 1994, 1996; Pornillos et al., 2009).
Researchers still endeavored to study the 3D structure of intact HIV virions. It was with this in mind that electron tomography was used to visualize the trilobed structure of Env spikes on negatively stained HIV virions (Zhu et al., 2003) and the architecture of the virus–cell contact region from chemically fixed and stained specimens (Sougrat et al., 2007). The leap of using electron tomography to examine an external structure of the intact HIV virions was remarkable; however, studies of the internal architecture of the virus was not possible because of conventional sample preservation artifacts. Soon after the electron tomography results of HIV Env spikes were published, microscope manufactures developed streamlined, computer controlled, automated microscopes. It was due to these significant technological advances that cryoelectron tomography (cryo-ET) became a powerful technology for studying the structure of intact virions and whole cells (Grunewald et al., 2003; Medalia et al., 2002).
Through a number of recent investigations, cryo-ET has now been established as the ideal approach for studying the distinct architecture of HIV. Research groups have recently determined the 3D structure of both immature and mature virions (Benjamin et al., 2005; Briggs et al., 2006a, 2009; Wright et al., 2007). Cryo-ET examinations of mature HIV-1 virions revealed that the conical cores were unique in structure and position, but they also demonstrated certain similarities with respect to size and shape, the distance of the cone’s base from the envelope/MA layer, the range of the cone angle. It was also observed that the conical CA shape was preferred in vivo, which provided additional evidence to support the template-directed model of CA formation (Benjamin et al., 2005; Briggs et al., 2006a). Structural studies of the immature virion soon followed and some of the methods and results are described in detail in the section below (Briggs et al., 2009; Wright et al., 2007). Concurrent to the cryo-ET studies of HIV maturation, cryo-ET, combined with advanced computational methods, was used to determine the molecular architecture of native Env spikes in situ at nanometer resolution (Liu et al., 2008; Zanetti et al., 2006; Zhu et al., 2006). The studies of HIV Env spike structure, arrangement, and Env in-complex with neutralizing antibodies has provided a new driving force for the investigation and development of Env-specific therapeutics.
In this chapter, we present a number of cryo-ET procedures related to specimen preservation, data collection, and image processing that have proved to be useful for establishing a better understanding of HIV viral assembly, viral entry, and antibody neutralization at the nanometer level.
2. Cryoelectron Tomography
Cryo-ET is established as an important 3D imaging technique that serves to bridge the information gap between atomic structures and EM reconstructions that reveal the cellular or viral architectures (Baumeister et al., 1999; Lucic et al., 2005; Subramaniam, 2005). In combination with advanced computational methods, cryo-ET is the most promising approach to determine the molecular architecture of nanomachines in situ. The potential of cryo-ET lies in its ability to investigate cellular and viral components in their native state without fixation, dehydration, embedding, or sectioning artifacts. However, the poor signal-to-noise ratio (SNR) of the collected image data and the lack of effective protein labeling techniques are major impediments in cryo-ET, which confound researchers’ efforts to identify specific molecules reliably within a cell or pleomorphic virus.
Our interest has gravitated around the improvement of cryo-ET methods for determining 3D structure of large macromolecular complexes in situ. The goal is to render molecular detail at higher resolution and to automate and expedite the reconstruction process and the subsequent data analysis. The high-throughput cryo-ET processing pipeline includes data acquisition, fast tilt series alignment, 3D reconstruction, subvolume extraction, and analysis. The combination of these techniques has enabled us to determine 3D structures of macromolecular assemblies at resolutions in the range of 2–4 nm (Liu et al., 2008, 2009), which permits an interpretation of structure/ function relationships at the nanometer level.
2.1. Sample preparation: Frozen-hydrated specimen
The preparation of frozen-hydrated viral specimens is the key step for the direct visualization of virus particles by cryo-ET. The general procedure for preparing frozen-hydrated biological specimens is well described in detail (Dubochet et al., 1988; Chapter 3, Volume 481). For cryo-EM and cryo-ET, the basic steps for making frozen-hydrated specimens include: EM grid preparation, sample preparation, and plunge freezing.
2.1.1. EM grid preparation
The type of EM holey carbon grid used is an important component for the consistent, high-quality frozen-hydrated viral sample preparation. There are several grid options: lacey or holey grids, Quantifoil grids, and C-flat grids. Quantifoil and C-flat 200 mesh grids are preferred, because of the well-ordered pattern of the holes in the carbon film and the 200 mesh size allows for maximal tilting of the grid in the microscope. It is essential for the formation of a thin layer of ice-suspended virions that the grids are cleaned and processed by glow discharging prior to plunge freezing in order to remove manufacturing by-products and increase the hydrophilic nature of the grid surface.
2.1.2. Sample preparation
If the tilt series are to be aligned by the use of gold markers, there are two basic options for applying the 5 or 10 nm gold particles to the EM grid. (1) A solution of the colloidal gold particles is applied to the EM grid and allowed to air-dry. (2) A concentrated stock of the gold particles is mixed with the viral sample and the mixture is applied to the EM grid during the freezing process. The second procedure is commonly used for tomography applications.
2.1.3. Plunge freezing
A virus suspension of 4 μl is placed on a freshly glow discharged holey carbon grid. The excess solution is removed manually with a piece of filter paper and the grid is then plunged into liquid ethane. Alternatively, the sample can also be frozen using a semiautomatic or automatic plunge freezing apparatus. There are a number of apparatuses available, including the FEI Vitrobot (FEI, Hillsboro, OR) and the Gatan CP3 (Gatan, Pleasanton, CA), and the newly introduced Leica EM GP (Leica Microsystems GmbH, Wetzlar, Germany). Both FEI and Gatan systems as well as a manual plunge freezing apparatus have been used to prepare grids of frozen-hydrated viral samples.
2.2. Dose series: Determining the optimal electron dose
It has been shown that a statistically well-defined 3D reconstruction can be obtained from low-dose and noisy projection images, as long as the total dose is sufficient (McEwen et al., 1995). However, radiation damage is a fundamental problem for frozen-hydrated biological specimens (Chapter 15, Volume 481). Higher total dose and higher defocus increases contrast, but with the introduction of significant radiation damage and a reduction in resolution. Therefore, it is important for each application to find the optimal tradeoff between dose, defocus, contrast, and resolution before collecting tilt series. For this purpose, twenty high-dose (10 e/Å2) images at 0° tilt were recorded (Fig. 13.1). Comparative analysis or visual inspection of a movie of aligned images provides a good estimation of beam damage and image distortion that occurred during dose series. The tilt series selected for processing were usually exposed to a total dose of 80 e/Å2 for HIV Env studies and 120 e/Å2 for HIV maturation analysis.
Figure 13.1.
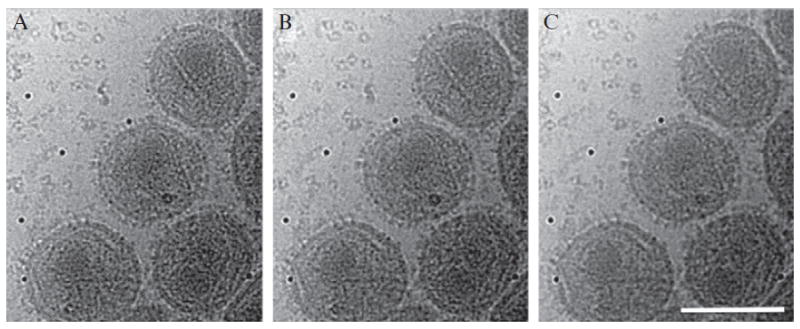
Dose series of virus: determining the optimal electron dosage. A series of high-dose (10 e/Å2) images of viruses at 0° tilt are recorded. Three of them (10e, 80e, and 160e) are shown in (A)–(C), respectively. The difference among these images is subtle. The contrast of image (C) is very good, but the fine detail of viruses (e.g., membrane bilayer) disappears. In order to conserve the fine details of virus, a total electron dose of between 80e and 120e was selected to collected tilt series. The scale bar is 100 nm.
2.3. Data acquisition: Low-dose tilt series
Because the time required for acquiring a tilt series and computing a tomographic reconstruction is significant, it is important to locate as many well-preserved virions as possible within a sample. The regions of interest that exhibit a sufficiently high virion concentration and appropriate vitreous ice thickness are typically selected at low magnification (4700×) and high defocus (300 μm) under low-dose conditions. The low-dose “search” images have reasonable contrast to readily locate the area of interest.
The use of the latest advances in automated image acquisition (Koster et al., 1992, 1997) is essential for data acquisition of frozen-hydrated biological specimens. Currently, there are several software packages available for automatic data acquisition: SerialEM (Mastronarde, 2005), UCSF Tomo (Zheng et al., 2004), TOM (Nickell et al., 2005), Xplore3D (FEI), EMMenu (Tietz), and Leginon (Suloway et al., 2009; chapter 14, Volume 483). In particular, Leginon and batch tomography from FEI Xplore3D were used successfully to collect large amounts of data (Liu et al., 2008, 2009; Suloway et al., 2009). The major benefit of batch tomography is the automatic collection of data without human intervention. In the FEI Polara electron microscope, the specimen can be maintained at liquid nitrogen temperature for ~24 h, and as many as 3000 2K × 2K CCD images can be taken during this period.
For single-axis tilt series acquisition, the angular range is usually from −70° to +70° with fixed angular increments of 1° or 2°. Batch tomography in FEI Xplore3D and Leginon starts at 0°, then tilts to −70° with the chosen increment. After reaching the highest tilt angle, the stage will return to 0° and then tilt to +70° with the same increment. Two images at 0° tilt are collected, one in the beginning and the other one on the return of the stage to 0°. A comparison of these two images provides information about radiation-induced changes to the sample or to the added gold markers, as well as any changes of other microscope parameters during the image acquisition.
Frozen-hydrated virus specimens were imaged at liquid nitrogen temperatures using a Polara field emission gun electron microscope (FEI) equipped with a 2K × 2K CCD placed at the end of either a GIF 2002 or Tridium energy filter (Gatan). The electron microscopes were operated in two slightly different conditions, but for similar purposes of enhancing image contrast (Liu et al., 2008; Wright et al., 2007). In order to determine ~2.0 nm resolution structures without taking CTF correction into consideration, about 2 μm defocus was chosen to collect low-dose single-axis tilt series for HIV Env studies. At this defocus, energy filtering with a narrow slit (20 eV) becomes critical for enhancing the image contrast.
2.4. 3D tomographic reconstruction
The generation of a 3D reconstruction from a tilt series can be subdivided into three tasks: (1) preprocessing of the raw micrographs, (2) alignment of the tilt series, and (3) the computation of the tomogram. The preprocessing removes image imperfections, such as density gradients or density outliers (“hot” or “cold” pixels of the CCD camera). The images in the tilt series must be aligned prior to the computation of a 3D map, because a common reference frame and accurate geometric parameters must be determined before a 3D map can be computed. The collected images are not in register for various reasons: none-ucentricity or mechanical instability of the stage, specimen drift, or poor tracking and recentering. The commonly used alignment methods fall into two categories, marker-based and marker-free methods (Chapter 13, Volume 482). In earlier studies (Zhu et al., 2006, 2008), a purely marker-free approach (Winkler and Taylor, 2006) was used. More recently, a hybrid approach which is based on an initial fiducial alignment with IMOD (Kremer et al., 1996) or Inspect3D (FEI) followed by a marker-free projection-matching refinement was used to analyze large numbers of tilt series (Liu et al., 2008, 2009).
The marker-free method as implemented in the protomo software package (Winkler and Taylor, 2006) usually works well if specimens are less than 200 nm in thickness (Dai et al., 2008; Liu et al., 2006; Ye et al., 2008; Zhu et al., 2006, 2008). The advantage of this method is that by using cross-correlation techniques, the alignment is based directly on the signal produced by structural features of the specimen and not on artificially introduced gold markers. The alignment principle is similar to the projection-matching approach in single particle reconstruction and thus permits iterative refinement. A preliminary map computed from already aligned images in the tilt series is reprojected and used to refine the alignment. An additional step is the reevaluation of more accurate geometric parameters. Alignment and geometry refinement are alternated and it generally takes multiple cycles of alignment and geometry refinement to process a tilt series, so that this method is computationally more expensive than the marker-based method.
For fast and reliable marker-based alignment, IMOD (Kremer et al., 1996) and Inspect3D (FEI) are useful packages presently available. The disadvantage of this approach is the relatively large size of gold markers, which are about 5 nm or larger in diameter so that their positions can only be determined with limited accuracy. Furthermore, the markers may not be immobile during the course of data acquisition, especially in frozen-hydrated specimens. Thus, the alignment based on gold markers may not guarantee the optimal alignment of specimen features.
Taking into account these considerations, a hybrid method combining the marker-based and marker-free approaches was developed for the Env project. As a first step, the tilt series were initially aligned with gold markers, and as a second step, projection matching was used to refine the alignment. The cross-correlation in the second step is carried out with a band-pass filter of which the high-pass filter component suppresses very low spatial frequencies, and the low-pass filter component excludes any signal beyond the first zero of the contrast transfer function. Computation of the final tomograms is carried out with protomo (Winkler and Taylor, 2006) which uses a weighted backprojection algorithm implementing general weighting functions (Harauz and van Heel, 1986).
2.5. Subvolume analysis
The goal of subvolume analysis is the extraction of smaller volumes from tomograms that contain structural motifs of interest and the rendering of the motifs with improved SNR and resolution for further study. This process may include a classification step if the motifs are structurally heterogeneous, in order to average only similar motifs. The subvolume analysis also needs to take into account the problem of missing information in reciprocal space, which is the cause of image artifacts in the tomograms. The missing information in a single-axis tilt series is usually referred to as the “missing wedge,” which arises due to the fact that the data is collected from a limited angular tilt range in the microscope (e.g., from −70° to +70°). The effects of the missing wedge can be eliminated in the final averaged image only if the motifs occur in various orientations in the tomograms. In other words, the orientation of the missing wedge relative to the motif structure varies correspondingly, and the gaps in reciprocal space of one motif overlap with sampled regions in other motifs, so that in the final merged image missing regions are effectively eliminated.
The processing pipeline of subvolume analysis starts with locating structural motifs in the tomograms. In general, these motifs are oriented variably within the tomogram; so that the initial search must take into account not only the position but also the orientation. The orientation search considerably increases the computational effort of automatically identifying the motifs. Algorithms are available for 3D template matching which are primarily based on cross-correlation techniques (Frangakis, 2006). Three-dimensional template matching is much more demanding than its 2D counterpart mainly because of effects of the missing wedge, the low contrast and the poor SNR of typical cryotomograms.
In the subvolume analysis of HIV Env, the motifs (the Env spikes) were manually picked using the graphical display program “tomopick” in protomo that lets the user scroll through the volume and identify spike locations at various depths in the tomogram (Winkler, 2007). Alternatively, IMOD (Kremer et al., 1996) and Chimera (Pettersen et al., 2004) can be used for this purpose. The orientation in space was derived from the measured spike positions under the assumption that the virions can be approximated by a spherical or ellipsoidal surface. The unknown coefficients of the equation for an ellipsoidal surface are calculated with the measured positions as input by a least squares fit. At each measured point, a surface normal is computed, based on the equation of the fitted ellipsoid. An approximate direction of the spike axis can then be derived from the surface normal. Only the rotation about the spike axis remains unknown, and must be determined later at the alignment stage.
In order to form an average of the raw motifs, subvolumes are extracted from the tomograms and aligned with respect to each other. The extraction or windowing is carried out either explicitly, by copying the subvolume to a new image, or implicitly, by simply recording the motif position and orientation. In the former case, the size of the data set can be reduced if the motifs are widely separated in the original tomograms. The latter case is more flexible, though, since window sizes can be changed easily at any point during processing. Subvolumes are aligned by cross-correlation and effects of the missing wedge are compensated by the use of constrained correlation (Förster et al., 2005; chapter 11, Volume 483). The rotational alignment is performed with an orientation search by maximizing the cross-correlation coefficient; the translational alignment is simultaneously derived from the position of the correlation peak maximum. If the approximate orientation of the motif is known, as is the case for the HIV Env, the grid search can be limited in accordance with the expected deviation of the orientation estimates; otherwise the full range of the three Euler angles must be scanned, which comes at a higher computational cost and is less reliable. Averaging is carried out with a merging procedure in reciprocal space that takes into account the regions with missing information in the raw motifs that are averaged.
2.6. Alignment strategies
If the examined motifs are heterogeneous, the alignment procedure outlined above cannot be directly applied. In the studies of HIV Env a contributing factor to the structural heterogeneity are orientational differences. The motif orientation relative to the tomogram determines which regions of reciprocal space fall in the sector covered by the missing wedge. The missing information affects the rendering of structural details. For instance, the membranes of spikes picked from the top or bottom of a virion almost disappear, whereas they are clearly delineated in the side views. Unless spikes are selected according to orientation, say from the top or bottom of virions, classification methods must be employed to ensure that only similarly oriented motifs are averaged.
One strategy that is commonly used in single particle analysis is multireference alignment and classification to separate various projections of a macromolecule (Penczek et al., 1994). In the case of heterogeneous 3D motifs the procedure of aligning and classifying the motifs is similar: (1) create multiple references for alignment that are representative of the heterogeneous population, (2) align each raw motif to all references and select the best according to cross-correlation peak height, (3) classify the aligned motifs, and (4) average each class separately. Class averages can then be used for further alignment and classification cycles. The number of classes that are computed are chosen according to the number of expected conformations in the heterogeneous data set. This is impossible if there is a continuum of conformations rather than discrete states, for instance, if flexible parts are present in a molecule. Since some clustering algorithms, such as hierarchical ascendant classification, require a specific number of classes as input, several sets of class averages were computed, usually 4, 10, and 20 classes for the Env spike data, which were subsequently compared visually to identify significant structural differences.
The second strategy called “alignment by classification” was developed recently (Winkler et al., 2009) to minimize possible reference bias problem, that is, the choice of the references may influence the outcome of the alignment: (1) classify all motifs, (2) compute class averages, (3) align all class averages with respect to each other, and (4) apply the alignment transformations of each class to the respective class members. This procedure is carried out repeatedly. No bias is introduced since no arbitrary reference selection takes place. Also, the alignment is carried out with class averages that have a higher SNR so that it is more robust than a multireference alignment of raw motifs. The number of classes computed in this procedure should be chosen as high as possible, because the goal is to capture as many different spatial orientations as possible in addition to the conformational differences. There is a tradeoff to consider, however, between a large number of classes versus the number of members per class. The number of averaged class members directly determines the improvement of the SNR, and the optimal choice depends on the total number of motifs in the entire data set. After completion of the alignment procedure, the same criteria as for multireference alignment apply for the final classification.
The initial alignment of the Env spikes warrants a further discussion. As mentioned above, only two of the three Euler angles can be determined with the described fitting method in the beginning, namely those that indicate the direction of the spike axis. In order to determine the third one, the rotation about the spike axis, the directional angles are first refined by an alignment to a global average, that was rotationally averaged about the spike axis, so that only two angles need to be scanned. A classification is then carried out and the class averages are aligned with respect to each other rotationally about the spike axis. This will identify motifs with structural differences and unify similar motifs that differ only in orientation, rotationally. The procedure resembles the second strategy, with the exception that one or two angles are restricted in the alignment.
A further problem is the effect of the missing wedge at the classification stage that tends to group subvolumes according to the orientation of the missing wedge rather than structural differences (Walz et al., 1997). One way to overcome this problem is the use of constrained cross-correlation as a similarity measure for the classification (Förster et al., 2008). A similar approach based on the signal overlap of a pair of subvolumes in reciprocal space is described by Bartesaghi et al. (2008). This method uses a variant of the multireference alignment method described above which includes refinement steps in the formation of class averages. There is evidence that classification without missing wedge compensation does not necessarily lead to an orientation based grouping of the motifs. It has been shown that a judicious choice of the classification mask can essentially eliminate the effects of the missing wedge (Winkler et al., 2009). This was verified by plotting the directions of the tilt axis for each class member, and inspecting the resulting distribution pattern visually. If the missing wedge were the driving factor in the classification, it would result in a particular direction within a class being preferred.
3. 3D Visualization of Intact HIV Virion
3.1. Cryoelectron tomography of HIV virions
A number of approaches have been used for the production and purification of concentrated samples of noninfectious HIV for cryo-ET analysis. For studies of viral maturation, all concentrated HIV preparations were kindly provided by Dr Wesley I. Sundquist’s laboratory located at the University of Utah, Salt Lake City, UT. For studies of HIV Env, concentrated virus samples (HIVBaL; from AIDS Vaccine Program, SAIC-Frederick, National Cancer Institute) were purified by sucrose gradient centrifugation and inactivated by treatment with Aldrithiol-2 (AT-2). The use of AT-2 inactivates viral infectivity through covalent modification of internal viral proteins while retaining the functional and structural integrity of HIV Env (Arthur et al., 1998).
3.2. Molecular structure of the gag shells
Tilt series images of immature HIV-1 virions were binned twofold and tomographic reconstructions were generated by weighted backprojection using the IMOD package (Kremer et al., 1996). Individual immature virions were selected and cropped out of the completed tomograms using IMOD tools and were subsequently denoised by nonlinear anisotropic diffusion as implemented in BSOFT (Heymann, 2001).
In order to examine and analyze the structure of the Gag shells within the immature HIV virions, the Amira software package (Visage Imaging, Inc.) was used to generate radial density profiles. The profiles were produced by sampling spherical shells of the virions and plotting the density per unit area as a function of radius. Surface projections were created to better represent the surface area covered by each of the Gag proteins over each spherical shell. The surface projections were created by first generating a sphere to represent each Gag shell. Second, the electron densities observed in each shell were sampled along vectors normal to a triangle mesh surface imposed onto each sphere. Then, the summed densities of the vectors were each assigned vertex points on the surface of each shell. To determine the percentage of the surface area within the CA NTD shell covered by ordered and disordered lattice, the surface area of the sphere was calculated with the Amira surface area module. Boundaries around disordered regions (or patches) were drawn manually and the surface area calculated.
To locate the unit cells, the points on the projected surfaces with the least density, that is, regions without protein, within a specified radius were selected. Those points were then labeled with the standard deviation of the distance to their six nearest neighbors, as a measure of the local degree of order in the hexagonal lattice. Amira extension modules created within the Jensen lab executed the preceding functions. For unit cell averaging, the set of extrema on the projected surface layers having the least variation in the distance to their neighbors was selected. For each of the selected points, a local coordinate system was established comprising the normal vector to the surface (the Z axis), the vector from the point to its nearest neighbor (the X axis), and their cross-product (the Y axis). The entire volume containing the virion was then rotated into alignment with the global axes and translated so as to superimpose all of the selected surface extrema. Density renderings of the CA and SP1 domains and atomic model fitting were performed with the UCSF Chimera (Pettersen et al., 2004).
While in 2D projection, we observed the radial spoke arrangement of Gag, in 3D only the CA and SP1 domains of Gag contained patches of hexagonal order, which were resolved in the tomographic reconstructions (Fig. 13.2). The most significant finding was the arrangement of the double-layered hexagonal lattice formed from the CA and SP1 domains. Upon further analysis, we proposed a model in which individual CA hexamers are stabilized by a bundle of six SP1 helices (Fig. 13.3). At the resolution of our data, we could not determine which portions of the associated CA and NC domains were involved in the formation of the helices. However, this structural discovery suggests why the SP1 spacer is essential for assembly of the Gag lattice and how cleavage between SP1 and CA acts as one of the structural switches controlling maturation. The structural interpretation was supported by evidence demonstrating that the Gag SP1 region is critical for viral assembly (Accola et al., 1998; Gay et al., 1998; Li et al., 2003; Liang et al., 2002) and functions as a maturation “switch” (Accola et al., 1998; Gross et al., 2000). The junction between SP1 and CA of the immature Gag lattice has also become a target for the development of retroviral maturation inhibitors. One group of compounds, the betulinic acid derivatives, has been demonstrated to be successful in blocking the cleavage of the CA-SP1 connection (Li et al., 2003; Zhou et al., 2005). One derivative, PA-457 or Bevirimat, has recently entered Phase 2 clinical trials in order to assess its efficacy for suppression of the virus.
Figure 13.2.
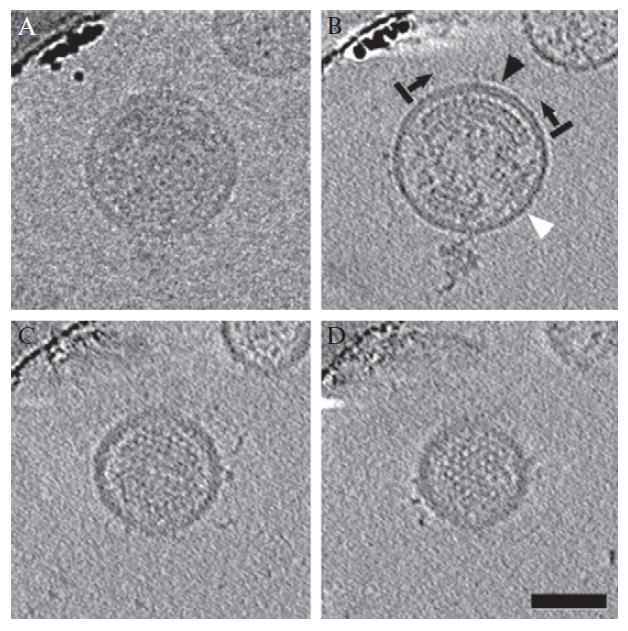
Raw image and slices through the 3D reconstruction of an HIV-1 virion. (A) The central image from a tilt series of an immature HIV-1 virion. (B–D) 5.6 nm slices through the 3D reconstruction, displaying the order of the Gag lattice. In (B), large gaps are present in the Gag lattice below the lipid bilayer (black arrows and bars mark one ordered region of the Gag lattice). In regions above visibly ordered Gag, the membrane-MA layer appears bilaminar (black arrowhead). In regions where there is no visibly ordered Gag, it appears unilaminar (white arrowhead). Scale bar 50 nm (from Wright et al., 2007, with permission).
Figure 13.3.
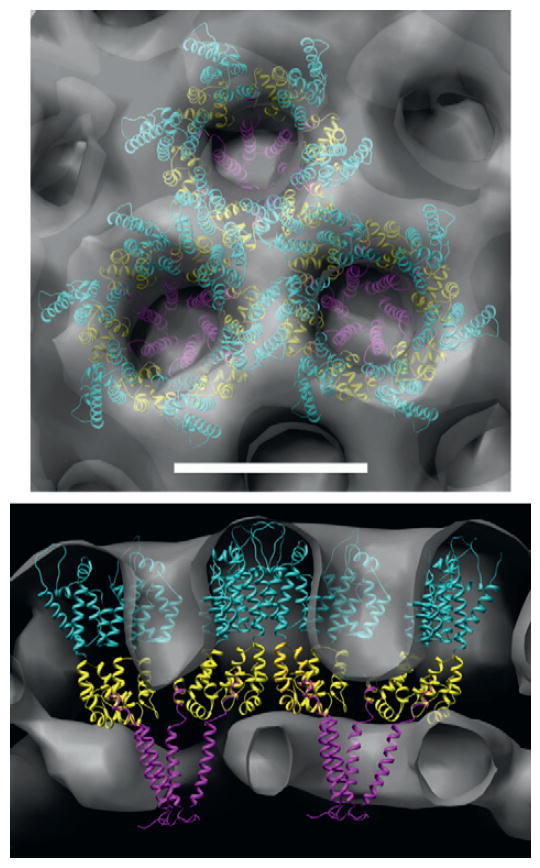
A model of the arrangement of Gag domains within the immature lattice. Top and side views (top and bottom, respectively) of the averaged Gag lattice (gray surface) with atomic models of CA NTD (cyan), CA CTD (yellow), and SP1 (magenta) fit into the density. Note that this is one interpretation of the density in terms of gross molecular architecture. Scale bar 8 nm (from Wright et al., 2007, with permission). (For interpretation of the references to color in this figure legend, the reader is referred to the Web version of this chapter.)
3.3. Molecular architecture of HIV Env
Typically, for each tilt series, a 1900 × 1900 × 500 reconstruction (~7 GB) was generated by weighted backprojection as implemented in protomo (Winkler and Taylor, 2006). After 4 × 4 × 4 binning, contrast inversion and low-pass filtering, the tomograms were examined carefully by IMOD and the virions with visible spikes were identified and extracted from the original tomograms, based on the coordinates of their centers. Each extracted 320 × 320 × 320 volume contains one individual virion with an original sampling size of 4.1 Å. The same virion was also stored in an 80 × 80 × 80 volume after 4 × 4 × 4 binning as described above.
The significantly enhanced contrast of the binned maps is the key for visualizing the intact virions and picking Env spikes (Fig. 13.4). Surface spikes on each virion were identified by visual inspection, using “tomopick” in protomo (Winkler, 2007) or UCSF Chimera (Pettersen et al., 2004). In total, 4741 spikes were selected from 382 HIV virions, 4323 spikes from 306 HIV virions complexed with b12-fab, 4849 spikes from 292 HIV virions complexed with full-length b12 and 4900 spikes from 503 HIV virions complexed with CD4 and 17b-Fab (Liu et al., 2008).
Figure 13.4.
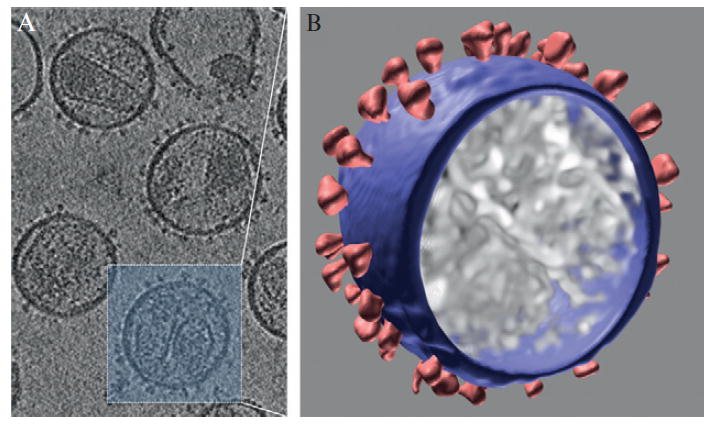
The 4 × 4 × 4 binned map of a tomographic reconstruction reveals significant contrast for 3D visualization of intact virion (B) and identification of Env spikes. The square size in (A) is 120 × 120 nm.
To speed up the image analysis, 2 × 2 × 2 binned subvolumes of the spikes were generated for the initial rounds of alignment and classification. Binning also increases the SNR, and thus results in a more reliable initial alignment and classification. This has proven to be critical for tomographic subvolume analysis, especially if large amounts of low contrast data need to be processed. As a first step, a global average of all the extracted volumes (~4000) is formed and if the positions and orientations were determined correctly, the average should reveal the membrane and the mushroom shaped spike (Fig. 13.5A). Since only two of the three Euler angles were determined, the spikes are not yet in register axially, thus the mushroom shaped appearance. A translational alignment was carried out based on the center of mass of the spike density, and an ellipsoidal mask (left panels in Fig. 13.5A) that included the spike volume was applied. Initial classification within a mask (defined in right panels of Fig. 13.5A) clearly showed the inherent threefold symmetry in the spike structure (Fig. 13.5B–E). The further alignment, multivariate statistical analysis and classification were performed as described by (Winkler, 2007) and later confirmed with an alternative approach (Bartesaghi et al., 2008). Once the structures were convincingly ascertained, threefold symmetry was imposed for subsequent rounds of refinement. Fourier shell correlation (FSC) was used to estimate the resolution of the final structures.
Figure 13.5.
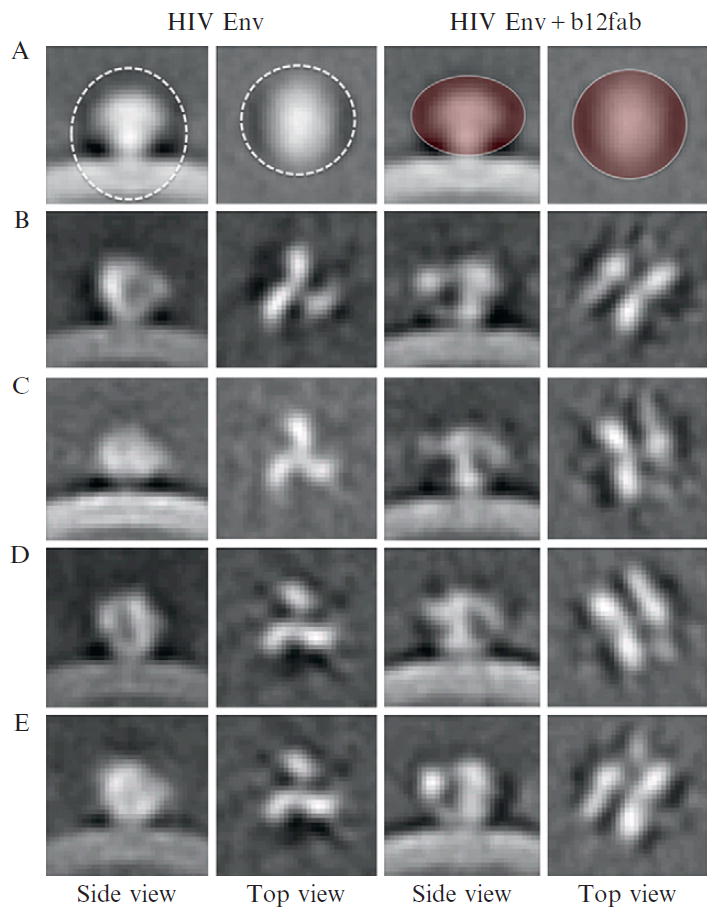
Initial classification of HIV Env spikes. Global average shows the membrane and mushroom shaped spike (A). Two different masks were used for 3D alignment (left) and 3D classification (right), respectively. Four class averages from initial classification were generated from HIV Env spikes without (left) and with b12 fab (right). The square size is 30 × 30 nm.
The molecular architecture of the HIV Env trimer is shown in Fig. 13.6D. There are several atomic models of monomeric gp120 available in the PDB, and three of them are displayed within their 2.0 nm resolution envelopes which were calculated by “pdb2mrc” in EMAN (Ludtke et al., 1999). At 2.0 nm resolution, CD4 binding and b12 binding conformations of gp120 are very different from the ligand free conformation of gp120 from SIV. Although visual comparison of these maps suggests that two models (CD4 binding and b12 binding conformations) match the corresponding densities in the HIV Env map better, the resolution is insufficient for a quantitative comparison.
Figure 13.6.
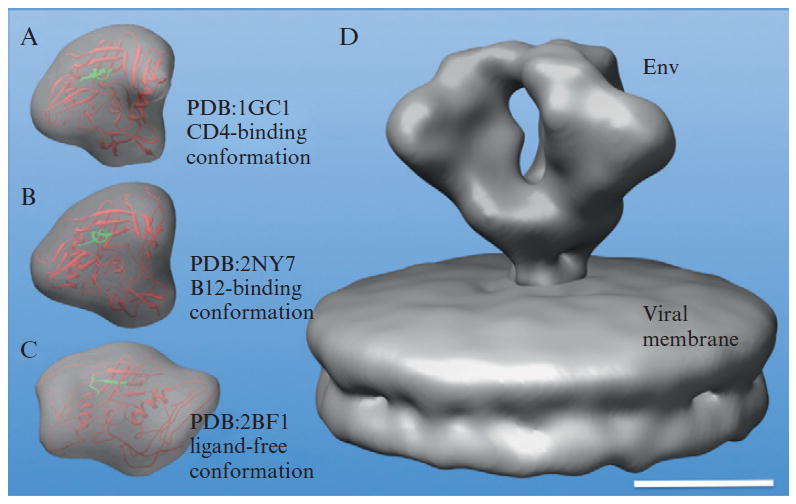
3D density map of HIV Env at 2.0 nm resolution (Liu et al., 2008). Comparison of EM map (D) with simulated maps calculated from three gp120 monomer crystal structures: CD4-binding conformation (A), b12-binding conformation (B), and ligand free conformation (C) indicates that the molecular docking remains challenging at 2.0 nm resolution. The scale bar is 5 nm.
3.4. Molecular details of neutralizing antibody b12-Env complex
b12 is a well known broadly cross-reactive, neutralizing antibody (Burton et al., 1994). A recent crystal structure of monomeric gp120 core complexed with Fab fragments from b12 not only reveals the conformationally invariant surface for initial CD4 attachment but also provides atomic-level detail of the b12 epitope (Zhou et al., 2007). Therefore, antibody b12 can also be utilized to map the CD4 binding site on HIV Env. Both b12 and its fab were incubated with intact virions separately. Due to the limited resolution, the resulting tomographic reconstructions show little evidence of antibody binding. However, the class averages of b12 (or b12 fab) and Env complex clearly reveal extra density, compared to the native Env without any ligand (Fig. 13.5). The extra density from a refined structure (Fig. 13.7) corresponds very well with one antibody fab. A pseudo-atomic model of the HIV gp120 trimer (Liu et al., 2008) was produced by fitting the crystal structure of b12 in complex with an HIV gp120 core (Zhou et al., 2007) into EM density maps using Chimera (Pettersen et al., 2004). The unassigned densities (Fig. 13.7C) at the apex of HIV Env likely correspond to the variable loops (e.g., V1/V2), which are supported by recent V1/V2 deletion mutant studies (Hu, Liu, Taylor, and Roux, unpublished work). The unassigned densities at the bottom of gp120 represent N/C-termini, which are confirmed by a recent crystal structure (Pancera et al., 2010). This result indicates that cryo-ET is becoming a powerful and reliable technique for determining the native structures of HIV Env and its interactions with antibodies at molecular resolution. Currently, there are considerable interests in understanding the interaction between HIV Env and other well known broadly neutralizing antibodies (2G12 against gp120, 2F5, and 4E10 against gp41). It is critical to identify functionally conserved regions of the highly variable HIV Env for better understanding of their structural basis for neutralization. It will certainly enhance the development of novel antibodies capable of neutralizing diverse HIV isolates.
Figure 13.7.
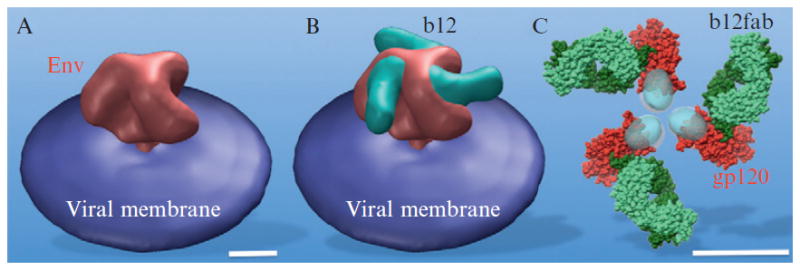
3D structure of HIV Env and b12 complex clearly reveal extra density (B), compared to that of the native Env without any ligand (A). The extra density corresponds very well with one antibody fab. A pseudo-atomic model (Liu et al., 2008) of HIV gp120 trimer as shown in (C) is derived based on the rigid body fit of crystal structure (Zhou et al., 2007) from the complex of gp120 and b12 fab. The scale bar is 5 nm.
3.5. CD4 induces major conformational change of HIV Env
It was believed that HIV Env undergoes a series of conformational changes when it interacts with receptor (CD4) and coreceptor on the host cell surface, leading to fusion of viral and cellular membranes. In the light of high resolution crystal structures, especially of the ternary complex (gp120 with both CD4 and CD4 induced antibody 17b; Kwong et al., 1998), the 3D structure of native HIV Env in a ternary complex with CD4 and 17b was determined (Liu et al., 2008) within a month from data acquisition to modeling. This could be achieved mainly because of the application of a high-throughput cryo-ET procedure. Most remarkably, the intact crystal structure of the ternary complex can be fitted into EM map as one rigid body (Fig. 13.8A). This structure suggests that the binding of Env to CD4 results in a major reorganization (Fig. 13.8B) of the Env trimer and a close contact between the virus and target cell coreceptor, thus facilitating viral entry (Fig. 13.8C).
Figure 13.8.
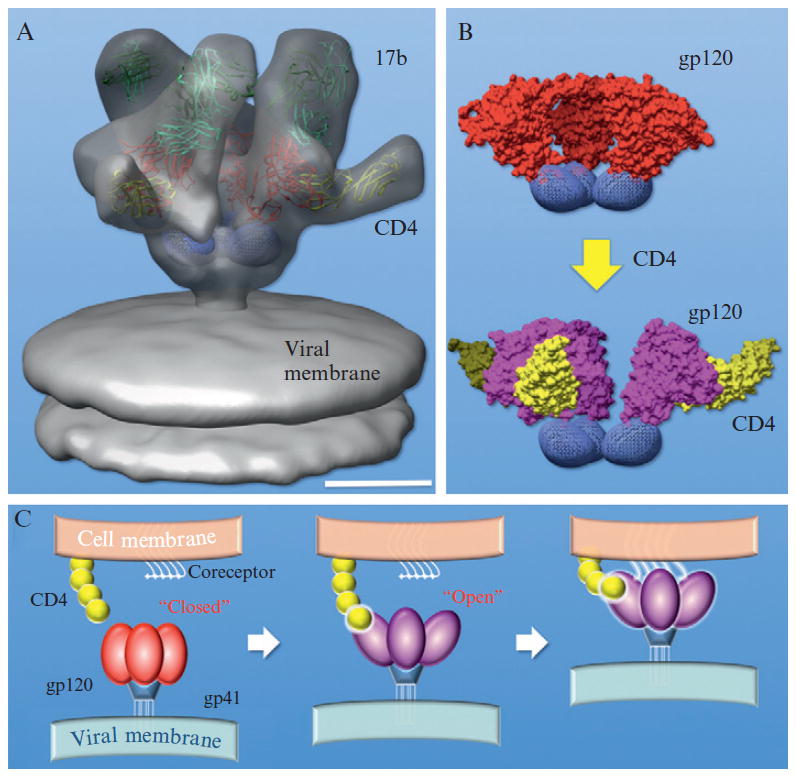
3D structure of HIV Env with CD4 and CD4 induced antibody 17b (Liu et al., 2008). The crystal structure from a ternary complex of gp120 with CD4 and 17b (Kwong et al., 1998) was fitted in EM density map as rigid body (A). gp120 was colored in magenta, CD4 in yellow, 17b fab in light green. CD4 induces huge conformational change in the HIV Env spike (B). A model of viral entry was proposed in (C). The scale bar is 5 nm.
4. Conclusions and Perspective
Cryo-ET is the method of choice to study intact heterogeneous viruses at molecular resolution (Grunewald et al., 2003; Subramaniam et al., 2007). The recent technological innovations have established cryo-ET as the most advanced technique for determining 3D structures of macromolecular complexes in situ (Beck et al., 2007; Liu et al., 2008, 2009; Murphy et al., 2006). However, poor SNR and the lack of effective protein labeling techniques remain two significant limitations of cryo-ET methodologies. We believe that further advances in cryo-ET through the development of innovative techniques for increasing throughput and resolution, adapting traditional antibody labeling, and combining genetic approaches with cryo-ET for the specific characterization of macromolecular complexes in situ will provide greater insights into the fascinating cellular processes of living organisms.
Acknowledgments
J. L. thanks Dr James Stoops for comments on and discussion of the manuscript. The authors are thankful to Dr Grant Jensen for helpful suggestions. J. L. thanks Dr Ken Roux for sharing unpublished results. The work reported here was done in the laboratories of Drs Grant Jensen, Sriram Subramanian and Ken Taylor. J. L. is supported by a Welch Foundation Grant AU-1714, NIH grant 1R01AI087946.
References
- Accola MA, Hoglund S, Gottlinger HG. A putative alpha-helical structure which overlaps the capsid-p2 boundary in the human immunodeficiency virus type 1 Gag precursor is crucial for viral particle assembly. J Virol. 1998;72:2072–2078. doi: 10.1128/jvi.72.3.2072-2078.1998. [DOI] [PMC free article] [PubMed] [Google Scholar]
- Arthur LO, Bess JW, Jr, Chertova EN, Rossio JL, Esser MT, Benveniste RE, Henderson LE, Lifson JD. Chemical inactivation of retroviral infectivity by targeting nucleocapsid protein zinc fingers: A candidate SIV vaccine. AIDS Res Hum Retroviruses. 1998;14(Suppl 3):S311–S319. [PubMed] [Google Scholar]
- Bartesaghi A, Sprechmann P, Liu J, Randall G, Sapiro G, Subramaniam S. Classification and 3D averaging with missing wedge correction in biological electron tomography. J Struct Biol. 2008;162:436–450. doi: 10.1016/j.jsb.2008.02.008. [DOI] [PMC free article] [PubMed] [Google Scholar]
- Baumeister W, Grimm R, Walz J. Electron tomography of molecules and cells. Trends Cell Biol. 1999;9:81–85. doi: 10.1016/s0962-8924(98)01423-8. [DOI] [PubMed] [Google Scholar]
- Beck M, Lucic V, Förster F, Baumeister W, Medalia O. Snapshots of nuclear pore complexes in action captured by cryo-electron tomography. Nature. 2007;449:611–615. doi: 10.1038/nature06170. [DOI] [PubMed] [Google Scholar]
- Benjamin J, Ganser-Pornillos BK, Tivol WF, Sundquist WI, Jensen GJ. Three-dimensional structure of HIV-1 virus-like particles by electron cryotomography. J Mol Biol. 2005;346:577–588. doi: 10.1016/j.jmb.2004.11.064. [DOI] [PMC free article] [PubMed] [Google Scholar]
- Briggs JA, Wilk T, Welker R, Krausslich HG, Fuller SD. Structural organization of authentic, mature HIV-1 virions and cores. EMBO J. 2003;22:1707–1715. doi: 10.1093/emboj/cdg143. [DOI] [PMC free article] [PubMed] [Google Scholar]
- Briggs JA, Simon MN, Gross I, Krausslich HG, Fuller SD, Vogt VM, Johnson MC. The stoichiometry of Gag protein in HIV-1. Nat Struct Mol Biol. 2004;11:672–675. doi: 10.1038/nsmb785. [DOI] [PubMed] [Google Scholar]
- Briggs JA, Grunewald K, Glass B, Förster F, Krausslich HG, Fuller SD. The mechanism of HIV-1 core assembly: Insights from three-dimensional reconstructions of authentic virions. Structure. 2006a;14:15–20. doi: 10.1016/j.str.2005.09.010. [DOI] [PubMed] [Google Scholar]
- Briggs JA, Johnson MC, Simon MN, Fuller SD, Vogt VM. Cryo-electron microscopy reveals conserved and divergent features of gag packing in immature particles of Rous sarcoma virus and human immunodeficiency virus. J Mol Biol. 2006b;355:157–168. doi: 10.1016/j.jmb.2005.10.025. [DOI] [PubMed] [Google Scholar]
- Briggs JA, Riches JD, Glass B, Bartonova V, Zanetti G, Krausslich HG. Structure and assembly of immature HIV. Proc Natl Acad Sci USA. 2009;106:11090–11095. doi: 10.1073/pnas.0903535106. [DOI] [PMC free article] [PubMed] [Google Scholar]
- Burton DR, Pyati J, Koduri R, Sharp SJ, Thornton GB, Parren PW, Sawyer LS, Hendry RM, Dunlop N, Nara PL, et al. Efficient neutralization of primary isolates of HIV-1 by a recombinant human monoclonal antibody. Science. 1994;266:1024–1027. doi: 10.1126/science.7973652. [DOI] [PubMed] [Google Scholar]
- Byeon IJ, Meng X, Jung J, Zhao G, Yang R, Ahn J, Shi J, Concel J, Aiken C, Zhang P, Gronenborn AM. Structural convergence between Cryo-EM and NMR reveals intersubunit interactions critical for HIV-1 capsid function. Cell. 2009;139:780–790. doi: 10.1016/j.cell.2009.10.010. [DOI] [PMC free article] [PubMed] [Google Scholar]
- Chan DC, Fass D, Berger JM, Kim PS. Core structure of gp41 from the HIV envelope glycoprotein. Cell. 1997;89:263–273. doi: 10.1016/s0092-8674(00)80205-6. [DOI] [PubMed] [Google Scholar]
- Chen B, Vogan EM, Gong H, Skehel JJ, Wiley DC, Harrison SC. Structure of an unliganded simian immunodeficiency virus gp120 core. Nature. 2005;433:834–841. doi: 10.1038/nature03327. [DOI] [PubMed] [Google Scholar]
- Chen L, Kwon YD, Zhou T, Wu X, O’Dell S, Cavacini L, Hessell AJ, Pancera M, Tang M, Xu L, Yang ZY, Zhang MY, et al. Structural basis of immune evasion at the site of CD4 attachment on HIV-1 gp120. Science. 2009;326:1123–1127. doi: 10.1126/science.1175868. [DOI] [PMC free article] [PubMed] [Google Scholar]
- Dai W, Jia Q, Bortz E, Shah S, Liu J, Atanasov I, Li X, Taylor KA, Sun R, Zhou ZH. Unique structures in a tumor herpesvirus revealed by cryo-electron tomography and microscopy. J Struct Biol. 2008;161:428–438. doi: 10.1016/j.jsb.2007.10.010. [DOI] [PMC free article] [PubMed] [Google Scholar]
- Douglas CC, Thomas D, Lanman J, Prevelige PE., Jr Investigation of N-terminal domain charged residues on the assembly and stability of HIV-1 CA. Biochemistry. 2004;43:10435–10441. doi: 10.1021/bi049359g. [DOI] [PubMed] [Google Scholar]
- Dubochet J, Adrian M, Chang JJ, Homo JC, Lepault J, McDowall AW, Schultz P. Cryo-electron microscopy of vitrified specimens. Q Rev Biophys. 1988;21:129–228. doi: 10.1017/s0033583500004297. [DOI] [PubMed] [Google Scholar]
- Förster F, Medalia O, Zauberman N, Baumeister W, Fass D. Retrovirus envelope protein complex structure in situ studied by cryo-electron tomography. Proc Natl Acad Sci USA. 2005;102:4729–4734. doi: 10.1073/pnas.0409178102. [DOI] [PMC free article] [PubMed] [Google Scholar]
- Förster F, Pruggnaller S, Seybert A, Frangakis AS. Classification of cryo-electron sub-tomograms using constrained correlation. J Struct Biol. 2008;161:276–286. doi: 10.1016/j.jsb.2007.07.006. [DOI] [PubMed] [Google Scholar]
- Frangakis AS, Rath BK. Motif search in electron tomography. In: Frank J, editor. Electron Tomography: Methods for Three-Dimensional Visualization of Structures in the Cell. Springer; New York, London: 2006. [Google Scholar]
- Freed EO. HIV-1 gag proteins: Diverse functions in the virus life cycle. Virology. 1998;251:1–15. doi: 10.1006/viro.1998.9398. [DOI] [PubMed] [Google Scholar]
- Fuller SD, Wilk T, Gowen BE, Krausslich HG, Vogt VM. Cryo-electron microscopy reveals ordered domains in the immature HIV-1 particle. Curr Biol. 1997;7:729–738. doi: 10.1016/s0960-9822(06)00331-9. [DOI] [PubMed] [Google Scholar]
- Ganser BK, Li S, Klishko VY, Finch JT, Sundquist WI. Assembly and analysis of conical models for the HIV-1 core. Science. 1999;283:80–83. doi: 10.1126/science.283.5398.80. [DOI] [PubMed] [Google Scholar]
- Ganser BK, Cheng A, Sundquist WI, Yeager M. Three-dimensional structure of the M-MuLV CA protein on a lipid monolayer: A general model for retroviral capsid assembly. EMBO J. 2003;22:2886–2892. doi: 10.1093/emboj/cdg276. [DOI] [PMC free article] [PubMed] [Google Scholar]
- Ganser-Pornillos BK, Cheng A, Yeager M. Structure of full-length HIV-1 CA: A model for the mature capsid lattice. Cell. 2007;131:70–79. doi: 10.1016/j.cell.2007.08.018. [DOI] [PubMed] [Google Scholar]
- Gay B, Tournier J, Chazal N, Carriere C, Boulanger P. Morphopoietic determinants of HIV-1 Gag particles assembled in baculovirus-infected cells. Virology. 1998;247:160–169. doi: 10.1006/viro.1998.9237. [DOI] [PubMed] [Google Scholar]
- Gelderblom HR, Hausmann EH, Ozel M, Pauli G, Koch MA. Fine structure of human immunodeficiency virus (HIV) and immunolocalization of structural proteins. Virology. 1987;156:171–176. doi: 10.1016/0042-6822(87)90449-1. [DOI] [PubMed] [Google Scholar]
- Gross I, Hohenberg H, Wilk T, Wiegers K, Grattinger M, Muller B, Fuller S, Krausslich HG. A conformational switch controlling HIV-1 morphogenesis. EMBO J. 2000;19:103–113. doi: 10.1093/emboj/19.1.103. [DOI] [PMC free article] [PubMed] [Google Scholar]
- Grunewald K, Desai P, Winkler DC, Heymann JB, Belnap DM, Baumeister W, Steven AC. Three-dimensional structure of herpes simplex virus from cryo-electron tomography. Science. 2003;302:1396–1398. doi: 10.1126/science.1090284. [DOI] [PubMed] [Google Scholar]
- Harauz G, van Heel M. Exact filters for general geometry three dimensional reconstruction. Optik. 1986;73:11. [Google Scholar]
- Heymann JB. Bsoft: Image and molecular processing in electron microscopy. J Struct Biol. 2001;133:156–169. doi: 10.1006/jsbi.2001.4339. [DOI] [PubMed] [Google Scholar]
- Huang CC, Tang M, Zhang MY, Majeed S, Montabana E, Stanfield RL, Dimitrov DS, Korber B, Sodroski J, Wilson IA, Wyatt R, Kwong PD. Structure of a V3-containing HIV-1 gp120 core. Science. 2005;310:1025–1028. doi: 10.1126/science.1118398. [DOI] [PMC free article] [PubMed] [Google Scholar]
- Koster AJ, Chen H, Sedat JW, Agard DA. Automated microscopy for electron tomography. Ultramicroscopy. 1992;46:207–227. doi: 10.1016/0304-3991(92)90016-d. [DOI] [PubMed] [Google Scholar]
- Koster AJ, Grimm R, Typke D, Hegerl R, Stoschek A, Walz J, Baumeister W. Perspectives of molecular and cellular electron tomography. J Struct Biol. 1997;120:276–308. doi: 10.1006/jsbi.1997.3933. [DOI] [PubMed] [Google Scholar]
- Kremer JR, Mastronarde DN, McIntosh JR. Computer visualization of three-dimensional image data using IMOD. J Struct Biol. 1996;116:71–76. doi: 10.1006/jsbi.1996.0013. [DOI] [PubMed] [Google Scholar]
- Kwong PD, Wyatt R, Robinson J, Sweet RW, Sodroski J, Hendrickson WA. Structure of an HIV gp120 envelope glycoprotein in complex with the CD4 receptor and a neutralizing human antibody. Nature. 1998;393:648–659. doi: 10.1038/31405. [DOI] [PMC free article] [PubMed] [Google Scholar]
- Lanman J, Sexton J, Sakalian M, Prevelige PE., Jr Kinetic analysis of the role of intersubunit interactions in human immunodeficiency virus type 1 capsid protein assembly in vitro. J Virol. 2002;76:6900–6908. doi: 10.1128/JVI.76.14.6900-6908.2002. [DOI] [PMC free article] [PubMed] [Google Scholar]
- Lanman J, Lam TT, Barnes S, Sakalian M, Emmett MR, Marshall AG, Prevelige PE., Jr Identification of novel interactions in HIV-1 capsid protein assembly by high-resolution mass spectrometry. J Mol Biol. 2003;325:759–772. doi: 10.1016/s0022-2836(02)01245-7. [DOI] [PubMed] [Google Scholar]
- Li S, Hill CP, Sundquist WI, Finch JT. Image reconstructions of helical assemblies of the HIV-1 CA protein. Nature. 2000;407:409–413. doi: 10.1038/35030177. [DOI] [PubMed] [Google Scholar]
- Li F, Goila-Gaur R, Salzwedel K, Kilgore NR, Reddick M, Matallana C, Castillo A, Zoumplis D, Martin DE, Orenstein JM, Allaway GP, Freed EO, et al. PA-457: A potent HIV inhibitor that disrupts core condensation by targeting a late step in Gag processing. Proc Natl Acad Sci USA. 2003;100:13555–13560. doi: 10.1073/pnas.2234683100. [DOI] [PMC free article] [PubMed] [Google Scholar]
- Liang C, Hu J, Russell RS, Roldan A, Kleiman L, Wainberg MA. Characterization of a putative alpha-helix across the capsid-SP1 boundary that is critical for the multimerization of human immunodeficiency virus type 1 gag. J Virol. 2002;76:11729–11737. doi: 10.1128/JVI.76.22.11729-11737.2002. [DOI] [PMC free article] [PubMed] [Google Scholar]
- Liu J, Taylor DW, Krementsova EB, Trybus KM, Taylor KA. Three-dimensional structure of the myosin V inhibited state by cryoelectron tomography. Nature. 2006;442:208–211. doi: 10.1038/nature04719. [DOI] [PubMed] [Google Scholar]
- Liu J, Bartesaghi A, Borgnia MJ, Sapiro G, Subramaniam S. Molecular architecture of native HIV-1 gp120 trimers. Nature. 2008;455:109–113. doi: 10.1038/nature07159. [DOI] [PMC free article] [PubMed] [Google Scholar]
- Liu J, Lin T, Botkin DJ, McCrum E, Winkler H, Norris SJ. Intact flagellar motor of Borrelia burgdorferi revealed by cryo-electron tomography: Evidence for stator ring curvature and rotor/C-ring assembly flexion. J Bacteriol. 2009;191:5026–5036. doi: 10.1128/JB.00340-09. [DOI] [PMC free article] [PubMed] [Google Scholar]
- Lucic V, Förster F, Baumeister W. Structural studies by electron tomography: From cells to molecules. Annu Rev Biochem. 2005;74:833–865. doi: 10.1146/annurev.biochem.73.011303.074112. [DOI] [PubMed] [Google Scholar]
- Ludtke SJ, Baldwin PR, Chiu W. EMAN: Semiautomated software for high-resolution single-particle reconstructions. J Struct Biol. 1999;128:82–97. doi: 10.1006/jsbi.1999.4174. [DOI] [PubMed] [Google Scholar]
- Massiah MA, Starich MR, Paschall C, Summers MF, Christensen AM, Sundquist WI. Three-dimensional structure of the human immunodeficiency virus type 1 matrix protein. J Mol Biol. 1994;244:198–223. doi: 10.1006/jmbi.1994.1719. [DOI] [PubMed] [Google Scholar]
- Massiah MA, Worthylake D, Christensen AM, Sundquist WI, Hill CP, Summers MF. Comparison of the NMR and X-ray structures of the HIV-1 matrix protein: Evidence for conformational changes during viral assembly. Protein Sci. 1996;5:2391–2398. doi: 10.1002/pro.5560051202. [DOI] [PMC free article] [PubMed] [Google Scholar]
- Mastronarde DN. Automated electron microscope tomography using robust prediction of specimen movements. J Struct Biol. 2005;152:36–51. doi: 10.1016/j.jsb.2005.07.007. [DOI] [PubMed] [Google Scholar]
- McEwen BF, Downing KH, Glaeser RM. The relevance of dose-fractionation in tomography of radiation-sensitive specimens. Ultramicroscopy. 1995;60:357–373. doi: 10.1016/0304-3991(95)00082-8. [DOI] [PubMed] [Google Scholar]
- Medalia O, Weber I, Frangakis AS, Nicastro D, Gerisch G, Baumeister W. Macromolecular architecture in eukaryotic cells visualized by cryoelectron tomography. Science. 2002;298:1209–1213. doi: 10.1126/science.1076184. [DOI] [PubMed] [Google Scholar]
- Murphy GE, Leadbetter JR, Jensen GJ. In situ structure of the complete Treponema primitia flagellar motor. Nature. 2006;442:1062–1064. doi: 10.1038/nature05015. [DOI] [PubMed] [Google Scholar]
- Nermut MV, Hockley DJ, Bron P, Thomas D, Zhang WH, Jones IM. Further evidence for hexagonal organization of HIV gag protein in prebudding assemblies and immature virus-like particles. J Struct Biol. 1998;123:143–149. doi: 10.1006/jsbi.1998.4024. [DOI] [PubMed] [Google Scholar]
- Nickell S, Förster F, Linaroudis A, Net WD, Beck F, Hegerl R, Baumeister W, Plitzko JM. TOM software toolbox: Acquisition and analysis for electron tomography. J Struct Biol. 2005;149:227–234. doi: 10.1016/j.jsb.2004.10.006. [DOI] [PubMed] [Google Scholar]
- Pancera M, Majeed S, Ban YE, Chen L, Huang CC, Kong L, Kwon YD, Stuckey J, Zhou T, Robinson JE, Schief WR, Sodroski J, et al. Structure of HIV-1 gp120 with gp41-interactive region reveals layered envelope architecture and basis of conformational mobility. Proc Natl Acad Sci USA. 2010;107:1166–1171. doi: 10.1073/pnas.0911004107. [DOI] [PMC free article] [PubMed] [Google Scholar]
- Penczek PA, Grassucci RA, Frank J. The ribosome at improved resolution: New techniques for merging and orientation refinement in 3D cryo-electron microscopy of biological particles. Ultramicroscopy. 1994;53:251–270. doi: 10.1016/0304-3991(94)90038-8. [DOI] [PubMed] [Google Scholar]
- Pettersen EF, Goddard TD, Huang CC, Couch GS, Greenblatt DM, Meng EC, Ferrin TE. UCSF Chimera—A visualization system for exploratory research and analysis. J Comput Chem. 2004;25:1605–1612. doi: 10.1002/jcc.20084. [DOI] [PubMed] [Google Scholar]
- Pornillos O, Ganser-Pornillos BK, Kelly BN, Hua Y, Whitby FG, Stout CD, Sundquist WI, Hill CP, Yeager M. X-ray structures of the hexameric building block of the HIV capsid. Cell. 2009;137:1282–1292. doi: 10.1016/j.cell.2009.04.063. [DOI] [PMC free article] [PubMed] [Google Scholar]
- Sougrat R, Bartesaghi A, Lifson JD, Bennett AE, Bess JW, Zabransky DJ, Subramaniam S. Electron tomography of the contact between T cells and SIV/HIV-1: Implications for viral entry. PLoS Pathog. 2007;3:e63. doi: 10.1371/journal.ppat.0030063. [DOI] [PMC free article] [PubMed] [Google Scholar]
- Subramaniam S. Bridging the imaging gap: Visualizing subcellular architecture with electron tomography. Curr Opin Microbiol. 2005;8:316–322. doi: 10.1016/j.mib.2005.04.012. [DOI] [PMC free article] [PubMed] [Google Scholar]
- Subramaniam S, Bartesaghi A, Liu J, Bennett AE, Sougrat R. Electron tomography of viruses. Curr Opin Struct Biol. 2007;17:596–602. doi: 10.1016/j.sbi.2007.09.009. [DOI] [PMC free article] [PubMed] [Google Scholar]
- Suloway C, Shi J, Cheng A, Pulokas J, Carragher B, Potter CS, Zheng SQ, Agard DA, Jensen GJ. Fully automated, sequential tilt-series acquisition with Leginon. J Struct Biol. 2009;167:11–18. doi: 10.1016/j.jsb.2009.03.019. [DOI] [PMC free article] [PubMed] [Google Scholar]
- Walz J, Typke D, Nitsch M, Koster AJ, Hegerl R, Baumeister W. Electron tomography of single ice-embedded macromolecules: Three-dimensional alignment and classification. J Struct Biol. 1997;120:387–395. doi: 10.1006/jsbi.1997.3934. [DOI] [PubMed] [Google Scholar]
- Wilk T, Gross I, Gowen BE, Rutten T, de Haas F, Welker R, Krausslich HG, Boulanger P, Fuller SD. Organization of immature human immunodeficiency virus type 1. J Virol. 2001;75:759–771. doi: 10.1128/JVI.75.2.759-771.2001. [DOI] [PMC free article] [PubMed] [Google Scholar]
- Winkler H. 3D reconstruction and processing of volumetric data in cryo-electron tomography. J Struct Biol. 2007;157:126–137. doi: 10.1016/j.jsb.2006.07.014. [DOI] [PubMed] [Google Scholar]
- Winkler H, Taylor KA. Accurate marker-free alignment with simultaneous geometry determination and reconstruction of tilt series in electron tomography. Ultramicroscopy. 2006;106:240–254. doi: 10.1016/j.ultramic.2005.07.007. [DOI] [PubMed] [Google Scholar]
- Winkler H, Zhu P, Liu J, Ye F, Roux KH, Taylor KA. Tomographic subvolume alignment and subvolume classification applied to myosin V and SIV envelope spikes. J Struct Biol. 2009;165:64–77. doi: 10.1016/j.jsb.2008.10.004. [DOI] [PMC free article] [PubMed] [Google Scholar]
- Wright ER, Schooler JB, Ding HJ, Kieffer C, Fillmore C, Sundquist WI, Jensen GJ. Electron cryotomography of immature HIV-1 virions reveals the structure of the CA and SP1 Gag shells. EMBO J. 2007;26:2218–2226. doi: 10.1038/sj.emboj.7601664. [DOI] [PMC free article] [PubMed] [Google Scholar]
- Ye F, Liu J, Winkler H, Taylor KA. Integrin alpha IIb beta 3 in a membrane environment remains the same height after Mn2+ activation when observed by cryoelectron tomography. J Mol Biol. 2008;378:976–986. doi: 10.1016/j.jmb.2008.03.014. [DOI] [PMC free article] [PubMed] [Google Scholar]
- Zanetti G, Briggs JA, Grunewald K, Sattentau QJ, Fuller SD. Cryo-electron tomographic structure of an immunodeficiency virus envelope complex in situ. PLoS Pathog. 2006;2:e83. doi: 10.1371/journal.ppat.0020083. [DOI] [PMC free article] [PubMed] [Google Scholar]
- Zheng QS, Braunfeld MB, Sedat JW, Agard DA. An improved strategy for automated electron microscopic tomography. J Struct Biol. 2004;147:91–101. doi: 10.1016/j.jsb.2004.02.005. [DOI] [PubMed] [Google Scholar]
- Zhou J, Huang L, Hachey DL, Chen CH, Aiken C. Inhibition of HIV-1 maturation via drug association with the viral Gag protein in immature HIV-1 particles. J Biol Chem. 2005;280:42149–42155. doi: 10.1074/jbc.M508951200. [DOI] [PubMed] [Google Scholar]
- Zhou T, Xu L, Dey B, Hessell AJ, Van Ryk D, Xiang SH, Yang X, Zhang MY, Zwick MB, Arthos J, Burton DR, Dimitrov DS, et al. Structural definition of a conserved neutralization epitope on HIV-1 gp120. Nature. 2007;445:732–737. doi: 10.1038/nature05580. [DOI] [PMC free article] [PubMed] [Google Scholar]
- Zhu P, Chertova E, Bess J, Jr, Lifson JD, Arthur LO, Liu J, Taylor KA, Roux KH. Electron tomography analysis of envelope glycoprotein trimers on HIV and simian immunodeficiency virus virions. Proc Natl Acad Sci USA. 2003;100:15812–15817. doi: 10.1073/pnas.2634931100. [DOI] [PMC free article] [PubMed] [Google Scholar]
- Zhu P, Liu J, Bess J, Jr, Chertova E, Lifson JD, Grise H, Ofek GA, Taylor KA, Roux KH. Distribution and three-dimensional structure of AIDS virus envelope spikes. Nature. 2006;441:847–852. doi: 10.1038/nature04817. [DOI] [PubMed] [Google Scholar]
- Zhu P, Winkler H, Chertova E, Taylor KA, Roux KH. Cryoelectron tomography of HIV-1 envelope spikes: Further evidence for tripod-like legs. PLoS Pathog. 2008;4:e1000203. doi: 10.1371/journal.ppat.1000203. [DOI] [PMC free article] [PubMed] [Google Scholar]