

Abstract
Cyclooxygenase-2 (COX-2) knockout (KO) mice in inbred strains can have renal dysfunction with secondary hyperparathyroidism (HPTH), making direct effects of COX-2 KO on bone difficult to assess. COX-2 KO mice in an outbred CD-1 background did not have renal dysfunction but still had two-fold elevated PTH compared to wild type (WT) mice. Compared to WT mice, KO mice had increased serum markers of bone turnover, decreased femoral bone mineral density (BMD) and cortical bone thickness, but no differences in trabecular bone volume by μCT or dynamic histomorphometry. Because PTH is a potent inducer of COX-2 and prostaglandin (PG) production, we examined effects of COX-2 KO on bone responses after three weeks of intermittent PTH. Intermittent PTH increased femoral BMD and cortical bone area more in KO mice than in WT mice and increased trabecular bone volume in the distal femur in both WT and KO mice. Although not statistically significant, PTH-stimulated increases in trabecular bone tended to be greater in KO mice than in WT mice. PTH increased serum markers of bone formation and resorption more in KO than in WT mice but increased the ratio of osteoblastic surface to osteoclastic surface only in KO mice. PTH also increased femoral mineral apposition rates and bone formation rates in KO mice more than in WT mice. Acute mRNA responses to PTH of genes that might mediate some anabolic and catabolic effects of PTH tended to be greater in KO than WT mice. We conclude that (1) the basal bone phenotype in male COX-2 KO mice might reflect HPTH, COX-2 deficiency or both, and (2) increased responses to intermittent PTH in COX-2 KO mice, despite the presence of chronic HPTH, suggest that absence of COX-2 increased sensitivity to PTH. It is possible that manipulation of endogenous PGs could have important clinical implications for anabolic therapy with PTH.
Keywords: Prostaglandin, Bone Remodeling, Cyclooxygenase
Introduction
Prostaglandins (PGs) are autocrine-paracrine factors synthesized in response to many factors important in bone physiology and pathology [1]. Cyclooxygenase (COX) is a major regulator of PG production. There are two isoforms for COX, COX-1 and COX-2 [1-4]. COX-1 is constitutively expressed, while COX-2 is generally expressed at low basal levels but can be induced to high levels. Multiple agonists can induce COX-2 in osteoblasts, including parathyroid hormone (PTH), cytokines, growth factors, mechanical loading, fresh serum and PGE2 itself [1]. COX-2 is the enzyme responsible for most PG production in bone [1], and osteoblasts from COX-2 knockout (KO) mice make little PGE2 in culture despite constitutive expression of COX-1 [5-7].
In vitro, PGE2 is a potent stimulator of bone resorption in organ culture [8, 9] and of osteoclast differentiation in marrow cultures [1]. Moreover, the maximal stimulation of osteoclast formation in vitro by a number of agonists, including PTH, is dependent on their induction of COX-2 [5]. The stimulatory effect of PGE2 on osteoclast formation is generally considered to occur via upregulation of receptor-activated NFκB ligand (RANKL), which is essential for osteoclast differentiation [10], and inhibition of expression of osteoprotegerin (OPG), the decoy receptor for RANKL [11], in osteoblasts or their precursors in the mesenchymal lineage. PGE2 also stimulates osteoblast differentiation in marrow stromal cell (MSC) and primary osteoblast (POB) cultures [12-14]. PGE2 given to rats in vivo can stimulate OB differentiation in ex vivo cultured bone marrow [15]. A role for endogenous PGs in osteoblast differentiation is demonstrated by studies showing decreased differentiation in MSC and POB cultures from COX-2 KO mice and in COX-2 wild type (WT) cultures treated with nonsteroidal anti-inflammatory drugs (NSAIDs), inhibitors of COX activity [7, 16-18]. In addition, maximal stimulation of osteoblast differentiation by some factors in vitro depends on their induction of COX-2 [17, 19].
In vivo, as predicted by in vitro studies, exogenous PGE2 can increase both bone resorption and formation. In rats, systemic injection of PGE2 can stimulate formation greater than resorption, producing substantial increases in bone mass, similar to the effects of intermittent PTH [20-22]. Systemic administration of PGE2 or PGE1 in humans [23, 24] and dogs [25] can also increase cortical and cancellous bone mass. Local injection of PGE2 has been shown to have local anabolic effects in mice [26]. Endogenous PGs are necessary for normal fracture healing and COX-2 plays an important role in this effect [16, 27-31]. Endogenous PGs are also thought to mediate some of the anabolic effects of mechanical loading [32-35], but the role of COX-2 in these effects is unclear [36].
Although PGs are known to stimulate both resorption and formation, their role in skeletal metabolism is still poorly understood. This study was designed to examine effects of COX-2 deficiency on bone in mice without the renal dysfunction and increased mortality that have complicated previous studies in the inbred C57Bl/6 and 129 backgrounds [37-39]. Other problems in the C57Bl/6, 129 background include infertility in COX-2 KO females, which is due not to deficiency of gonadotrophins or ovarian hormones but to multiple failures in female reproductive processes [40]. We examined effects of COX-2 KO on basal bone phenotype and responses to intermittent PTH in mice in CD-1 background that do not have renal dysfunction. Healthy male COX-2 KO mice had hyperparathyroidism (HPTH) and increased markers of bone turnover in the basal state. COX-2 KO mice also had increased skeletal responses to intermittent PTH, resulting in an increased anabolic effect of PTH compared to WT mice. These results are consistent with our previous observation that PTH increases osteoblast differentiation in MSC cultures from COX-2 KO mice but not in cultures from WT mice [11].
Materials and Methods
Materials
Human PTH 1-34 (H-4835) was purchased from Bachem Bioscience Inc (Torrance, CA). All other chemicals were from Sigma (St. Louis, MO) unless otherwise noted.
Animals
Mice in a C57Bl/6,129 background carrying one disrupted Cox-2 allele (Cox-2+/-) were the kind gift of Scott Morham [37]. Cox-2+/- (HET) mice were backcrossed into the outbred CD-1 background more than 9 times before beginning the study. We maintain a CD-1 COX-2 HET colony, which is refreshed every 4 mo with CD-1 (COX-2 WT) mice from Jackson Laboratory (Bar Harbor, ME). The offspring of this maintenance colony are used to breed experimental mice. WT and KO mice for the basal study were bred by crossing HET mice. WT and KO mice for the intermittent PTH study were bred by crossing WT with WT mice and KO with KO mice. Mice were genotyped as described previously [5]. All animal protocols were approved by the Animal Care and Use Committee of the University of Connecticut Health Center, Farmington, CT.
Intermittent PTH Protocol
Five-mo old male COX-2 WT and KO mice in the CD-1 background were injected subcutaneously (SC) in the flank region with vehicle (PBS, 0.001 N HCl, with 0.1% bovine serum albumin) or PTH (80 μg/kg, 1-34 hPTH) daily for 22 days. Areal bone mineral density (BMD) and bone mineral content (BMC) of femurs were measured by DXA in vivo under isoflurane anesthesia at day 2 and 20. Mice were euthanized with carbon dioxide 3 h after the last PTH injection on day 22. Blood was obtained by heart puncture at time of euthanasia and allowed to clot at room temperature. Femurs and lumbar vertebrae were dissected for histomorphometry and μCT analysis, and tibiae were extracted for RNA.
Serum and Urine Measurements
Serum was removed after centrifugation of blood samples at 5000 rpm for 15 minutes, divided into aliquots and frozen at -80 °C. There was no repeated freezing and thawing of specimens before measurements. Serum calcium was measured using a kit from Eagle Diagnostics (De Soto, TX). Serum creatinine was measured using a QuantiChrom Creatinine Assay kit from BioAssay Systems (Hayward, CA). Three μl of serum was needed for the calcium assay and 30 μl for the creatinine assay. PTH was assayed on 25 μl of serum using a Mouse Intact PTH ELISA Kit from Immutopics (San Clemente, CA). The manufacturer reports an intra-assay coefficient of variation (CV) of 2.5 to 3.9% and an inter-assay CV of 7.8 to 8.9%. 1,25(OH)2D3 was assayed by Miren Gratton (Department of Medicine, McGill University Health Centre and McGill University, Montreal Canada) on 100 μl of serum by immunoextraction followed by 125I radioimmunoassay using a kit from Immunodiagnostics Systems (IDS Ltd, Boldon, Tyne and Wear, UK). The manufacturer reports an intra-assay CV of 5-8% and an inter-assay CV of 9-10%. N-terminal propeptide of type I procollagen (PINP) was assayed on 5 μl of serum using Rat/Mouse PINP EIA Kit from IDS (Fountain Hills, AZ). Tartrate-resistant acid phosphatase (TRAP) 5b was assayed on 25 μl of serum using MouseTRAP EIA Kit (IDS). Mouse osteocalcin was assayed on 5 μl of serum using MouseOsteocalcin EIA Kit (IDS). Mouse C-terminal Telopeptides was assayed on 20 μl of serum using RatLaps EIA Kit (IDS). To collect urine, mice were fasted for 4 h and placed in a container with a 96-well dish for 45 min. Urine was collected only from wells without feces and calcium and creatinine were measured with kits from BioAssay Systems, Hayward, CA.
Bone Mineral Densitometry
Areal bone mineral density (BMD) and bone mineral content (BMC) were measured using a PIXImus2 Densitometer (LUNAR, GE Medical Systems, Madison, WI). For ex vivo measurements, both femurs and lumbar vertebrae (L1-5) were dissected free of connective tissue at the time of euthanasia and stored in 70% ethanol. The average value of right and left femurs was used for each animal. In vivo measurements of femurs were done in the intermittent PTH protocol. A standard phantom module, with BMD of 0.0628 g/cm2, was used for calibration. Calibration was done at the beginning of each DXA measurement day and +/- 2% deviation of BMD results was tolerated. The least significant change (LSC) for the in vivo femur measurements was calculated on the left and right femurs of five 4-mo old mice, 5 scans of each femur. The coefficient of variation was 1.0% for BMD and 1.4% for BMC, making the LSC 2.8% for BMD and 3.9% for BMC.
MicroCT Imaging (μCT)
Cortical and trabecular morphometry within the metaphyseal region of the distal femur and centrum of the third lumbar vertebrae (L3) was quantified using conebeam micro-focus X-ray computed tomography (μCT40, Scanco Medical AG, Brüttisellen, Switzerland). Serial tomographic images were acquired at 55 kV and 145 μA, collecting 1000 projections per rotation at 300 msec integration time. Three-dimensional 16-bit grayscale images were reconstructed using standard convolution back-projection algorithms with Shepp and Logan filtering, and rendered within a 12.3 mm field of view at a discrete density of 578,704 voxels/mm3 (isometric 12 μm voxels). Segmentation of bone from marrow and soft tissue was performed in conjunction with a constrained Gaussian filter to reduce noise, applying hydroxyapatite-equivalent density thresholds of 470 and 710 mg/cm3 for the trabecular and cortical compartments, respectively. Volumetric regions of interest for trabecular analysis were defined by the endosteal borders. In the vertebral bodies, the volume of interest included the central 80% of vertebral height. The approximate regions of interest for μCT in the distal femoral metaphyses are shown in Fig. 1. volume of interest was located 1 mm from the midline of the growth plate and extended 1 mm proximally. For the intermittent PTH study, we also examined the region immediately adjacent to the growth plate. For this analysis, the cross-sectional images used for the initial analysis were transposed to create longitudinal slices similar to those on a histology slide. The proximal perimeter for the volume of interest adjacent to the growth plate was located 1 mm from the highest point of the growth plate. The different regions for μCT analysis are shown in Fig. 1A and compared with the approximate area of interest for histomorphometry.
Figure 1.
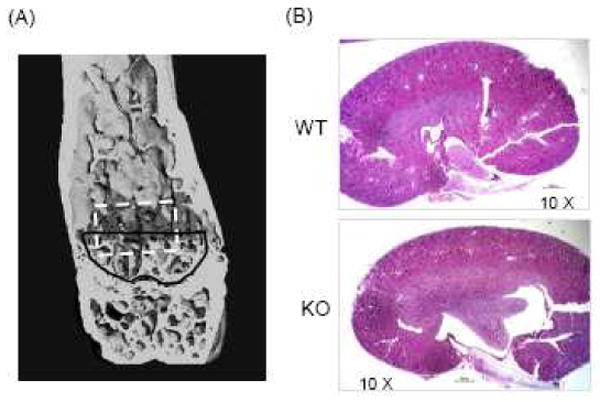
Microarchitecture of distal femur by μCT reconstruction and representative kidney sections. (A) μCT reconstruction. The black line indicates the cross-sectional location of the region of interest immediately adjacent to the growth plate and the darkened area indicates the standard region of interest for μCT analysis. The region of interest for histomorphometry is outlined in white. (B) Representative kidney sections from COX-2 WT and KO mice stained with hematoxylin and eosin.
Trabecular morphometry measurements included the bone volume fraction (BV/TV), trabecular thickness (TbTh), trabecular number (TbN), and trabecular spacing (TbSp). Cortical morphometry was quantified through a 600 μm long span extending distally from the diaphyseal mid-point between proximal and distal growth plates. Cortical morphometry measurements included average cortical area and thickness, intracortical porosity, sub-periosteal cross-sectional area, and sub-endosteal (marrow) area.
Bone Histomorphometry
Both static and dynamic measurements were made in a blinded, nonbiased manner using the OsteoMeasure computerized image analysis system (OsteoMetrics, Inc. Atlanta, GA) interfaced with an Optiphot Nikon microscope (Nikon Inc., Melville, NY). The terminology and units used are those recommended by the Histomorphometry Nomenclature Committee of the American Society for Bone and Mineral Research [41]. Measurements were made in the approximate area of the distal femur that is outlined in Fig. 1A by the dashed line.
For static histomorphometry, femurs were fixed in 4% paraformaldehyde at 4 °C, decalcified in 15% EDTA, dehydrated in progressive concentrations of ethanol, cleared in xylene and embedded in paraffin. Five-μm sections were cut and stained for TRAP to visualize osteoclasts, and counterstained with hematoxylin. Measurements included percent trabecular bone volume (BV/TV), percent osteoblast surface (ObS/BS), percent osteoclast surface (OcS/BS), and trabecular spacing and number in distal femur. In static measurements, cortical width was measured 4000 μm distal to the growth plate.
For dynamic histomorphometry, calcein (10 μg/kg) and xylenol orange (90 μg/kg) were injected intraperitoneally on days 15 and 20, respectively. Femurs were fixed in 70% ethanol, then dehydrated in increasing concentrations of ethanol, cleared in xylene, and embedded undecalcified in methyl methacrylate. Five-micron-thick longitudinal serial sections were cut on a Reichert-Jung Polycut S microtome (Reichert-Jung, Germany) with a D profile knife (Delaware Diamond Knives Corp., Wilmington, DE). Measurements included single and double labeled surfaces, mineral apposition rate (MAR), and bone formation rate (BFR/BS). MAR of 0.3 μm/day was assigned to samples that had single labels but no double labels [42].
Renal Histology
Mouse kidneys were halved and fixed in 10% neutral-buffered formalin; processed through 70%, 95% and absolute ethanol; embedded in paraffin blocks; and sectioned at 5 μm intervals by a microtome. The sections were deparaffinized through graded alcohols to distilled water and stained with hematoxylin and eosin. Representative sections for COX-2 WT and KO kidneys are shown in Fig. 1B.
RNA Extraction, Northern Analysis, and Quantitative Real Time PCR (qPCR)
Total RNA was extracted using Trizol (Invitrogen, Carlsbad, CA) according to the manufacturer's directions. Northern analysis was performed as described previously [19]. For qPCR, 3-5 μg of total RNA was DNase treated (Ambion, Inc., Austin, TX) and converted to cDNA using the High Capacity cDNA Archive Kit (Applied Biosystems, Foster City, CA). qPCR was performed in 96-well plates using Assays-on-Demand Gene Expression system (Applied Biosystems). Primers were checked for equal efficiency over a range of target gene concentrations. Glyceraldehyde 3-phosphate dehydrogenase (GAPDH) was the endogenous control. Each sample was amplified in duplicate. The PCR reaction mixture (20 μl/well including 2X TaqMan Universal PCR Master Mix, 20X Assays-on-Demand Gene Expression Assay Mix and 50 ng of cDNA) was run in Applied Biosystems ABI Prism 7300 Sequence Detection System instrument utilizing universal thermal cycling parameters. For each set of primers, the efficiency of amplification of the target and endogenous control (GAPDH) are compared over a serial dilution of template (3-5 orders of magnitude). If the absolute value of the slope of log10 template cDNA versus ΔCt is < 0.1, we use the ΔΔCt method. Otherwise, we calculated target and endogenous control from standard curves obtained by serial dilution of total RNA. For all data analysis, we compared the target gene normalized to GAPDH to a calibrator (pooled cDNA from multiple experiments) normalized to GAPDH.
Plasma cAMP Assay
Blood was obtained by heart puncture at the time of euthanasia in heparinized tubes (Becton Dickinson & Co., Franklin Lakes, NJ) and plasma separated by centrifugation. To remove particulates, ethanol (0.8 ml) was added to each plasma sample (200 μl) and samples centrifuged for 10 min. Supernatants were collected, lyophilized, resuspended in EIA buffer (Caymen Chemical, Ann Arbor, MI), and cAMP measured following the manufacturer's instructions.
Statistics
Statistical analysis was performed using SigmaStat® 3.5 (Systat Software, Inc., San Jose, CA). Comparison of two variables was done by t-test, or if data were not normally distributed, by Mann-Whitney Rank Sum t-test. For comparison of three independent variables, we used one-way Anova followed by Bonferroni t-test, or if data were not normally distributed, we used Kruskal-Wallis Anova on Ranks followed by Dunn's comparison. For analyzing data sets involving two genotypes (WT and KO) and two treatments (vehicle and PTH), where there could be interaction between genotype and treatment, we used two-way Anova with post-hoc analysis by Bonferroni pairwise comparisons. If data were not normally distributed, we transformed the data before applying the two-way Anova, using a log normal (ln) transformation, or in the few instances where ln transformation did not result in normality, we used the RANK-Sum transform, as suggested by the program. Statistical significance was p<0.05 or less.
Results
Basal COX-2 KO phenotype: Body weight and renal physiology
We studied 5- to 6-mo old male COX-2 WT (n=41) and KO (n=37) mice in the CD-1 background. Serum creatinine (Cr) was similar in COX-2 WT, HET and KO mice (Table 1). We randomly collected kidneys from 8 WT mice and 8 KO mice for gross histological examination (Fig. 1B). Both WT and KO kidneys showed patent glomeruli that were normal in number and distribution, and there was no glomerular sclerosis. There were normal proximal and distal tubules, and mesangial regions were not accentuated. There were no histological abnormalities of arterioles or interlobular arteries. Rare lymphoplasmic infiltrations were present in the interstitium and pericalyceal regions in both WT and KO mice.
TABLE 1.
Body weights and serum parameters in 5-6 month old male mice with both COX-2 alleles intact (WT), one COX-2 allele disrupted (HET) or both COX-2 alleles disrupted (KO).
| Parameter | COX-2 WT | COX-2 HET | COX-2 KO |
|---|---|---|---|
| Weight (g) | 47.6±0.86 (42) | 45.2±0.82 (39) | 43.0±0.93 (37)a |
| Cr (mg/dl) | 0.37±0.02 (43) | 0.36±0.02 (39) | 0.37±0.02 (37) |
| Ca (mg/dl) | 9.9±0.1 (41) | 9.7±0.1 (39) | 9.7±0.2 (37) |
| Phos (mg/dl) | 7.7±0.2 (20) | 8.1±0.2 (22) | 7.8±0.1 (19) |
| PTH (ng/dl) | 27.1±2.9 (41) | 32.8±3.9 (39) | 66.4±13.3 (37)b,c |
| 1,25VitD (pg/dl) | 85±1 (20) | nd | 81±7.0 (16) |
Data are means ± SEM for the number of mice in parentheses.
Significantly different from WT, p<0.01;
p<0.05.
Significantly different from HET, p<0.05.
Nd—analysis not done.
COX-2 KO mice weighed 10% less than WT mice (Table 1). HET mice also tended to weigh less than WT mice (5%, p<0.05 when compared to WT by t-test). There was no difference between WT and KO femur lengths measured ex vivo by μCT (16.0±0.1 mm for WT, n=31, and 16.0±0.1 mm for KO, n=28), suggesting that the difference in body weights was due to soft tissue differences.
Basal COX-2 KO phenotype: Hyperparathyroidism (HPTH)
Mean PTH levels in COX-2 KO mice were 2-fold elevated compared to WT or HET mice (p<0.05) (Table 1). PTH values were not normally distributed and variances in WT and KO groups were not equal. The median value for KO mice, 41.7 pg/ml, was significantly greater (p<0.05) than the median for either WT or HET mice (24.2 and 28.5 pg/ml, respectively). Even if all values in the KO group above the upper limit of the WT group (6 values ranging from 102 to 409 pg/ml) were removed from the KO group, making the population variances equal, the median value of the remaining KO group (39.0 pg/ml) was still higher than that of the WT group (p<0.05). Despite elevated PTH in KO mice, there were no differences in levels of serum calcium (Ca), phosphorus (Phos), or 1,25(OH)2D3 (1,25VitD) among the genotypes (Table 1).
Elevated PTH can increase cAMP production in bone and kidney and increase Ca reabsorption by the kidney. We measured plasma cAMP levels in a small group of 4-month old male COX-2 WT (n=8) and KO (n=7) mice. Levels of cAMP were 24.6 ± 2.1 pmol/ml in WT mice and 62.2 ± 7.6 pmol/ml in KO mice (p<0.01). We also measured urine Ca/Cr in 3-month old male WT (n=6) and KO (n=5) mice after a 4 hour fast. Urine Ca/Cr was 5.01 ± 1.03 mg/dl in WT mice and 0.41 ± 0.13 mg/dl (p<0.01) in KO mice. Although other factors could give rise to these differences, they are consistent with increased PTH levels.
Basal COX-2 KO phenotype: Increased markers of bone turnover
Because PGs produced by COX-2 can stimulate both bone resorption and formation, we expected bone resorption and/or formation in COX-2 KO mice to be decreased relative to WT mice. We measured serum tartrate resistant acid phosphastase (TRAP) 5b, a marker of bone resorption, and serum amino-terminal propeptide of type I collagen (P1NP), a marker of bone formation. Serum markers for the mice described in Table 1 are shown in Table 2 and compared with serum markers measured in COX-2 WT and KO mice that were used as controls in other experiments. TRAP 5b was significantly greater (40-140%) in KO mice compared to WT mice in 2 of the 4 experiments in which it was measured. P1NP was significantly greater (24-36%) in KO mice compared to WT mice in 3 of 4 experiments. In no case were markers lower in KO compared to WT mice. Increased bone turnover in COX-2 KO mice might reflect the effects of HPTH on bone, but there were no significant correlations between TRAP 5b or P1NP and PTH levels in the KO mice (data not shown).
TABLE 2.
Serum markers of bone turnover in 3-6 month old male COX-2 wild type (WT) and knockout (KO) mice.
| Experiment (age of mice) |
TRAP 5b (U/L) | P1NP (mg/ml) | ||
|---|---|---|---|---|
| WT | KO | WT | KO | |
| #1 (3-4 mo) | 7.5±1.7 (5) | 16.1±2.1 (5)a | 42.5±1.8 (5) | 59.0±5.9 (5)a |
| #2 (4 mo) | 5.7±1.0 (4) | 10.1±1.8 (6) | 34.4±2.4 (4) | 42.9±22 (6)a |
| #3 (5-6 mo) | 4.4±0.3 (42) | 6.2±0.8 (37)a | 47.8±2.8 (17) | 54.5±2.3 (18) |
| #4 (6 mo) | 4.4±0.4 (13) | 5.4±0.6 (12) | 54.9±7.7 (13) | 75.3±4.4 (12)a |
Mice in Expt. #1 were injected daily with PBS plus 0.1% BSA for 3 days before measurement on the fourth day. Mice in Expt. #2 were injected twice a week with PBS plus 1% ETOH for 2 weeks before measurement. Mice in Expt. #3 are the same mice described in Table 1 and received no injections. Mice in Expt. #4 were injected with PBS plus 0.1% BSA for 22 days before measurement and are the same mice used in the intermittent PTH experiment. Data are means ± SEM for the number of mice in parentheses.
Significantly different from WT, p<0.05.
Basal COX-2 KO phenotype: Decreased cortical bone mass
Compared to WT mice, COX-2 KO mice had small but statistically significant decreases in measurements reflecting cortical bone mass (Fig. 2). There was a 6% decrease in femur bone mineral density (BMD) measured by DXA (Fig. 2A) and a 5% decrease in bone mineral content (BMC) (0.040 ± 0.001 g/mm in WT vs 0.038 ± 0.001 g/mm in KO, p<0.05). There was an 11% decrease in mid-femur cortical thickness measured by μCT (Fig. 2B) and a 9% decrease in mid-femur cortical area (1.31± 0.03 mm2 in WT vs 1.18 ± 0.02 mm2 in KO, p<0.01). Decreased cortical thickness was associated with increased endosteal radius (Fig. 2C) but no increase in periosteal radius (Fig. 2D). KO mice also had increased cortical porosity (Fig. 2E). COX-2 HET mice had no statistical differences compared to WT mice.
Figure 2.

Measurement of bone mineral density (BMD) and cortical bone parameters in femurs of 5- to 6-mo old COX-2 wild type (WT), hemizygous (HET) and knockout (KO) mice. (A) BMD of femurs calculated by dual energy x-ray absorptiometry (DXA). The value for each mouse was the average of both femurs. (B) Cortical bone thickness, (C) endosteal radius and (D) periosteal radius at the midshaft of the femur measured by μCT. (E) Porosity in cortical bone at midshaft of femur measured by μCT. Bars are means ± SEM for 32 WT mice, 31 HET mice and 29 KO mice. aSignificantly different from WT, p<0.01; bp<0.05. cSignficantly different from HET, p<0.05. When only WT and KO mice were compared by t-test, the KO endosteal radius was significantly different from WT endosteal radius, p<0.05.
Analysis of the distal femur by μCT showed no differences between WT and KO mice in trabecular bone volume (BV/TV), trabecular thickness (TbTh), or trabecular spacing (TbSp) (Table 3A). In contrast, analysis by static histomorphometry suggested that BV/TV was decreased 19% in KO mice compared to WT mice (Table 3B) and associated with decreased TbTh (data not shown). The μCT and histomorphometric analyses were done in somewhat different regions (Figure 1). The area for histomorphometric analysis included less of the region bordering the cortex than the volume analyzed by μCT, which was defined by the endosteal perimeter, but more of the region immediately adjacent to the growth plate (see Methods for locations of analyses). Because the endosteal radius tended to increase in KO mice compared to WT mice (Fig. 2), it is possible that decreased trabecular bone in the central area examined by histomorphometry was compensated by increased trabecular bone resulting from conversion of cortical to trabecular bone at the endosteal margin.
TABLE 3.
Trabecular bone parameters in the distal femur of 5-6 month old male WT, HET and KO mice. Measurements include trabecular bone volume per total bone volume (BV/TV), trabecular thickness (TbTh), trabecular spacing (TbSp), osteoblast surface per bone surface (ObS/BS), osteoclast surface per bone surface (OcS/BS), mineral apposition rate (MAR) and bone formation rate per bone surface (BFR/BS).
| Parameter | COX-2 WT | COX-2 HET | COX-2 KO |
|---|---|---|---|
| (A) μCT analysis | |||
| BV/TV (%) | 18.7 ± 0.62 (32) | 18.4 ± 0.87 (31) | 17.5 ± 0.85 (29) |
| TbTh (μm) | 55.5 ± 0.78 (32) | 56.1 ± 0.80 (31) | 54.0 ± 0.94 (29) |
| TbSp (μm) | 207 ± 4.90 (32) | 219 ± 7.69 (31) | 212 ± 7.35 (29) |
| (B) Static histomorphometry analysis | |||
| BV/TV (%) | 7.55 ± 0.30 (31) | 6.82 ± 0.29 (30) | 6.12 ± 0.30 (29)a |
| ObS/BS (%) | 3.10 ± 0.41 (31) | 3.65 ± 0.52 (30) | 2.65 ± 0.26 (29) |
| OcS/BS (%) | 4.63 ± 0.67 (31) | 4.90 ± 0.64 (30) | 5.60 ± 0.88 (29) |
| (C) Dynamic histomorphometry analysis | |||
| MAR (μm/d) | 0.79 ± 0.05 (27) | 0.73 ± 0.05 (26) | 0.79 ± 0.04 (25) |
| BFR/BS (μm3/μm2/d) | 0.22 ± 0.02 (27) | 0.20 ± 0.02 (26) | 0.22 ± 0.02 (25) |
Data are means ± SEM for the number of mice in parentheses. Data are means ± SEM for the number of mice in parentheses.
Significantly different from WT, p<0.01.
Although serum markers of turnover were increased in KO mice compared to WT mice, there were no significant differences in osteoblast surface per bone surface (ObS/BS), osteoclast surface per bone surface (OcS/BS) (Table 3B), mineral apposition rate (MAR, data not shown), or bone formation rate per bone surface (BFR/BS) (Table 3C). This discrepancy suggests that the small area examined for histomorphometry in the femur did not include the regions where bone turnover was increased.
Basal COX-2 KO phenotype: COX-1, RANKL and OPG mRNA expression
Several studies have reported increased COX-1 mRNA expression in COX-2 KO mice [36, 43]. Analysis of COX-1 mRNA in tibial bone and kidney did not show any significant difference between WT and KO mice (Fig. 3A). In addition, we have not seen any increase in COX-1 mRNA in calvarial osteoblast cultures or in marrow stromal cell cultures from COX-2 KO mice (data not shown).
Figure 3.

Gene expression analyzed by quantitative RT-PCR in freshly isolated tissues from 5-to 6-mo old mice. (A) COX-1 mRNA expression in tibia (n=22) and kidney (n=7) of male COX-2 WT and KO mice. Bars are means ± SEM. (B) RANKL and OPG mRNA expression in tibiae. Bars are means ± SEM for 34-37 mice. In order to combine results from several independently analyzed sets of data, relative quantification (RQ) values for both WT and KO mice were normalized to the WT group in each data set before pooling the data for analysis. aSignificant effect of genotype, p<0.01; bp<0.05.
We measured RANKL and OPG mRNA in the tibiae (Fig. 3B). Although RANKL mRNA levels tended to be greater in KO mice compared to WT mice, OPG levels were increased 40% in KO mice compared to WT mice. As a result, the ratio of RANKL/OPG was decreased 20% in KO mice compared to WT mice. However, given that COX-2 KO mice had increased serum TRAP5b compared to WT mice (Table 2) and OcS/BS tended to be greater in KO femurs compared to WT femurs (Table 3), it would seem that the increased OPG mRNA levels in COX-2 KO tibiae did not result in widespread decreased osteoclast formation.
Intermittent PTH: Increased markers of bone turnover in COX-2 KO mice
Injection of PTH in vivo can induce a marked, transient elevation of COX-2 mRNA in bone of WT mice (Fig. 4). To determine if the absence of COX-2 expression and PG production resulted in decreased PTH-stimulation of bone resorption and formation, we examined the effects of intermittent PTH on WT and KO mice. We injected 6 mo-old male COX-2 WT and KO mice (n=9-13 per group) with1-34 hPTH (80 μg/kg) or vehicle (SC) daily for 22 days and euthanized mice 3 h after the last injection. Before injections were started, COX-2 KO mice weighed 10% less (42.7±1.2, n=23) than WT mice (47.2±1.2 g, n=26, p<0.05). There was no significant effect of treatment on weight (Table 4). Serum calcium, measured 3 h after the last PTH injection, was elevated 8-10% by PTH in both WT and KO mice (Table 4).
Figure 4.

Northern analysis of COX-2 mRNA in freshly isolated calvarial bone following PTH injection. COX-2 WT mice were subcutaneously injected with PTH (hPTH 1-34, 30 μg/kg) or vehicle bilaterally above each half-calvaria (60 μg/kg per mouse). Calvariae were harvested at the times as indicated after injection for RNA extraction and Northern analysis of COX-2 mRNA. The ratio of COX-2 mRNA to GAPDH mRNA is given below each band.
TABLE 4.
Body weights, measured before starting injections and at the end of injections, and serum calcium, measured 3 h after last PTH injection, in 6-month old male COX-2 WT and KO mice injected with PTH (80 μg/kg) or vehicle for 22 days.
| Parameter | COX-2 WT | COX-2 KO | ||
|---|---|---|---|---|
| Vehicle | PTH | Vehicle | PTH | |
| Weight at start | 47.4±1.8 | 47.0±1.7 | 43.4±1.4 | 41.9±2.0 |
| Weight at end | 46.2±1.8 | 46.4±1.6 | 42.7±1.4 | 42.6±2.0 |
| Serum calcium | 10.2±0.2 | 11.3±0.3a | 10.6±0.2 | 11.4±0.2a |
Data are means ± SEM for n=11-13 mice.
Significant effect of PTH, p<0.05.
We measured serum markers of bone formation (P1NP and osteocalcin) and bone resorption (TRAP 5b and c-terminal collagen cross-links, CTX) (Table 5). TRAP 5b and P1NP for vehicle-injected (control) mice are the same as presented in Table 2 (Expt. #4). In control mice, there was a 27-53% increase in CTX, P1NP and osteocalcin in KO mice compared to WT mice. In PTH-treated mice, there was a statistically significant interaction between genotype and PTH treatment for P1NP, osteocalcin, and CTX, and all 3 markers were about 2-fold higher in PTH-treated KO mice compared to WT mice. PTH increased PINP and serum osteocalcin 2.1-fold and 3.2-fold, respectively, in WT mice compared to 2.9-fold and 4.4-fold, respectively, in KO mice. There was a non-significant 1.4-fold increase in CTX with PTH in WT mice compared to a significant 2.1-fold increase in KO mice. PTH increased TRAP 5b similarly in WT (3.1-fold) and KO (3.8-fold) mice. Hence, all markers were significantly higher in KO mice compared to WT mice after PTH. These results suggest that PTH-stimulated resorption and formation were not decreased, but increased, in KO mice.
TABLE 5.
Serum markers of bone turnover in 6-month old male COX-2 WT and KO mice injected with PTH (80 μg/kg) or vehicle for 22 days. Measurements were made on serum obtained 3 h after the last PTH injection.
| Parameter | COX-2 WT | COX-2 KO | ||
|---|---|---|---|---|
| Vehicle | PTH | Vehicle | PTH | |
| Formation Markers | ||||
| P1NP (ng/ml) | 54.9±7.7 | 116.3±6.5a | 75.3±4.0b | 215.6±33.2a,b |
| Osteocalcin (U/L) | 27.2±3.9 | 86.0±8.0a | 38.3±4.7 | 168.5±17.70a,b |
| Resorption Markers | ||||
| CTX (ng/ml) | 15.0±1.9 | 20.6±2.9 | 22.9±4.0c | 47.1±73.2a,b |
| TRAP 5b (U/L) | 4.4±0.4 | 13.8±1.30a | 5.4±0.6 | 20.6±2.9a,b |
Data are means ± SEM for n=11-13 mice.
Significant effect of PTH, p<0.01.
Significant effect of genotype, p<0.01;
p<0.05.
Intermittent PTH: Increased anabolic effects in COX-2 KO mice
Radiographic analyses of skeletal changes were performed with in vivo DXA and ex vivo μCT. Femur BMC and BMD were measured 1 day prior to starting and 2 days before stopping PTH, and the % change calculated for each mouse. PTH increased BMC 5% and 12% in WT and KO mice, respectively, and increased BMD 6% and 11% in WT and KO mice, respectively (Fig. 5 A,B). BMD in dissected lumbar vertebrae was significantly increased by PTH only in KO mice (Fig. 5C). BMD changes reflect mostly cortical bone changes. By μCT analysis, PTH had no effect on femoral cortical bone in WT mice but increased total cortical bone area in the femoral midshaft of KO mice (28%, p<0.01) (data not shown). Although intracortical porosity was increased by PTH in KO mice (data not shown), the cortical bone area, excluding intracortical porosity, was still increased 23% in KO mice (Fig. 5D).
Figure 5.

Radiographic analysis of bone in 6-mo old male COX-2 WT and KO mice injected with PTH (80 μg/kg) or vehicle (VEH) daily for 22 days. (A) Change in bone mineral content (BMC) and (B) bone mineral density (BMD) in the femur. Measurements were performed in vivo at the beginning and end of PTH injection by DXA and the change calculated as % of initial value. The change for both femurs was calculated and the average value used for each mouse. (C) Lumbar BMD (L3) measured ex vivo. (D) Cortical bone area (minus porosity) measured at the femoral midshaft by μCT ex vivo. Bars are means ± SEM for 9-13 mice. aSignificant effect of PTH, p<0.01; bp<0.05. cSignificant effect of genotype, p<0.01; dp<0.05.
We analyzed trabecular bone in the distal femur (Fig. 6) and in lumbar spine (L3) by μCT (Table 6). In the region of the femur further away from growth plate and in the lumbar vertebra, there were no statistically significant increases in BV/TV in response to PTH in WT mice or KO mice. In contrast, in the region of trabecular bone adjacent to the growth plate in the distal femur, PTH significantly increased BV/TV 36% in WT and 60% in KO mice (Fig. 6, Table 6,). The increased anabolic effect of PTH in the region adjacent to the growth plate, which has greater trabecular bone than the region further away from the growth plate, is consistent with previous studies showing that areas of high cancellous bone have a greater anabolic response to intermittent PTH [44]. In addition, power analysis indicated that in order to see a statistically significant difference of 60% in mean BV/TV in the region further from the growth plate, with the lower mean BV/TV and the observed standard deviations, we would need a greater sample number than we had. Despite the lack of statistical significance, it is interesting to note that there was a trend for the PTH-stimulated increase in BV/TV to be greater in KO compared to WT mice at all sites—60% vs 36% in the region adjacent to growth plate, 23% vs 4 % in the region further from the growth plate, and 10% vs 2% in L3. In combination with the gene expression data discussed below, this suggests that KO mice have greater sensitivity to PTH.
Figure 6.
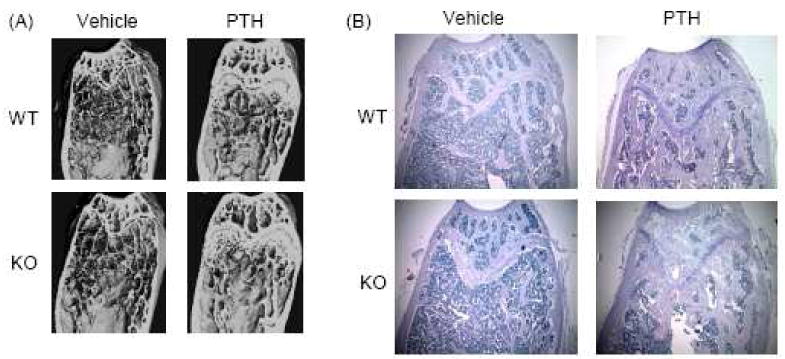
Examples of distal femur microarchitecture and histology in 6-mo old male COX-2 WT and KO mice injected with PTH (80 μg/kg) or vehicle daily for 22 days. (A) Longitudinal distal femur sections reconstructed from μCT analysis. (B) Photomicrographs (40×) of distal femur histology. Sections were stained with TRAP (red) followed by hematoxylin.
TABLE 6.
Analysis by μCT of trabecular bone parameters in the distal femur and in the centrum of the L3 vertebra of 6 month old male COX-2 WT and KO mice injected with PTH (80 μg/kg) or vehicle for 22 days. Regions of interest for trabecular analysis in the distal femur are defined in Fig. 1.
| Parameter | COX-2 WT | COX-2 KO | ||
|---|---|---|---|---|
| Vehicle | PTH | Vehicle | PTH | |
| (A) Region adjacent to growth plate in distal femur | ||||
| BV/TV (%) | 24.0 ± 2.7 (9) | 32.6 ± 3.1 (13)b | 20.9 ± 2.3 (11) | 33.4 ± 2.2 (11)a |
| TbTh (μm) | 64.6 ± 4.2 (9) | 74.5 ± 3.5 (13)b | 68.3 ± 3.3 (11) | 76.6 ± 2.5 (11) |
| TbSp (μm) | 241 ± 11 (9) | 275 ± 24 (13) | 327 ± 17 (11)c | 281 ± 19 (11) |
| (B) Region further from growth plate in distal femur | ||||
| BV/TV (%) | 13.8 ± 1.2 (13) | 14.3 ± 1.8 (13) | 13.9 ± 1.9 (11) | 17.1 ± 2.2 (11) |
| TbTh (μm) | 54.3 ± 1.8 (13) | 64.3 ± 3.0 (13)a | 57.0 ± 2.0 (11) | 69.2 ± 3.5 (11)a |
| TbSp (μm) | 263 ± 17 (13) | 313 ± 21 (13) | 281 ± 22 (11) | 298 ± 14 (11) |
| (C) Vertebra (L3) | ||||
| BV/TV (%) | 22.1 ± 1.4 (13) | 22.5 ± 2.5 (13) | 20.4 ± 1.3 (12) | 22.5 ± 2.6 (11) |
| TbTh (μm) | 53.7 ± 1.6 (13) | 63.4 ± 3.1 (13)a | 51.5 ± 1.8 (12) | 64.4 ± 4.2 (11)a |
| TbSp (μm) | 224 ± 14 (13) | 234 ± 18 (13) | 239 ± 11 (12) | 244 ± 20 (11) |
Data are means ± SEM. The numbers of mice are given in parentheses.
Significant effect of PTH, p<0.01;
p<0.05.
Significant effect of genotype, p<0.01.
TbTh was increased 12-25% by PTH in WT and KO mice in femur and spine (although the increase did not reach statistical significance in region adjacent to the growth plate). However, TbSp was not decreased by PTH in any group, except in the region adjacent to the growth plate of KO mice (although the difference did not reach statistical significance) (Table 6A). There were no significant changes in trabecular number with PTH (data not shown). It is possible that the balance of turnover favored PTH-stimulated resorption rather than formation during the first few weeks of PTH treatment and that we might have seen greater increases in trabecular bone if treatment had been continued longer.
We also analyzed changes in the femur by static and dynamic histomorphometry. PTH increased trabecular BV/TV in the distal femur 56% in WT mice and 69% in KO mice (Fig. 7A). PTH increased ObS/BS in the distal femur 4-fold in WT and 6-fold in KO mice, and the 50% greater increase in KO mice compared to WT mice was statistically significant (Fig. 7B). In contrast, PTH increased OcS/BS similarly in WT and KO mice (3.0-fold and 2.7-fold, respectively) (Fig. 7C). The PTH-stimulated ratio of ObS/OcS was 2.2-fold in KO mice compared to 1.2-fold in WT mice, and only the increase in KO mice was statistically significant (Fig. 7D). On dynamic histomorphometric analysis, PTH increased MAR and BFR/BS 33% and 47% more in the distal femur of KO mice compared to WT mice (Figure 7E,F). Both the cortical endosteal and periosteal MAR in the midshaft were greater (2-fold) in COX-2 KO femurs compared to WT femurs (Fig. 7G,H). Similar results were found for endosteal BFR/BS (data not shown), but only the effect of treatment was significant for periosteal BFR/BS (data not shown).
Figure 7.

Static and dynamic histomorphometric analyses in femurs from 6-mo old male COX-2 WT and KO mice injected with PTH (80 μg/kg) or vehicle (VEH) daily for 22 days. (A) Trabecular bone volume per total volume (BV/TV), (B) osteoblast surface per bone surface (ObS/BS), (C) osteoclast surface per bone surface (OcS/BS), (D) ratio of ObS/OcS, (E) mineral apposition rate (MAR) and (F) bone formation rate per bone surface (BFR/BS) measured in the distal femur as described in Methods. (G) Periosteal MAR and (H) endosteal MAR in the femoral midshaft. Bars are means ± SEM for 9-13 mice. aSignificant effect of PTH, p<0.01; bp<0.05. cSignificant effect of genotype, p<0.01; dp<0.05.
Overall, these data are consistent with a greater anabolic response to PTH in KO mice than in WT mice in the femur. Although only cortical bone, and not trabecular bone, was statistically significantly increased in KO mice compared to WT mice, increased osteoblast to osteoclast surface on static histomorphometry and increased MAR and BFR/BS on dynamic histomorphometry in COX-2 KO mice compared to WT mice suggest that trabecular bone might be more increased in femurs of KO mice if PTH were to be continued for a longer time.
Intermittent PTH: Differential gene expression in KO mice
We used tibiae dissected 3 h after the last PTH injection to examine mRNA expression. PTH increased mRNA for alkaline phosphatase (ALP) 5-fold in KO mice compared to 3-fold in WT mice (Fig. 8A), consistent with the greater anabolic effect of PTH in KO mice. We chose to take samples 3 h after the last PTH injection so that we could examine some early gene responses to PTH injection, such as RANKL. Based on in vitro studies, we expected the PTH stimulation of the RANKL/OPG ratio to be decreased in KO mice. However, PTH stimulated RANKL 11-fold in KO mice and 4-fold in WT mice (Fig. 8B). There was no significant effect of PTH on OPG mRNA (Fig. 8C). The RANKL/OPG ratio was increased 15-fold by PTH in KO mice compared to 8-fold (in WT mice (Fig. 8D). There was no compensatory increase in COX-1 mRNA in KO mice and no induction of COX-2 mRNA by PTH (Fig. 8E).
Figure 8.

Analysis of gene expression by real time RT-PCR in freshly isolated tibiae from 6-mo old male COX-2 WT and KO mice injected with PTH (80 μg/kg) or vehicle (VEH) daily for 22 days. Tibiae were dissected 3 h after the last PTH injection. Bars are means ± SEM for n=9-12 mice. aSignificant effect of PTH, p<0.01; bp<0.05. cSignificant effect of genotype, p<0.01.
We examined mRNA expression of several additional early response genes reported to be regulated by PTH largely via a cAMP/PKA pathway and possibly involved in the anabolic effects of PTH, including c-fos [45], receptor activity modifying protein-3 (RAMP-3) [46], CITED1 [47] and SOST [48-50]. PTH significantly increased c-fos mRNA only in KO tibiae (Fig. 9A). PTH increased RAMP-3 mRNA 12.5-fold in KO mice and 7-fold in WT mice (Fig. 9B). CITED1 is a CBP/P300 interacting protein recently reported to inhibit the cAMP-mediated anabolic effects of PTH [47]. PTH increased CITED1 mRNA 79-fold in KO and 56-fold in WT mice, suggesting that CITED1 does not play an inhibitory role in this model (Fig. 9C). Sclerostin, the product of the SOST gene, is an inhibitor of bone formation that is known to be inhibited by PTH [48-50]. PTH decreased SOST mRNA 40-50% in both WT and KO tibiae, and there was significant effect of genotype within the PTH-treated group (Fig. 9D). These data suggest a trend for cAMP/PKA regulated gene expression in response to PTH to be enhanced in the KO mice.
Figure 9.

Analysis of gene expression by real time RT-PCR in freshly isolated tibiae from 6-mo old male COX-2 WT and KO mice injected with PTH (80 μg/kg) or vehicle (VEH) daily for 22 days. Tibiae were dissected 3 h after the last PTH injection. Bars are means ± SEM for n=5-7 mice for c-fos and n=9-12 for the other genes. aSignificant effect of PTH, p<0.01; bp<0.05. cSignificant effect of genotype, p<0.05.
Other genes reported to be involved the anabolic effects of PTH include insulin-like growth factor (IGF)-1 [51] and PTH-related protein (PTHrP) [52]. PTH increased IGF-1 mRNA similarly (1.5-fold) in both WT and KO mice (Fig. 9E) and increased PTHrP mRNA (2-fold) only in WT mice (Fig. 9F). PTH receptor mRNA expression was similar in WT and KO tibiae in both vehicle- and PTH-treated mice (data not shown).
Discussion
In the outbred CD-1 background, COX-2 KO mice were healthy, and female COX-2 KO mice were fertile. We bred COX-2 KO mice for the intermittent PTH study by crossing KO mice, and, thus, there was no possibility that COX-2 expressed in mothers could compensate for absent COX-2 in fetuses, as might occur in HET mothers. Hence, it is clear that COX-2 expression is not critical for skeletal development. Nor is COX-2 expression necessary for basal bone remodeling or for PTH-stimulated bone formation. However, we cannot say that PGs do not play a role in any of these processes, because COX-1 may compensate for absent COX-2. The rescue of fertility in CD-1 mice has been attributed to compensation by increased COX-1 expression in reproductive tissues [43]. COX-1 must compensate for absent COX-2 in some tissues because double COX-1, COX-2 deficient mice die from failure of ductus arteriosus closure shortly after birth [53]. Although we did not find significantly increased COX-1 mRNA in COX-2 KO bone in vivo or in cultured COX-2 KO osteoblastic cells, compensation might occur at the level of enzyme activity rather than mRNA expression. We speculate that the COX-2 KO phenotype leads to more severe abnormalities in C57Bl/6 and 129 strains because both of these strains are reported to have a natural absence of type GIIA secretory PLA2 [54]. Absence of this PLA2 might decrease the arachidonic acid substrate availability for COX-1, thereby decreasing the ability of COX-1 to produce PGs to compensate for absent COX-2 in these backgrounds.
Several studies have reported increased PTH levels in COX-2 KO mice compared to WT mice [39, 55]. In our previous study of mice in the C57Bl/6,129 background, some COX-2 KO mice clearly had secondary HPTH associated with renal failure (high serum Cr, low serum calcium, high serum phosphate, and PTH levels greater than 2000 ng/dl), although other KO mice without evident renal dysfunction also had increased PTH levels compared to WT mice [39]. Because there was a trend (statistically non-significant) for serum Cr levels to be higher in COX-2 KO compared to WT mice and because KO mice had such high mortality (40% died between 2 and 10 months of age), it was difficult to rule out subtle renal problems as a possible cause of the HPTH in the C57Bl/6,129 background. COX-2 KO mice in the CD-1 background have normal renal function and histology, again raising the question of what is causing this HPTH in these mice. Parathyroid gland (PTG) cells express COX-2 and can secrete PGs [56-58]. It is possible that global deletion of COX-2 might affect the PTG set point, resulting in primary HPTH. However, CD-1 COX-2 KO mice were normocalcemic. Although with normocalcemia can be seen in humans with primary HPTH [59, 60], primary HPTH is usually characterized by hypercalcemia. Decreased calcium absorption from the gut or increased urinary calcium excretion could lower serum calcium, causing secondary HPTH, which might then restore serum calcium levels to normal. We could find no reports on the effects of PGs on calcium absorption in the gut, and studies examining the inhibition of PGE2 production with NSAIDs on renal calcium excretion usually report increased calcium reabsorption, suggesting that the dominant effect of endogenous PGE2 is to increase calcium excretion [61- 63]. Our COX-2 KO mice had significantly decreased urinary calcium/Cr compared to WT mice, which is consistent with both COX-2 deficiency and HPTH. Another possible cause of secondary HPTH is resistance of bone to the resorptive effects of PTH. PTH induces COX-2, and PGE2 resulting from COX-2 induction could be a potent stimulator or enhancer of bone resorption [1, 5, 64]. Although the RANKL/OPG ratio was 20% less in COX-2 KO mice compared to WT mice in the basal study, it is difficult to reconcile resistance to the resorptive effects of PTH with the increased serum TRAP 5b and CTX in the KO mice. It is possible that there are effects of COX-2 absence on the hematopoietic lineage to increase osteoclastic progenitors, which would oppose the effects of decreased RANKL/OPG ratio [65].
Despite a potential role for PGs in regulating both bone resorption and formation, COX-2 KO mice do not have a dramatic phenotype. Skeletal analyses of COX-2 KO mice in the C57Bl/6,129 and C57Bl/6,DBA backgrounds have generally shown reduced bone mass [36, 39, 55, 66] and inferior mechanical properties compared to WT mice [36, 55, 67]. The most consistent finding in the present study in CD-1 mice and in our earlier study of C57Bl/6,129 mice [39] is decreased cortical bone mass. This phenotype could be due to the actions of increased PTH on bone [68], the absence of COX-2 in bone or both, and more experimental data are needed to resolve the issue. Experiments that target Cox-2 deletion to PTG cells or to osteoblasts might help to resolve the issue of primary versus secondary HPTH and to distinguish effects of Cox-2 deletion from HPTH.
In contrast to our initial hypothesis that some effects of PTH to stimulate bone formation might be mediated via the PTH-induction of COX-2 expression and PGE2 production, the anabolic effects of intermittent PTH were greater in COX-2 KO mice than in WT mice. We also found increased PTH-stimulated osteoblastic differentiation in the absence of COX-2 expression or activity in vitro [18]. In addition, although the PTH-induction of COX-2 was expected to enhance the resorptive effects of PTH, there was no decrease in resorptive response to PTH in COX-2 KO mice. One possible explanation for both observations might be that gene responses to PTH, especially those mediated via the cAMP/PKA pathway, are increased in the KO mice. PTH induces COX-2 in osteoblasts via the cAMP-PKA pathway [69, 70] and is thought to have major effects on both bone formation and resorption via cAMP-mediated pathways [71, 72]. We observed a trend for acute responses to PTH of genes thought to be mediated largely via cAMP signaling to be greater in COX-2 KO mice compared to WT. Because male COX-2 KO mice have mild HPTH, we expected that responses to intermittent PTH and acute responses to PTH in vivo would be down regulated, not increased. We also found greater PTH-stimulated fold-induction of expression in vitro of several of cAMP-mediated genes in COX-2 KO osteoblastic cells relative to WT cells [18], suggesting that similar increased responses to PTH in vivo are unrelated to HPTH. The increased response to PTH of genes regulating both resorption and formation in the absence of COX-2 is consistent with the increased markers of both bone formation and resorption in COX-2 KO compared to WT mice after PTH.
Our data suggest that PTH-stimulated anabolic responses in vivo, as well as PTH-stimulated osteoblastic differentiation in vitro, are enhanced by absence of COX-2 and endogenous PGs. In contrast, COX-2 expression and endogenous PG production have been shown to stimulate osteogenic effects in the presence of serum and enhance osteogenic effects of BMP-2 and strontium ranelate in vitro [7, 16, 17, 73]. The induction of COX-2 may produce endogenous PGs that limit responses to agents that directly activate cAMP-activated signaling pathways, while enhancing responses to agents that act primarily via non-cAMP pathways. The possibility that manipulation of endogenous PGs might increase the anabolic effects of PTH could have important clinical applications.
Acknowledgments
We thank Miren Gratton for performing the 1,25(OH)2D3 assays on serum. This work was supported by NIH DK48361 and NIH AR47673 (CP), by NIH AR18063 (LGR), and by grants from the Canadian Institutes of Health Research (DG).
Footnotes
Publisher's Disclaimer: This is a PDF file of an unedited manuscript that has been accepted for publication. As a service to our customers we are providing this early version of the manuscript. The manuscript will undergo copyediting, typesetting, and review of the resulting proof before it is published in its final citable form. Please note that during the production process errors may be discovered which could affect the content, and all legal disclaimers that apply to the journal pertain.
References
- 1.Pilbeam CC, Choudhary S, Blackwell KA, Raisz LG. Prostaglandins and Bone Metabolism. In: Bilezikian JP, Raisz LG, Martin TJ, editors. Principles of Bone Biology. San Diego: Elsievier/Academic Press; 2008. pp. 1235–71. [Google Scholar]
- 2.Herschman HR. Regulation of prostaglandin synthase-1 and prostaglandin synthase-2. Cancer Metast Rev. 1994;13:241–56. doi: 10.1007/BF00666095. [DOI] [PubMed] [Google Scholar]
- 3.Smith WL, DeWitt DL, Garavito RM. Cyclooxygenases: structural, cellular, and molecular biology. Annu Rev Biochem. 2000;69:145–82. doi: 10.1146/annurev.biochem.69.1.145. [DOI] [PubMed] [Google Scholar]
- 4.Tanabe T, Tohnai N. Cyclooxygenase isozymes and their gene structures and expression. Prostaglandins Other Lipid Mediat. 2002;68-69:95–114. doi: 10.1016/s0090-6980(02)00024-2. [DOI] [PubMed] [Google Scholar]
- 5.Okada Y, Lorenzo JA, Freeman AM, Tomita M, Morham SG, Raisz LG, Pilbeam CC. Prostaglandin G/H synthase-2 is required for maximal formation of osteoclast-like cells in culture. J Clin Invest. 2000;105:823–32. doi: 10.1172/JCI8195. [DOI] [PMC free article] [PubMed] [Google Scholar]
- 6.Choudhary S, Wadhwa S, Raisz LG, Alander C, Pilbeam CC. Extracellular calcium is a potent inducer of cyclooxygenase-2 in murine osteoblasts through an ERK signaling pathway. J Bone Miner Res. 2003;18:1813–24. doi: 10.1359/jbmr.2003.18.10.1813. [DOI] [PubMed] [Google Scholar]
- 7.Xu Z, Choudhary S, Okada Y, Voznesensky O, Alander C, Raisz L, Pilbeam C. Cyclooxygenase-2 gene disruption promotes proliferation of murine calvarial osteoblasts in vitro. Bone. 2007;41:68–76. doi: 10.1016/j.bone.2007.03.009. [DOI] [PMC free article] [PubMed] [Google Scholar]
- 8.Klein DC, Raisz LG. Prostaglandins: stimulation of bone resorption in tissue culture. Endocrinology. 1970;86:1436–40. doi: 10.1210/endo-86-6-1436. [DOI] [PubMed] [Google Scholar]
- 9.Raisz LG, Martin TJ. Prostaglandins in bone and mineral metabolism. In: Peck WA, editor. Bone and Mineral Research, Annual 2. Amsterdam: Elsevier Science Publishers; 1983. pp. 286–310. [Google Scholar]
- 10.Tsukii K, Shima N, Mochizuki S, Yamaguchi K, Kinosaki M, Yano K, Shibata O, Udagawa N, Yasuda H, Suda T, Higashio K. Osteoclast differentiation factor mediates an essential signal for bone resorption induced by 1 alpha,25-dihydroxyvitamin D3, prostaglandin E2, or parathyroid hormone in the microenvironment of bone. Biochem Biophys Res Commun. 1998;246:337–41. doi: 10.1006/bbrc.1998.8610. [DOI] [PubMed] [Google Scholar]
- 11.Suda K, Udagawa N, Sato N, Takami M, Itoh K, Woo JT, Takahashi N, Nagai K. Suppression of osteoprotegerin expression by prostaglandin E2 is crucially involved in lipopolysaccharide-induced osteoclast formation. J Immunol. 2004;172:2504–10. doi: 10.4049/jimmunol.172.4.2504. [DOI] [PubMed] [Google Scholar]
- 12.Flanagan AM, Chambers TJ. Stimulation of bone nodule formation in vitro by prostaglandins E1 and E2. Endocrinology. 1992;130:443–8. doi: 10.1210/endo.130.1.1309342. [DOI] [PubMed] [Google Scholar]
- 13.Scutt A, Bertram P. Bone marrow cells are targets for the anabolic actions of prostaglandin E2 on bone: induction of a transition from nonadherent to adherent osteoblast precursors. J Bone Miner Res. 1995;10:474–87. doi: 10.1002/jbmr.5650100320. [DOI] [PubMed] [Google Scholar]
- 14.Kaneki H, Takasugi I, Fujieda M, Kiriu M, Mizuochi S, Ide H. Prostaglandin E2 stimulates the formation of mineralized bone nodules by a cAMP-independent mechanism in the culture of adult rat calvarial osteoblasts. J Cell Biochem. 1999;73:36–48. [PubMed] [Google Scholar]
- 15.Weinreb M, Suponitzky I, Keila S. Systemic administration of an anabolic dose of PGE2 in young rats increases the osteogenic capacity of bone marrow. Bone. 1997;20:521–6. doi: 10.1016/s8756-3282(97)00033-1. [DOI] [PubMed] [Google Scholar]
- 16.Zhang X, Schwarz EM, Young DA, Puzas JE, Rosier RN, O'Keefe RJ. Cyclooxygenase-2 regulates mesenchymal cell differentiation into the osteoblast lineage and is critically involved in bone repair. J Clin Invest. 2002;109:1405–15. doi: 10.1172/JCI15681. [DOI] [PMC free article] [PubMed] [Google Scholar]
- 17.Choudhary S, Halbout P, Alander C, Raisz L, Pilbeam C. Strontium ranelate promotes osteoblastic differentiation and mineralization of murine bone marrow stromal cells: involvement of prostaglandins. J Bone Miner Res. 2007;22:1002–10. doi: 10.1359/jbmr.070321. [DOI] [PubMed] [Google Scholar]
- 18.Choudhary S, Huang H, Raisz L, Pilbeam C. Anabolic effects of PTH in cyclooxygenase-2 knockout osteoblasts in vitro. Biochem Biophys Res Commun. 2008;372:536–41. doi: 10.1016/j.bbrc.2008.05.050. [DOI] [PMC free article] [PubMed] [Google Scholar]
- 19.Chikazu D, Li X, Kawaguchi H, Sakuma Y, Voznesensky OS, Adams DJ, Xu M, Hoshi K, Katavic V, Herschman HR, Raisz LG, Pilbeam CC. Bone morphogenetic protein 2 induces cyclooxygenase 2 in osteoblasts via a Cbfa1 binding site: role in effects of bone morphogenetic protein 2 in vitro and in vivo. 2002. J Bone Miner Res. 2005;20:1888–98. doi: 10.1359/jbmr.2005.20.10.1887. [DOI] [PubMed] [Google Scholar]
- 20.Lin BY, Jee WSS, Ma YF, Ke HZ, Kimmel DB, Li XJ. Effects of prostaglandin E2 and risedronate administration on cancellous bone in older female rats. Bone. 1994;15:489–96. doi: 10.1016/8756-3282(94)90272-0. [DOI] [PubMed] [Google Scholar]
- 21.Jee WS, Ma YF. The in vivo anabolic actions of prostaglandins in bone. Bone. 1997;21:297–304. doi: 10.1016/s8756-3282(97)00147-6. [DOI] [PubMed] [Google Scholar]
- 22.Suponitzky I, Weinreb M. Differential effects of systemic prostaglandin E2 on bone mass in rat long bones and calvariae. J Endocrinol. 1998;156:51–7. doi: 10.1677/joe.0.1560051. [DOI] [PubMed] [Google Scholar]
- 23.Faye-Petersen OM, Johnson WH, Jr, Carlo WA, Hedlund GL, Pacifico AD, Blair HC. Prostaglandin E1-induced hyperostosis: clinicopathologic correlations and possible pathogenetic mechanisms. Pediatr Pathol Lab Med. 1996;16:489–507. doi: 10.1080/15513819609168686. [DOI] [PubMed] [Google Scholar]
- 24.Ueda K, Saito A, Nakano H, Aoshima M, Yokota M, Muraoka R, Iwaya T. Cortical hyperostosis following long-term administration of prostaglandin E1 in infants with cyanotic congenital heart disease. J Pediatr. 1980;97:834–6. doi: 10.1016/s0022-3476(80)80282-4. [DOI] [PubMed] [Google Scholar]
- 25.Norrdin RW, Shih MS. Systemic effects of prostaglandin E2 on vertebral trabecular remodeling in beagles used in a healing study. Calcif Tissue Int. 1988;42:363–8. doi: 10.1007/BF02556354. [DOI] [PubMed] [Google Scholar]
- 26.Yoshida K, Oida H, Kobayashi T, Maruyama T, Tanaka M, Katayama T, Yamaguchi K, Segi E, Tsuboyama T, Matsushita M, Ito K, Ito Y, Sugimoto Y, Ushikubi F, Ohuchida S, Kondo K, Nakamura T, Narumiya S. Stimulation of bone formation and prevention of bone loss by prostaglandin E EP4 receptor activation. Proc Natl Acad Sci U S A. 2002;99:4580–5. doi: 10.1073/pnas.062053399. [DOI] [PMC free article] [PubMed] [Google Scholar]
- 27.Simon AM, Manigrasso MB, O'Connor JP. Cyclooxygenase 2 function is essential for bone fracture healing. J Bone Miner Res. 2002;17:963–76. doi: 10.1359/jbmr.2002.17.6.963. [DOI] [PubMed] [Google Scholar]
- 28.Einhorn TA. Cox-2: Where are we in 2003? - The role of cyclooxygenase-2 in bone repair. Arthritis Res Ther. 2003;5:5–7. doi: 10.1186/ar607. [DOI] [PMC free article] [PubMed] [Google Scholar]
- 29.Brown KM, Saunders MM, Kirsch T, Donahue HJ, Reid JS. Effect of COX-2-specific inhibition on fracture-healing in the rat femur. J Bone Joint Surg Am. 2004;86-A:116–23. doi: 10.2106/00004623-200401000-00017. [DOI] [PubMed] [Google Scholar]
- 30.Gerstenfeld LC, Al-Ghawas M, Alkhiary YM, Cullinane DM, Krall EA, Fitch JL, Webb EG, Thiede MA, Einhorn TA. Selective and nonselective cyclooxygenase-2 inhibitors and experimental fracture-healing. Reversibility of effects after short-term treatment. J Bone Joint Surg Am. 2007;89:114–25. doi: 10.2106/JBJS.F.00495. [DOI] [PubMed] [Google Scholar]
- 31.Simon AM, O'Connor JP. Dose and time-dependent effects of cyclooxygenase-2 inhibition on fracture-healing. J Bone Joint Surg Am. 2007;89:500–11. doi: 10.2106/JBJS.F.00127. [DOI] [PubMed] [Google Scholar]
- 32.Pead MJ, Lanyon LE. Indomethacin modulation of load-related stimulation of new bone formation in vivo. Calcif Tissue Int. 1989;45:34–40. doi: 10.1007/BF02556658. [DOI] [PubMed] [Google Scholar]
- 33.Lanyon LE. Control of bone architecture by functional load bearing. J Bone Miner Res. 1992;7:S369–S375. doi: 10.1002/jbmr.5650071403. [DOI] [PubMed] [Google Scholar]
- 34.Chow JW, Chambers TJ. Indomethacin has distinct early and late actions on bone formation induced by mechanical stimulation. Amer J Physiol. 1994;267:E287–E292. doi: 10.1152/ajpendo.1994.267.2.E287. [DOI] [PubMed] [Google Scholar]
- 35.Li L, Pettit AR, Gregory LS, Forwood MR. Regulation of bone biology by prostaglandin endoperoxide H synthases (PGHS): a rose by any other name. Cytokine Growth Factor Rev. 2006;17:203–16. doi: 10.1016/j.cytogfr.2006.01.005. [DOI] [PubMed] [Google Scholar]
- 36.Alam I, Warden SJ, Robling AG, Turner CH. Mechanotransduction in bone does not require a functional cyclooxygenase-2 (COX-2) gene. J Bone Miner Res. 2005;20:438–46. doi: 10.1359/JBMR.041124. [DOI] [PubMed] [Google Scholar]
- 37.Morham SG, Langenbach R, Loftin CD, Tiano HF, Vouloumanos N, Jennette JC, Mahler JF, Kluckman KD, Ledford A, Lee CA. Prostaglandin synthase 2 gene disruption causes severe renal pathology in the mouse. Cell. 1995;83:473–82. doi: 10.1016/0092-8674(95)90125-6. [DOI] [PubMed] [Google Scholar]
- 38.Norwood VF, Morham SG, Smithies O. Postnatal development and progression of renal dysplasia in cyclooxygenase-2 null mice. Kidney Int. 2000;58:2291–300. doi: 10.1046/j.1523-1755.2000.00413.x. [DOI] [PubMed] [Google Scholar]
- 39.Xu M, Choudhary S, Goltzman D, Ledgard F, Adams D, Gronowicz G, Koczon-Jaremko B, Raisz L, Pilbeam C. Do cyclooxygenase knockout mice have primary hyperparathyroidism? Endocrinology. 2005;146:1843–53. doi: 10.1210/en.2004-0734. [DOI] [PubMed] [Google Scholar]
- 40.Lim H, Paria BC, Das SK, Dinchuk JE, Langenbach R, Trzaskos JM, Dey SK. Multiple female reproductive failures in cyclooxygenase 2-deficient mice. Cell. 1997;91:197–208. doi: 10.1016/s0092-8674(00)80402-x. [DOI] [PubMed] [Google Scholar]
- 41.Parfitt AM, Drezner MK, Glorieux FH, Kanis JA, Malluche H, Meunier PJ, Ott SM, Recker RR. Bone histomorphometry: standardization of nomenclature, symbols, and units. Report of the ASBMR Histomorphometry Nomenclature Committee. J Bone Miner Res. 1987;2:595–610. doi: 10.1002/jbmr.5650020617. [DOI] [PubMed] [Google Scholar]
- 42.Foldes J, Shih MS, Parfitt AM. Frequency distributions of tetracycline-based measurements: implications for the interpretation of bone formation indices in the absence of double-labeled surfaces. J Bone Miner Res. 1990;5:1063–7. doi: 10.1002/jbmr.5650051010. [DOI] [PubMed] [Google Scholar]
- 43.Wang H, Ma WG, Tejada L, Zhang H, Morrow JD, Das SK, Dey SK. Rescue of female infertility from the loss of cyclooxygenase-2 by compensatory up-regulation of cyclooxygenase-1 is a function of genetic makeup. J Biol Chem. 2004;279:10649–58. doi: 10.1074/jbc.M312203200. [DOI] [PubMed] [Google Scholar]
- 44.Zhou H, Iida-Klein A, Lu SS, Ducayen-Knowles M, Levine LR, Dempster DW, Lindsay R. Anabolic action of parathyroid hormone on cortical and cancellous bone differs between axial and appendicular skeletal sites in mice. Bone. 2003;32:513–20. doi: 10.1016/s8756-3282(03)00057-7. [DOI] [PubMed] [Google Scholar]
- 45.McCauley LK, Koh AJ, Beecher CA, Rosol TJ. Proto-oncogene c-fos is transcriptionally regulated by parathyroid hormone (PTH) and PTH-related protein in a cyclic adenosine monophosphate-dependent manner in osteoblastic cells. Endocrinology. 1997;138:5427–33. doi: 10.1210/endo.138.12.5587. [DOI] [PubMed] [Google Scholar]
- 46.Phelps E, Bezouglaia O, Tetradis S, Nervina JM. Parathyroid hormone induces receptor activity modifying protein-3 (RAMP3) expression primarily via 3′,5′-cyclic adenosine monophosphate signaling in osteoblasts. Calcif Tissue Int. 2005;77:96–103. doi: 10.1007/s00223-004-0239-1. [DOI] [PubMed] [Google Scholar]
- 47.Yang D, Guo J, Divieti P, Shioda T, Bringhurst FR. CBP/P300-Interacting protein CITED1 modulates PTH regulation of osteoblastic differentiation. Endocrinology. 2008;49:1728–35. doi: 10.1210/en.2007-0826. [DOI] [PMC free article] [PubMed] [Google Scholar]
- 48.Bellido T, Ali AA, Gubrij I, Plotkin LI, Fu Q, O'Brien CA, Manolagas SC, Jilka RL. Chronic elevation of parathyroid hormone in mice reduces expression of sclerostin by osteocytes: a novel mechanism for hormonal control of osteoblastogenesis. Endocrinology. 2005;146:4577–83. doi: 10.1210/en.2005-0239. [DOI] [PubMed] [Google Scholar]
- 49.Keller H, Kneissel M. SOST is a target gene for PTH in bone. Bone. 2005;37:148–58. doi: 10.1016/j.bone.2005.03.018. [DOI] [PubMed] [Google Scholar]
- 50.Bellido T. Downregulation of SOST/sclerostin by PTH: a novel mechanism of hormonal control of bone formation mediated by osteocytes. J Musculoskelet Neuronal Interact. 2006;6:358–9. [PubMed] [Google Scholar]
- 51.Bikle DD, Sakata T, Leary C, Elalieh H, Ginzinger D, Rosen CJ, Beamer W, Majumdar S, Halloran BP. Insulin-like growth factor I is required for the anabolic actions of parathyroid hormone on mouse bone. J Bone Miner Res. 2002;17:1570–8. doi: 10.1359/jbmr.2002.17.9.1570. [DOI] [PubMed] [Google Scholar]
- 52.Martin TJ, Quinn JM, Gillespie MT, Ng KW, Karsdal MA, Sims NA. Mechanisms involved in skeletal anabolic therapies. Ann N Y Acad Sci. 2006;1068:458–70. doi: 10.1196/annals.1346.043. [DOI] [PubMed] [Google Scholar]
- 53.Loftin CD, Trivedi DB, Tiano HF, Clark JA, Lee CA, Epstein JA, Morham SG, Breyer MD, Nguyen M, Hawkins BM, Goulet JL, Smithies O, Koller BH, Langenbach R. Failure of ductus arteriosus closure and remodeling in neonatal mice deficient in cyclooxygenase-1 and cyclooxygenase-2. Proc Natl Acad Sci U S A. 2001;98:1059–64. doi: 10.1073/pnas.031573498. [DOI] [PMC free article] [PubMed] [Google Scholar]
- 54.Kennedy BP, Payette P, Mudgett J, Vadas P, Pruzanski W, Kwan M, Tang C, Rancourt DE, Cromlish WA. A natural disruption of the secretory group II phospholipase A2 gene in inbred mouse strains. J Biol Chem. 1995;270:22378–85. doi: 10.1074/jbc.270.38.22378. [DOI] [PubMed] [Google Scholar]
- 55.Myers LK, Bhattacharya SD, Herring PA, Xing Z, Goorha S, Smith RA, Bhattacharya SK, Carbone L, Faccio R, Kang AH, Ballou LR. The isozyme-specific effects of cyclooxygenase-deficiency on bone in mice. Bone. 2006;39:1048–52. doi: 10.1016/j.bone.2006.05.015. [DOI] [PubMed] [Google Scholar]
- 56.Bell CD, Vidal S, Kovacs K, Anderson J, Rotondo F. Cox-2 expression in the oxyphilic cells of the normal, hyperplastic, and adenomatous parathyroid gland. Endocr Pathol. 2004;15:29–38. doi: 10.1385/ep:15:1:29. [DOI] [PubMed] [Google Scholar]
- 57.Gardner DG, Brown EM, Attie MF, Aurbach GD. Effects of prostaglandins on adenosine 3′,5′-monophosphate content and adenylate cyclase activity in dispersed bovine parathyroid cells. Endocrinology. 1981;109:1545–51. doi: 10.1210/endo-109-5-1545. [DOI] [PubMed] [Google Scholar]
- 58.Brown EM, Swartz SL. Production of prostaglandins by dispersed cells and fragments from bovine parathyroid glands. Prostaglandins. 1985;29:35–46. doi: 10.1016/0090-6980(85)90149-2. [DOI] [PubMed] [Google Scholar]
- 59.Maruani G, Hertig A, Paillard M, Houillier P. Normocalcemic primary hyperparathyroidism: evidence for a generalized target-tissue resistance to parathyroid hormone. J Clin Endocrinol Metab. 2003;88:4641–8. doi: 10.1210/jc.2002-021404. [DOI] [PubMed] [Google Scholar]
- 60.Lowe H, McMahon DJ, Rubin MR, Bilezikian JP, Silverberg SJ. Normocalcemic primary hyperparathyroidism: further characterization of a new clinical phenotype. J Clin Endocrinol Metab. 2007;92:3001–5. doi: 10.1210/jc.2006-2802. [DOI] [PubMed] [Google Scholar]
- 61.Gomaa AA, Hassan HA, Ghaneimah SA. Effect of aspirin and indomethacin on the serum and urinary calcium, magnesium and phosphate. Pharmacol Res. 1990;22:59–70. doi: 10.1016/1043-6618(90)90744-x. [DOI] [PubMed] [Google Scholar]
- 62.Nusing RM, Reinalter SC, Peters M, Komhoff M, Seyberth HW. Pathogenetic role of cyclooxygenase-2 in hyperprostaglandin E syndrome/antenatal Bartter syndrome: therapeutic use of the cyclooxygenase-2 inhibitor nimesulide. Clin Pharmacol Ther. 2001;70:384–90. [PubMed] [Google Scholar]
- 63.bin Long I, Singh HJ, Rao GJ. Comparative effects of indomethacin and nabumetone on urine and electrolyte output in conscious rats. J Pharmacol Sci. 2005;99:272–6. doi: 10.1254/jphs.fpj05008x. [DOI] [PubMed] [Google Scholar]
- 64.Li X, Pilbeam CC, Pan L, Breyer RM, Raisz LG. Effects of prostaglandin E2 on gene expression in primary osteoblastic cells from prostaglandin receptor knockout mice. Bone. 2002;30:567–73. doi: 10.1016/s8756-3282(02)00683-x. [DOI] [PubMed] [Google Scholar]
- 65.North TE, Goessling W, Walkley CR, Lengerke C, Kopani KR, Lord AM, Weber GJ, Bowman TV, Jang IH, Grosser T, Fitzgerald GA, Daley GQ, Orkin SH, Zon LI. Prostaglandin E2 regulates vertebrate haematopoietic stem cell homeostasis. Nature. 2007;447:1007–11. doi: 10.1038/nature05883. [DOI] [PMC free article] [PubMed] [Google Scholar]
- 66.Robertson G, Xie C, Chen D, Awad H, Schwarz EM, O'Keefe RJ, Guldberg RE, Zhang X. Alteration of femoral bone morphology and density in COX-2-/- mice. Bone. 2006;39:767–72. doi: 10.1016/j.bone.2006.04.006. [DOI] [PMC free article] [PubMed] [Google Scholar]
- 67.Chen Q, Rho JY, Fan Z, Laulederkind SJ, Raghow R. Congenital lack of COX-2 affects mechanical and geometric properties of bone in mice. Calcif Tissue Int. 2003;73:387–92. doi: 10.1007/s00223-002-0009-x. [DOI] [PubMed] [Google Scholar]
- 68.Imanishi Y, Hosokawa Y, Yoshimoto K, Schipani E, Mallya S, Papanikolaou A, Kifor O, Tokura T, Sablosky M, Ledgard F, Gronowicz G, Wang TC, Schmidt EV, Hall C, Brown EM, Bronson R, Arnold A. Primary hyperparathyroidism caused by parathyroid-targeted overexpression of cyclin D1 in transgenic mice. J Clin Invest. 2001;107:1093–102. doi: 10.1172/JCI10523. [DOI] [PMC free article] [PubMed] [Google Scholar]
- 69.Tetradis S, Pilbeam CC, Liu Y, Kream BE. Parathyroid hormone induces prostaglandin G/H synthase-2 expression by a cyclic adenosine 3′,5′-monophosphate-mediated pathway in the murine osteoblastic cell line MC3T3-E1. Endocrinology. 1996;137:5435–40. doi: 10.1210/endo.137.12.8940368. [DOI] [PubMed] [Google Scholar]
- 70.Tetradis S, Pilbeam CC, Liu Y, Herschman HR, Kream BE. Parathyroid hormone increases prostaglandin G/H synthase-2 transcription by a cyclic adenosine 3′,5′-monophosphate-mediated pathway in murine osteoblastic MC3T3-E1 cells. Endocrinology. 1997;138:3594–600. doi: 10.1210/endo.138.9.5391. [DOI] [PubMed] [Google Scholar]
- 71.Lee SK, Lorenzo JA. Regulation of receptor activator of nuclear factor-kappa B ligand and osteoprotegerin mRNA expression by parathyroid hormone is predominantly mediated by the protein kinase A pathway in murine bone marrow cultures. Bone. 2002;31:252–9. doi: 10.1016/s8756-3282(02)00804-9. [DOI] [PubMed] [Google Scholar]
- 72.Yang D, Singh R, Divieti P, Guo J, Bouxsein ML, Bringhurst FR. Contributions of parathyroid hormone (PTH)/PTH-related peptide receptor signaling pathways to the anabolic effect of PTH on bone. Bone. 2007;40:1453–61. doi: 10.1016/j.bone.2007.02.001. [DOI] [PMC free article] [PubMed] [Google Scholar]
- 73.Chikazu D, Li X, Kawaguchi H, Sakuma Y, Voznesensky OS, Adams DJ, Xu M, Hoshio K, Katavic V, Herschman HR, Raisz LG, Pilbeam CC. Bone morphogenetic protein 2 induces cyclooxygenase 2 in osteoblasts via a Cbfal binding site: role in effects of bone morphogenetic protein 2 in vitro and in vivo. J Bone Miner Res. 2002;17:1430–40. doi: 10.1359/jbmr.2002.17.8.1430. [DOI] [PubMed] [Google Scholar]