

Abstract
The primary purposes of this study were to determine if controls, mild, and moderate/severe traumatic brain injury (TBI) patients performed differently on a battery of executive functioning (EF) tests, and to identify the operating characteristics of EF tests in this population. Participants consisted of 46 brain injured individuals and 24 healthy controls. All participants completed an extensive battery of EF tests. Results showed that mild TBI participants performed worse than controls on the Trail Making Test Part B, and that moderate/severe TBI participants consistently performed worse than either group on a variety of EF measures. Tests of EF exhibited a wide range of operating characteristics, suggesting that some EF tests are better than others in identifying TBI-related neurocognitive impairment. Predictive values were better for individuals with moderate/severe TBI than mild TBI. Overall, the Digit Span Backward Test showed the best positive predictive power in differentiating TBI. Our results provide useful data that may guide test selection in evaluating EF in patients with traumatic brain injury.
Introduction
Traumatic brain injury (TBI) is a physiological disruption of brain function that results when the head is struck, strikes an object, or undergoes acceleration/deceleration movement. There are approximately 1.7 million new cases of TBI in the United States each year, and prevalence estimates suggest that approximately 5.3 million Americans (approximately two-percent of the population) live with TBI-related deficits today (Faul, Xu, Wald, & Coronado, 2010). In addition to its effect on functional independence and quality of life in patients, TBI has a significant economic impact on society. In 2000, direct costs of medical care and indirect costs such as lost work productivity were estimated at $60 billion in the United States alone (Finkelstein, Corso, & Miller, 2006).
Relative to other areas of the cerebrum, the frontal lobes and polar areas of the temporal lobes are disproportionately susceptible to damage following TBI (Bigler, 2007). Their proximity to the frontal plate of the skull and the protuberances of the floor of the anterior cranial fossa (e.g., cribriform plate), and the medial temporal fossa makes the frontal lobes especially vulnerable to deceleration injuries with blunt head trauma (e.g., motor vehicle accidents, fall). This is evidenced by the high frequency of cases with acute cerebral contusions and hematomas in these regions following TBI (for review see Gennarelli & Graham, 2005).
Frontal lobe damage produces impairments in behavior and emotion (e.g., inhibitory control, facetiousness, drive, and behavioral regulation; Andersson & Bergedalen, 2002; Benson & Miller, 1999; Sarazin et al., 1998) and cognition (e.g., sequencing, abstract thinking, planning, and working memory; Anderson, Levin, & Jacobs, 2002; Roebuck-Spencer & Sherer, 2008) that are collectively known as the “dysexecutive syndrome.”
Neuropsychological tests of executive function (EF) are cornerstones in the evaluation of patients with TBI. This study was designed to evaluate how EF tests distinguished groups of patients that differed in brain injury severity by examining key operating characteristics, including sensitivity and specificity. Sensitivity refers to how often an abnormal test result occurs in persons with the disorder of study, and specificity refers to the likelihood that the test will be performed normally if the person does not have the disorder (Retzlaff & Gibertini, 2000). Knowledge of test sensitivity and specificity informs the clinician about the likelihood that an impaired/non-impaired test score reflects the presence/absence of the disorder.
Several operating characteristics are important to clinicians (Retzlaff & Gibertini, 2000). Positive predictive power (PPP) is the ratio of true positive cases to all test positives. More specifically, it refers to the probability that an impaired test score represents a person with the disorder. Negative predictive power (NPP) refers to the ratio of true negatives to all test negatives, and represents the probability that a person without an impaired test score does not have the disorder (Elwood, 1993). The reciprocal of PPP is the true positive rate, and the reciprocal of NPP is the false negative rate. These indices allow clinicians to derive probability estimates about the likelihood that a positive test finding represents a disorder.
Traditional neuropsychological tests of EF are capable of differentiating between brain-damaged and non brain-damaged controls; however, these tests have not consistently shown adequate specificity to frontal lobe damage (e.g., Anderson, Bigler, & Butler, 1995; Axelrod et al., 1996; Heaton, Chelune, Talley, Kay, & Curtiss, 1993). EF tests with poor specificity and low positive and negative predictive power may ultimately fail in accurately discriminating between those individuals with brain damage and those without. Developing tests with adequate sensitivity, specificity, and positive and negative predictive power for assessing EF is an area that needs further empirical investigation.
One study has examined the operating characteristics of EF tests in individuals with post-concussive syndrome (Cicerone & Azulay, 2002). Findings from this study indicate a wide range of operating characteristics among measures, with tests having a strong processing speed component showing the most reliable association with post-concussive symptoms. No studies to date, however, have thoroughly examined the operating characteristics of a battery of EF tests across the range of TBI severity (mild-severe).
The purposes of this study were to determine if controls, mild, and moderate/severe TBI patients performed differently on a broad range of EF tests. We hypothesized that group mean performance scores, on all individual tests designed to measure executive dysfunction, would differ as a function of group membership (e.g., control, mild, M/S) and that controls would perform best and mild TBI participants would perform better than M/S TBI participants. The second purpose of the study was to define the operating characteristics of several commonly used executive control tests at three levels of impairment (1.0, 1.5, and 2.0 standard deviations below the control mean) to determine which measures and dependent variables best discriminate between individuals previously determined to have sustained a TBI and those who have not.
Method
Participants
The sample included survivors of TBI with mild (n = 20) or moderate-to-severe (n = 26) injuries and 24 demographically-matched healthy control participants. Participants were a convenience sample recruited with flyers posted at the University of Florida (UF) Campus and the UF Health Science Center. Once contacted, all participants completed a structured interview to determine if they met study inclusion criteria. Study participants provided written informed consent according to procedures established by the Health Science Center Institutional Review Board at UF and were later compensated for their participation. Exclusion criteria included active litigation, history of psychiatric disorder, Attention Deficit Hyperactivity Disorder, Learning disorder, alcohol or substance abuse within six months prior to testing, or other prior neurologic disorders that could compromise cognition. Patients with language comprehension deficits, impairments of hand or finger mobility, or uncorrected visual impairments were also excluded from the study.
Severity of traumatic brain injury was determined from comprehensive patient and collateral interview and, when available, review of acute neurological indices from medical records. Neurological indices included duration of loss of consciousness (LOC), duration of post-traumatic amnesia (PTA), and initial Glasgow Coma Scale (GCS) score (Teasdale & Jennett, 1974). Mild TBI was defined as a GCS score between 13–15, LOC < 30 minutes and PTA < 24 hours (Kay et al., 1993). Moderate TBI was defined as a GCS score between 9 and 12, LOC between 30 minutes and 6 hours, or PTA between 1 and 7 days (Bond, 1986; Lezak, Howieson, & Loring, 2004). Severe TBI was defined as a GCS score < 9, LOC > 6 hours, or PTA > 7 days (Bond, 1986; Gerstenbrand & Stepan, 2001; Kay, et al., 1993). Patients with moderate (n = 8) or severe (n = 18) TBI were collapsed into a single “moderate-severe” (M/S) TBI group for purposes of analyses given the small number of moderate TBI patients.
In order to minimize classification errors of brain injury severity, patients were interviewed using retrospective interviewing methods for which reliability and validity have been demonstrated (King, Crawford, Wenden, Moss, & Wade, 1997; McMillan, Jongen, & Greenwood, 1996). Patients were asked to recall as much as they could remember, in chronological order, about what happened immediately before and after their injury. They were reminded to state only what they personally could remember and not what they had come to learn from others since the accident. The interviewer required lucid recall of material, excluding any “islands of memory” (Russell, 1971), until such time that the patient was able to describe a continuous stream of “episodic” memories following their injury. In our sample, this method was shown to be a valid means of brain injury severity classification1.
Test taking effort was assessed using the age-corrected scaled score (ACSS) from the Digit Span subtest of the Wechsler Adult Intelligence Scale—Third Edition (Wechsler, 1997). In previous research comparing TBI patients to “probable malingerers,” a Digit Span ACSS of ≤ 7 yielded sensitivity of 75% and specificity of 69% (Axelrod, Fichtenberg, Millis, & Wertheimer, 2006). Moreover, when compared to other Digit Span indices of effort such as Reliable Digit Span and Digit Span difference scores, the Digit Span ACSS method was superior (Axelrod, Fichtenberg, Millis, & Wertheimer, 2006).
Assessment procedures and measures
Study measures were subsequently administered as part of a larger battery of EF tasks. Neuropsychological tests administered included the 128-card version of the Wisconsin Card Sorting Test (WCST; Heaton et al., 1993)2, Stroop Test (Golden, 1978), Trail Making Test (TMT; Reitan, 1958; Reitan & Wolfson, 1995), Digit Span Test (Wechsler, 1997), Paced Auditory Serial Addition Test (PASAT; Gronwall, 1977) and the Digit Symbol Test (Wechsler, 1997). To assess affective functioning, the Beck Depression Inventory (BDI; Beck, Ward, Mendelson, Mock, & Erbaugh, 1961) was administered to all participants and the State-Trait Anxiety Inventory (STAI; Spielberger, Gorsuch, & Lushene, 1970) was administered to 47 participants (15 controls, 18 individuals with mild TBI, and 14 individuals with M/S TBI). Neuropsychological tests were presented in a random order determined by a random number generator.
Statistical analysis
We conducted multiple one-way (3-Group) ANOVAs to examine demographic variables, injury severity variables, our index of test taking effort, and neuropsychological test performance. Analysis of covariance (ANCOVA) was used as appropriate due to group differences in state-related anxiety. Follow-up group-wise comparisons determined which group differences accounted for the significant overall ANOVA or ANCOVA.
To determine the operating characteristics of EF tests in survivors of TBI, we utilized the procedures outlined by Cicerone and Azulay (2002) and others (e.g., Grodzinsky & Barkley, 1999; Lovejoy et al., 1999). First, all test raw scores were converted to z-scores based on our local control participant data. This method allowed us to standardize each participant’s test performance based on our local controls’ demographic characteristics (e.g., age, education, geographic region, quality of education, etc.). This method also permitted us to use a standard impairment threshold (e.g., 1.0, 1.5, 2.0 standard deviations) across all tests. Prevalence rates of brain injury were determined for each set of analyses by dividing the number of participants with mild or M/S TBI by the total sample size. Next, the sensitivity of each test to TBI was computed by dividing the number of true positives by the total number of participants with mild or M/S brain injury. Specificity was subsequently computed by dividing the number of true negatives by the total number of participants without brain injury. Positive predictive power (PPP) was computed by dividing the number of true positives by the total number of participants with a positive sign (e.g., impaired test finding). Negative predictive power (NPP) was computed by dividing the number of true negatives by the total number of participants with a negative sign (e.g., non-impaired test finding). Overall predictive power (OPP) was computed by adding the total number of true positives and true negatives and dividing this sum by the total sample size. Finally, odds ratios (OR) and 90% confidence intervals were computed using the methods outlined by Cicerone and Azulay (2002) and Bielauskas et al. (1997). Consistent with these studies, we considered a test to show a reliable positive association with TBI if odds ratios were equal to or greater than 3.0 and the lower level of the 90% confidence interval were equal to or greater than 1.0. Predictive power estimates were interpreted using Cohen’s (1988) assertion that coefficients of approximately .20, .50 and .80 are small, medium and large, respectively.
Results
Demographic and injury severity characteristics of the TBI and control participants are provided in Table 1. The majority of individuals with TBI (78.2%) had chronic injuries – 36 of 46 were greater than 12 months post injury. The three groups did not differ in Digit Span ACSS, F(2,67) = 1.00, p = .37 (Axelrod, et al., 2006)3. For demographic variables, groups were also well matched for both mother education, F(2,67) = 0.15, p = .80, and father education, F(2,65) = 0.25, p = .70. There were statistical trends toward group differences in participant age, F(2,67) = 2.88, p = .07, and education, F(2,67) = 2.66, p = .08, but the absolute differences of 6.7 and 1.2 years, respectively, likely does not reflect clinically meaningful differences. Regarding time-since-injury, there was a non-significant trend toward longer chronicity in the M/S compared to mild TBI participants, F(1,44) = 2.89, p = .10. For pre-injury intelligence estimates, the groups significantly differed on the North American Adult Reading Test (NAART; Blair & Spreen, 1989), F(2,67) = 3.63, p = .04, with M/S TBI patients performing significantly worse than mild TBI patients (p = .02).
Table 1.
Demographic Data for Controls and Individuals with Traumatic Brain Injury.
| Controls (n=24) | Mild TBI (n=20) | M/S TBI (n=26) | |
|---|---|---|---|
| Males/Females | 12/12 | 10/10 | 17/9 |
| Age (years) | 35.9 (2.2) | 34.0 (2.4) | 40.7 (2.1) |
| Education (years) | 13.8 (0.4) | 15.0 (0.4) | 13.9 (0.4) |
| Mother’s education (years) | 13.3 (0.6) | 12.9 (0.7) | 13.0 (0.6) |
| Father’s education (years) | 13.9 (0.7) | 13.6 (0.8) | 14.3 (0.7) |
| Time since injury (months) | -- | 62.9 (11.4) | 110.0 (22.6) |
| Mean Initial GCS (n=7) | -- | 14.0 (0.0) | 5.0 (0.9) |
| Mean LOC (hours) | -- | 0.03 (0.01) | 227.0 (60.7) |
| Mean PTA (hours) | -- | 1.2 (0.01) | 664.6 (175.0) |
| Digit Span ACSS | 9.88 (2.67) | 10.00 (2.29) | 9.00 (2.94) |
| NAART IQ Estimate* | 106.1 (1.5) | 109.2 (1.9) | 101.9 (2.2) |
| BDI score**† | 4.23 (1.11) | 6.15 (1.34) | 10.54 (1.69) |
| STAI-State score*‡ | 27.27 (1.40) | 26.67 (1.79) | 34.07 (2.87) |
| STAI-Trait score | 27.13 (2.07) | 33.33 (2.27) | 35.86 (3.69) |
| WCST categories completed | 5.8 (.6) | 5.9 (.3) | 5.6 (.8) |
| WCST prop. pers. errors | .09 (.04) | .09 (.05) | .11 (.06) |
| Stroop interference**† | −33.8 (9.8) | −28.6 (8.3) | −24.6 (8.5) |
| Trails A (seconds)**‡ | 21.8 (6.9) | 26.1 (8.2) | 36.4 (15.2) |
| Trails B (seconds)**‡^ | 49.1 (14.3) | 66.2 (26.2) | 93.3 (47.1) |
| Digit Span Forward score | 10.2 (2.0) | 10.9 (2.1) | 9.7 (2.5) |
| Digit Span Backward score | 6.7 (2.1) | 6.4 (1.7) | 5.7 (2.1) |
| PASAT total score**‡ | 77.4 (12.8) | 71.4 (16.7) | 57.4 (17.3) |
| Digit Symbol**† | 87.7 (17.3) | 77.7 (18.6) | 65.6 (15.7) |
Note.
Groups differed at p<.05;
Groups differed at p<.01;
Mod/Sev TBI significantly different from controls;
Mod/Sev TBI significantly different from mild TBI and controls;
Mild TBI significantly different from controls.
GCS=Glasgow Coma Scale; LOC=loss of consciousness; PTA=post-traumatic amnesia; ACSS= age-corrected scaled score; NAART=North American Adult Reading Test; BDI=Beck Depression Inventory; STAI=State-Trait Anxiety Inventory; WCST=Wisconsin Card Sorting Test; PASAT=Paced Auditory Serial Addition Test.
With regard to affective functioning, groups differed on level of depression symptoms as measured by the BDI, F(2,67) = 5.36, p < .01, and amount of state anxiety on the STAI, F(2,44) = 3.82, p < .03, but no group differences were present for trait anxiety, F(2,44) = 2.64, p < .09. On the BDI, M/S TBI patients scored significantly higher than controls (p < .004) and showed a trend toward higher scores than mild TBI patients (p = .06). Their average score, however, was still below clinically-significant cut-off levels. For level of state anxiety, M/S TBI patients scored higher than controls (p = .04), and mild TBI patients (p = .03), but the absolute scores did not represent clinically significant levels of state anxiety.
To examine relationships between affective variables and neuropsychological test performance, we conducted zero-order correlations between BDI scores, STAI scores, and scores on each of the neuropsychological tests (WCST, Stroop, Trail Making Test A and B, Digit Span, PASAT, and Digit Symbol) collapsed across groups. Scores on the BDI and STAI-Trait scale did not correlate with any neuropsychological test scores (rs < .23, ps > .09); however, state anxiety was negatively correlated with Digit Symbol score, r = −.34, p = .02, and positively correlated with Trail Making Test Part A time, r = .33, p = .02, indicating increased state anxiety was associated with poorer performance on these two measures of processing speed. Given these relationships, between-groups analyses of the Digit Symbol Test and the Trail Making Test Part A presented below controlled for STAI-State score by using analysis of covariance (ANCOVA).
Neuropsychological test performance
Neuropsychological test scores as a function of group are presented in Table 1; z-scores for the neuropsychological measures based on the control participant performance are depicted in Figure 1. Analyses revealed no reliable group differences in the number of categories completed, F(2,34) = 1.50, p > .05, or the proportion of perseverative errors, F(2,35) = 1.12, p > .05, on the WCST. Groups significantly differed on the Stroop Test, F(2,67) = 6.72, p < .01, with M/S TBI participants showing more interference than controls (p < .01), but not mild TBI participants (p > .05). An ANCOVA using STAI-State score as the covariate revealed a significant between group difference on the Trail Making Test Part A, F(3,43) = 5.89, p = .005. Individuals with M/S TBI took significantly longer to complete the Trail Making Test Part A when compared to mild TBI (p < .01) and control participants (p < .001). Those with M/S TBI took significantly longer to complete the Trail Making Test Part B when compared to mild TBI (p < .05) and control participants (p < .001). Individuals with mild TBI were significantly slower than control participants (p < .01).4
Figure 1. Z-scores for TBI groups across neuropsychological measuresa.
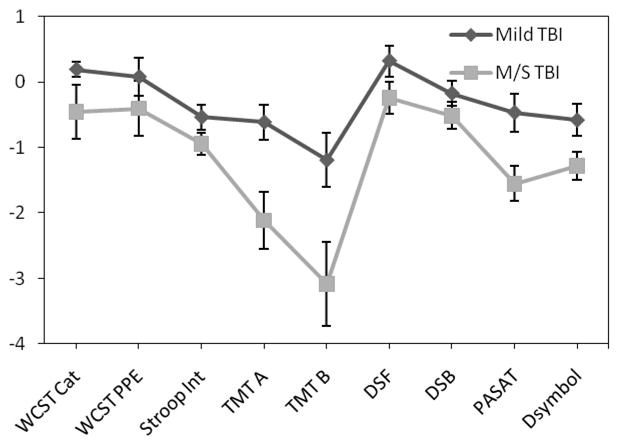
aMeans and standard deviations are based on controls from this study. Z-scores that were originally positive but reflected greater impairment (e.g., WCST proportion of errors) were changed to negative z-scores for continuity of data presentation.
There were no between group differences on the Digit Span Forward or Backward Tests, Fs < 1.80, ps > .05. On the PASAT, however, there was a significant difference between groups, F(2,67) = 10.58, p < .01, with M/S TBI participants achieving a significantly lower overall total score than mild TBI participants (p < .05) and controls (p < .001). ANCOVA, controlling for STAI-State score, showed significant between-group differences on the Digit Symbol Test, F(3,43) = 5.71, p = .006. M/S TBI participants completed significantly fewer items than controls (p < .001), but there were no differences between the TBI groups (p > .05).
Test operating characteristics
Test operating characteristics distinguishing between controls and mild TBI participants are presented in Table 2, and operating characteristics distinguishing between controls and M/S TBI participants are presented in Table 3. At the 1.0 standard deviation level of impairment, none of the measures met our relatively stringent criteria (i.e., odds ratios equal to or greater than 3.0 and the lower level of the 90% confidence interval equal to or greater than 1.0) for a reliable association with mild TBI (see Table 2); however, for M/S TBI, Stroop Interference, Trail Making Test Parts A and B, Digit Span Backward score, PASAT total score, and Digit Symbol score were reliably associated with M/S TBI. Given the large amount of information, narrative descriptions are provided only for those tests in which a reliable association was present at the 1.0 standard deviation level of impairment. Readers are referred to Tables 2 and 3 for the remaining test operating characteristics.
Table 2.
Operating characteristics for tests of executive dysfunction for controls (n=24) and mild TBI participants (n=20). For each test, the first line = 1.0 standard deviations (SD) below the controls, second line = 1.5 SD below, and third line = 2.0 SD below.
| Test | Dep. Var. | Impair. (SD) | Prev. | Sens. | Spec. | PPP | NPP | OPP | TP | TN | FP | FN | OR | 90% CI |
|---|---|---|---|---|---|---|---|---|---|---|---|---|---|---|
| WCST | Cat. Completed | 1.0 | .58 | .07 | .91 | .50 | .42 | .42 | 1 | 10 | 1 | 14 | .73 | .07 – 7.97 |
| Cat. Completed | 1.5 | .58 | .00 | .91 | .00 | .40 | .38 | 0 | 10 | 1 | 15 | .23 | .01 – 6.09 | |
| Cat. Completed | 2.0 | .58 | .00 | .91 | .00 | .40 | .38 | 0 | 10 | 1 | 15 | .23 | .01 – 6.09 | |
| Prop. Persev. Errors | 1.0 | .58 | .20 | .91 | .75 | .45 | .50 | 3 | 10 | 1 | 12 | 1.96 | .24 – 15.71 | |
| Prop. Persev. Errors | 1.5 | .58 | .13 | .91 | .67 | .43 | .46 | 2 | 10 | 1 | 13 | 1.30 | .15 – 11.46 | |
| Prop. Persev. Errors | 2.0 | .58 | .13 | .91 | .67 | .43 | .46 | 2 | 10 | 1 | 13 | 1.30 | .15 – 11.46 | |
| Stroop | Interference | 1.0 | .45 | .25 | .83 | .56 | .57 | .57 | 5 | 20 | 4 | 15 | 1.62 | .39 – 6.62 |
| Interference | 1.5 | .45 | .15 | .92 | .60 | .56 | .57 | 3 | 22 | 2 | 17 | 1.80 | .32 – 10.25 | |
| Interference | 2.0 | .45 | .05 | 1.0 | 1.0 | .56 | .57 | 1 | 24 | 0 | 19 | 3.77 | .14 – 97.74 | |
| Trails A | TMT A | 1.0 | .45 | .40 | .83 | .67 | .63 | .64 | 8 | 20 | 4 | 12 | 3.10 | .81 – 11.85 |
| TMT A | 1.5 | .45 | .20 | .92 | .67 | .58 | .60 | 4 | 22 | 2 | 16 | 2.45 | .46 – 13.06 | |
| TMT A | 2.0 | .45 | .15 | .92 | .60 | .56 | .57 | 3 | 22 | 2 | 17 | 1.8 | .32 – 10.25 | |
| Trails B | TMT B | 1.0 | .45 | .40 | .83 | .67 | .63 | .64 | 8 | 20 | 4 | 12 | 3.10 | .81 – 11.85 |
| TMT B | 1.5 | .45 | .35 | .92 | .78 | .63 | .66 | 7 | 22 | 2 | 13 | 5.00 | 1.03 – 24.33 | |
| TMT B | 2.0 | .45 | .30 | .92 | .75 | .61 | .64 | 6 | 22 | 2 | 14 | 4.03 | .81 – 20.00 | |
| Digit Span (Forward) | DSForward | 1.0 | .45 | .25 | .75 | .46 | .55 | .52 | 5 | 18 | 6 | 15 | 1.01 | .27 – 3.78 |
| DSForward | 1.5 | .45 | .00 | .92 | .00 | .52 | .50 | 0 | 22 | 2 | 20 | .22 | .01 – 4.85 | |
| DSForward | 2.0 | .45 | .00 | 1.0 | .00 | .55 | .55 | 0 | 24 | 0 | 20 | 1.20 | .02 – 62.92 | |
| Digit Span (Backward) | DSBackward | 1.0 | .45 | .15 | .96 | .75 | .58 | .59 | 3 | 23 | 1 | 17 | 3.13 | .42 – 23.39 |
| DSBackward | 1.5 | .45 | .05 | 1.0 | 1.0 | .56 | .57 | 1 | 24 | 0 | 19 | 3.77 | .14 – 97.74 | |
| DSBackward | 2.0 | .45 | .00 | 1.0 | .00 | .55 | .55 | 0 | 24 | 0 | 20 | 1.20 | .02 – 62.92 | |
| PASAT | PASAT Total | 1.0 | .45 | .30 | .79 | .55 | .58 | .57 | 6 | 19 | 5 | 14 | 1.59 | .42 – 5.97 |
| PASAT Total | 1.5 | .45 | .25 | .88 | .63 | .58 | .59 | 5 | 21 | 3 | 15 | 2.18 | .49 – 9.68 | |
| PASAT Total | 2.0 | .45 | .15 | 1.0 | 1.0 | .59 | .61 | 3 | 24 | 0 | 17 | 9.80 | .48 – 202.04 | |
| Digit Symbol | DSymbol | 1.0 | .47 | .45 | .83 | .69 | .63 | .65 | 9 | 19 | 4 | 11 | 3.58 | .94 – 13.64 |
| DSymbol | 1.5 | .47 | .20 | .91 | .67 | .57 | .58 | 4 | 21 | 2 | 16 | 2.35 | .44 – 12.51 | |
| DSymbol | 2.0 | .47 | .05 | .96 | .50 | .54 | .53 | 1 | 22 | 1 | 19 | 1.15 | .11 – 12.01 |
Note. Dep. Var.=dependent variable; Impair. (SD)=impairment level at 1.0, 1.5 or 2.0 standard deviations below the mean of controls in the current sample; Prev.=Prevalence; Sens.=sensitivity; Spec.=specificity; PPP=positive predictive power; NPP=negative predictive power; OPP=overall predictive power; TP=true positives; TN=true negatives; FP=false positives; FN=false negatives; OR=Odds Ratio; CI=confidence interval.
Table 3.
Operating characteristics for tests of executive dysfunction for controls (n=24) and moderate/severe TBI participants (n=26). For each test, the first line = 1.0 standard deviations (SD) below the controls, second line = 1.5 SD below, and third line = 2.0 SD below.
| Test | Dep. Var. | Impair. (SD) | Prev. | Sens. | Spec. | PPP | NPP | OPP | TP | TN | FP | FN | OR | 90% CI |
|---|---|---|---|---|---|---|---|---|---|---|---|---|---|---|
| WCST | Cat. Completed | 1.0 | .50 | .27 | .91 | .75 | .56 | .59 | 3 | 10 | 1 | 8 | 2.88 | .35 – 23.91 |
| Cat. Completed | 1.5 | .50 | .18 | .91 | .67 | .53 | .55 | 2 | 10 | 1 | 9 | 1.84 | .20 – 16.73 | |
| Cat. Completed | 2.0 | .50 | .18 | .91 | .67 | .53 | .55 | 2 | 10 | 1 | 9 | 1.84 | .20 – 16.73 | |
| Prop. Persev. Errors | 1.0 | .50 | .27 | .91 | .75 | .56 | .59 | 3 | 10 | 1 | 8 | 2.88 | .35 – 23.91 | |
| Prop. Persev. Errors | 1.5 | .50 | .18 | .91 | .67 | .53 | .55 | 2 | 10 | 1 | 9 | 1.84 | .20 – 16.73 | |
| Prop. Persev. Errors | 2.0 | .50 | .18 | .91 | .67 | .53 | .55 | 2 | 10 | 1 | 9 | 1.84 | .20 – 16.73 | |
| Stroop | Interference | 1.0 | .52 | .46 | .83 | .75 | .59 | .64 | 12 | 20 | 4 | 14 | 3.93 | 1.10 – 13.99 |
| Interference | 1.5 | .52 | .19 | .92 | .71 | .51 | .54 | 5 | 22 | 2 | 21 | 2.30 | .46 – 11.49 | |
| Interference | 2.0 | .52 | .12 | 1.0 | 1.0 | .51 | .54 | 3 | 24 | 0 | 23 | 7.30 | .35 – 149.06 | |
| Trails A | TMT A | 1.0 | .52 | .62 | .83 | .80 | .67 | .72 | 16 | 20 | 4 | 10 | 7.16 | 1.99 – 25.76 |
| TMT A | 1.5 | .52 | .54 | .92 | .88 | .65 | .72 | 14 | 22 | 2 | 12 | 10.44 | 2.31 – 47.25 | |
| TMT A | 2.0 | .52 | .42 | .92 | .85 | .59 | .66 | 11 | 22 | 2 | 15 | 6.68 | 1.47 – 30.32 | |
| Trails B | TMT B | 1.0 | .52 | .73 | .83 | .83 | .74 | .78 | 19 | 20 | 4 | 7 | 11.84 | 3.15 – 44.47 |
| TMT B | 1.5 | .52 | .69 | .92 | .90 | .73 | .80 | 18 | 22 | 2 | 8 | 19.59 | 4.21 – 91.23 | |
| TMT B | 2.0 | .52 | .58 | .92 | .88 | .67 | .74 | 15 | 22 | 2 | 11 | 12.13 | 2.67 – 55.08 | |
| Digit Span (Forward) | DSForward | 1.0 | .52 | .38 | .75 | .63 | .53 | .56 | 10 | 18 | 6 | 16 | 1.81 | .55 – 5.91 |
| DSForward | 1.5 | .52 | .15 | .92 | .67 | .50 | .52 | 4 | 22 | 2 | 22 | 1.80 | .34 – 9.40 | |
| DSForward | 2.0 | .52 | .08 | 1.0 | 1.0 | .50 | .52 | 2 | 24 | 0 | 24 | 5.00 | .23 – 109.62 | |
| Digit Span (Backward) | DSBackward | 1.0 | .52 | .35 | .96 | .90 | .58 | .64 | 9 | 23 | 1 | 17 | 8.50 | 1.36 – 53.01 |
| DSBackward | 1.5 | .52 | .15 | 1.0 | 1.0 | .52 | .56 | 4 | 24 | 0 | 22 | 9.80 | .50 – 192.42 | |
| DSBackward | 2.0 | .52 | .08 | 1.0 | 1.0 | .50 | .52 | 2 | 24 | 0 | 24 | 5.00 | .23 – 109.62 | |
| PASAT | PASAT Total | 1.0 | .52 | .65 | .79 | .77 | .68 | .72 | 17 | 19 | 5 | 9 | 6.53 | 1.90 – 22.40 |
| PASAT Total | 1.5 | .52 | .42 | .88 | .79 | .58 | .64 | 11 | 21 | 3 | 15 | 4.56 | 1.17 – 17.81 | |
| PASAT Total | 2.0 | .52 | .38 | 1.0 | 1.0 | .60 | .68 | 10 | 24 | 0 | 16 | 31.18 | 1.71 – 569.52 | |
| Digit Symbol | DSymbol | 1.0 | .44 | .56 | .83 | .71 | .70 | .71 | 10 | 19 | 4 | 8 | 5.35 | 1.36 – 21.00 |
| DSymbol | 1.5 | .44 | .33 | .91 | .75 | .64 | .66 | 6 | 21 | 2 | 12 | 4.47 | 0.89 – 22.52 | |
| DSymbol | 2.0 | .44 | .28 | .96 | .83 | .63 | .66 | 5 | 22 | 1 | 13 | 6.11 | 0.89 – 41.99 |
Note. Dep. Var.=dependent variable; Impair. (SD)=impairment level at 1.0, 1.5 or 2.0 standard deviations below the mean of controls in the current sample; Prev.=Prevalence; Sens.=sensitivity; Spec.=specificity; PPP=positive predictive power; NPP=negative predictive power; OPP=overall predictive power; TP=true positives; TN=true negatives; FP=false positives; FN=false negatives; OR=Odds Ratio; CI=confidence interval.
Stroop – Interference
For individuals with M/S TBI, Stroop Interference showed an Overall Predictive Power (OPP) of 64%, and sensitivity and specificity estimates of 46% and 83%, respectively. Fifty-four percent of individuals with a M/S TBI scored in the normal range. The PPP estimate was 75% and the NPP estimate was 59%. Based on odds ratios with the appropriate confidence intervals, an individual who scores one standard deviation below the mean of controls is almost 4 times more likely to be accurately classified as having sustained a M/S TBI than a person who scores above that level.
Trail Making Test Part A
Trail Making Test Part A showed an OPP of 72%, and sensitivity and specificity estimates of 62% and 83%, respectively, for individuals with a M/S TBI. Thirty-eight percent of individuals with M/S TBI scored in the normal range. Positive predictive power and NPP were good, at 80% and 67%, respectively. Odds ratios indicate an individual who scores one standard deviation below the mean of controls is 7 times more likely to be accurately classified as having a M/S brain injury than a person who scores above that level.
Trail Making Test Part B
Trail Making Test Part B showed an OPP of 78%, and sensitivity and specificity estimates of 73% and 83%, respectively. Only 27% of individuals with a M/S TBI scored in the normal range. The PPP estimate indicated that 83% of participants who obtained a score in the impaired range (test positive) were correctly classified as having sustained a M/S TBI. The NPP estimate indicated that 74% of control participants achieved a score in the unimpaired range (test negative) and were correctly classified as not having sustained a M/S TBI. Odds ratios indicate an individual who scores one standard deviation below the mean of controls is almost 12 times more likely to be correctly classified as having sustained a M/S TBI than a person who scores above that level.
Digit Span Backward
This variable showed an OPP of 64%, and sensitivity and specificity estimates of 35% and 96%, respectively. These findings indicate that 65% of individuals with a moderate/severe TBI scored in the normal range. The PPP estimate indicated that 90% of participants who obtained a score in the impaired range (test positive) were correctly classified as having sustained a moderate/severe TBI. The NPP estimate indicated that 58% of control participants achieved a score in the unimpaired range (test negative) and were correctly classified as not having sustained a moderate/severe TBI. For this variable, an individual who scores one standard deviation below the mean of controls is 8.5 times more likely to have sustained a M/S TBI than a person who scores above that level.
PASAT – Total Score
In M/S TBI participants, PASAT total score showed an OPP of 72%, and sensitivity and specificity estimates of 65% and 79%, respectively. These findings indicate that 35% of individuals with a M/S TBI scored in the normal range. The PPP estimate indicated that 77% of participants who obtained a score in the impaired range (test positive) were correctly classified as having sustained a M/S TBI. The NPP estimate indicated that 68% of control participants achieved a score in the unimpaired range (test negative) and were correctly classified as not having sustained a M/S TBI. For this variable, an individual who scores one standard deviation below the mean of controls is 6.5 times more likely to have sustained a M/S TBI than a person who scores above that level.
Digit Symbol
Digit Symbol showed an OPP of 71%, and sensitivity and specificity estimates of 56% and 83%, respectively. These findings indicate that 44% of individuals with a M/S TBI scored in the normal range. The PPP estimate indicated that 71% of participants who obtained a score in the impaired range (test positive) were correctly classified as having sustained a M/S TBI. The NPP estimate indicated that 70% of control participants achieved a score in the unimpaired range (test negative) and were correctly classified as not having sustained a M/S TBI. For this variable, an individual who scores one standard deviation or more below the mean of controls is 5.4 times more likely to have sustained a M/S TBI than a person who scores above that level.
Discussion
Between-group Comparisons
Results from the current study support previous research indicating that executive dysfunction is common following TBI. Groups differed on level of Stroop interference, Trail Making Test Parts A and B completion time, PASAT total score and Digit Symbol score. For each of these dependent variables, M/S TBI participants performed worse than control participants. M/S TBI patients performed worse than mild TBI patients on the Trail Making Test Parts A and B and PASAT total score only.
The only test that significantly differentiated the mild TBI participants from the control participants was the Trail Making Test Part B. This finding is consistent with previous literature suggesting that Trails B is a robust indicator of neuropsychological change in individuals with mild TBI (e.g., Lange, Iverson, Zakrzewski, Ethel-King, & Franzen, 2005). However, our findings differ from previous research that indicates that only a small number of individuals remain chronically symptomatic following mild TBI (Alexander, 1995; Binder, Rohling, & Larrabee, 1997) and that significant cognitive recovery occurs by 3-months post-injury (e.g., Alexander, 1995; Belanger, Curtiss, Demery, Lebowitz, & Vanderploeg, 2005; Demakis & Rimland, 2010; Dikman & Levin, 1993). Given that our mild TBI group was 62 months (SD=11.4) post injury, it is possible that the difference between our control and mild TBI groups on Trail Making Test Part B may have been partly due to non-mild TBI factors (see Limitations). Future studies should use repeated measures of EF tests at different time points in the recovery period following TBI to determine the natural history of executive dysfunction in this population.
Groups differed on measures of depression and state anxiety. While the absolute level of depression and state anxiety was low across all groups, it is possible that individuals with M/S TBI may have performed worse on some measures, particularly those with a higher attentional and processing speed demands, due to increased levels of affective symptoms (e.g., Himanen et al., 2009). Regarding test taking effort, our measure (Digit Span ACSS) did not differ between groups, suggesting group differences on EF tests were not due to differences in effort.
Neuropsychological Test Operating Characteristics
Test Operating Characteristics in Mild TBI
There was a wide range of operating characteristics on tests of EF but none of the EF measures used in this study met our criteria for a reliable, positive association in this sample of chronic mild TBI participants. In contrast to the group differences described above, the dependent variables that best indicated a mild TBI at 1.0 SD below the mean were the Digit Span Backward Test and the WCST proportion of perseverative errors. The Digit Span Backward Test achieved a PPP of .75 (odds ratio = 3.13 times more likely to have sustained a mild TBI). On the WCST, proportion of perseverative errors achieved a PPP of .75 (odds ratio = 1.96 times more likely to have sustained a mild TBI). When using a 1.5 SD cutoff, Digit Span Backward remained the strongest predictor of mild TBI, with the Trail Making Test Part B also having excellent PPP at .78 (odds ratio = 5.00 times more likely to have sustained a mild TBI).
Our findings in mild TBI are mixed when compared with previous research that evaluated the diagnostic accuracy of attention measures after mild TBI (Cicerone & Azulay, 2002). We found higher positive predictive power on the Digit Span Backward (our study/Cicerone & Azulay = .75/.50) and Stroop (.56/.40) Tests; lower positive predictive power on the Trail Making Test Part A (.67/.72), and Digit Span Forward Test (.46/.66); and both studies found equivalent positive predictive power on the Trail Making Test Part B (.67/.67). These results demonstrate that the aforementioned measures have moderately high rates of positive predictive power and have considerable value in the diagnostic assessment of mild TBI.
Test Operating Characteristics in M/S TBI
The Stroop interference score, Trail Making Test Parts A and B completion time, Digit Span Backward score, PASAT total score, and Digit Symbol score were all reliably associated with M/S TBI. With the exception of the Stroop interference score and Digit Span Backward score, the common element among these tests is processing speed, indicating that individuals with declines in processing speed are at least three times more likely to have experienced a M/S TBI than those without. This finding is not surprising, considering one of the primary abilities that decreases following TBI is processing speed (Mathias & Wheaton, 2007). In addition, decreased processing speed has been reliably associated with increased odds of having a mild TBI (Cicerone & Azulay, 2002).
The tests that were best able to predict the presence of a M/S TBI at the 1.0 SD level were Digit Span Backward (PPP = .90) and Trail Making Test Part B (PPP = .83). Similarly, the tests with the highest predictive values at the 1.5 SD level were Digit Span Backward (PPP = 1.0) and Trail Making Test Part B (PPP = .90). Odds ratios indicate that when an individual scored 1 SD below the mean on the Digit Span Backward Test, they were more than eight times more likely to have sustained a M/S TBI. Individuals who scored 1 SD below the mean on the Trail Making Test Part B were more than 11 times more likely to have experienced a M/S TBI. The diagnostic accuracy of these tests is quite good and consistent with previous studies showing them to be strong indicators of TBI (e.g., Armstrong, Allen, Donohue, & Mayfield, 2008; Cicerone & Azulay, 2002).
Our findings of variable rates of positive predictive power across EF measures are similar to those of other researchers who have studied test operating characteristics in other clinical populations (e.g., children and adults with Attention Deficit Hyperactivity Disorder; Grodzinsky & Barkley, 1999; Lovejoy, et al., 1999). Grodzinsky and Barkley (1999) found positive predictive power rates from .65 (WCST – failure to maintain set) to 1.0 (Rey-Osterrieth Complex Figure) on tests they administered to children with or without ADHD. However, few EF measures, including the Stroop, Trail Making Test, WCST, or Controlled Oral Word Association test, reached PPP rates in the .90 range. In a similar study of adults with ADHD, Lovejoy et al., (1999) reported PPP rates from .86 (Trail Making Test Part B) to 1.0 (Stroop, Trail Making Test Part A, Wechsler Adult Intelligence Scale Distractibility Index). Our clinical population may be similar to these clinical groups given that frontal/executive dysfunction is implicated in both TBI and ADHD.
Limitations
The small sample size used in this study is a limitation. Additionally, our decreased sample size in our assessment with the WCST may have impacted the test’s ability to discriminate between groups and also could have resulted in reduced operating characteristics on that single measure.
We used a convenience sample recruited from a university campus and university health science center and it is possible that any neuropsychological test performance differences between our controls and mild TBI group may be due to factors related to sampling error as opposed to chronic brain-injury-related sequelae. In light of past research that indicates a small but consistent effect size in performance on neuropsychological tests between controls and mild TBI participants (e.g., Binder, et al., 1997), future studies should include larger and more broadly representative samples at different times after injury to determine if significant group differences exist on the tests used in this study.
Our M/S TBI participants were slightly older than our mild TBI and control groups and our mild TBI group had approximately 1 more year of education than M/S and control participants. While these small differences are not likely to be clinically significant, future studies should ensure that groups are precisely matched on all variables that may impact neuropsychological outcome following TBI.
We did not have neuroradiological reports for most study participants. Given that positive CT scans occur in 15–20% of patients who otherwise meet diagnostic criteria for mild TBI (Mittenberg & Roberts, 2008; Iverson, Lovell, Smith, & Franzen, 2000; Stein & Ross, 1992), it is possible that our mild TBI group may have been comprised of individuals with “complicated” mild TBI (Lange, Iverson, & Franzen, 2009). Individuals with complicated mild TBI have been shown to perform more poorly on tests of neuropsychological functioning than those with uncomplicated mild TBI (Lange, Iverson, & Franzen, 2009).
Although the method of retrospective interview to classify brain injury severity has been validated in past studies (King, et al., 1997; McMillan, et al., 1996), having acute medical records on all TBI participants is an advantage when classifying participants in research studies. We validated our brain injury severity classification procedure by comparing classification by retrospective interview alone to classification based on acute neurological indices from medical records. Although we found excellent concordance, enrolling research participants with acute medical records will most likely provide the most accurate brain injury severity classification.
Summary and Conclusions
In summary, tests of EF show a wide range of operating characteristics in individuals with mild and M/S TBI. Predictive values were generally better for individuals with M/S than mild TBI. Overall, the Digit Span Backward Test showed the best positive predictive power in differentiating TBI. Findings provide information regarding the diagnostic accuracy of EF tests in TBI and should assist clinical neuropsychologists in accurately identifying individuals with brain dysfunction. Continued development of tests with adequate sensitivity, specificity, and positive and negative predictive power for assessing EF is an area of clinical neuropsychology that needs further empirical investigation and development.
Acknowledgments
Supported by grants from the Evelyn F. McKnight Brain Research Grant Program, the Florida Brain and Spinal Cord Injury Trust Fund, and the National Institute of Mental Health (K01 MH01857) to W.M.P. We thank Kay Waid-Ebbs and Paul J. Seignourel for their assistance with patient recruitment and data collection. This research was conducted in partial fulfillment of the first author’s Ph.D. dissertation.
Footnotes
We evaluated the accuracy of our retrospective interview method by comparing interview-only brain injury severity classification to brain injury severity classification in seven participants (1 mild, 6 M/S) for whom medical records were reviewed. In each case, the medical record review confirmed our initial interview-only method of brain injury severity classification as not a single participant was misclassified.
Due to difficulties with data collection, the sample size for the WCST consists of 15 individuals with mild TBI, 11 individuals with M/S TBI, and 10 controls.
We conducted a frequency count on the Digit Span Age-Corrected Scaled Scores (ACSS) and found that there was one participant with mild TBI and one control with ACSS less than 7 (both had ACSS of 6). When these participants were excluded, the pattern of significance in the between-groups differences did not change (i.e., the same values that were statistically significant remained as such). Thus, we chose to include all participants in the analyses in order to most fully represent our data.
Levene’s test of homogeneity of variance for the Trail Making Test Parts A and B revealed significantly different variances between-groups, Levene’s Statistic > 6.32, p < .003. Thus, we conducted a Welch’s ANCOVA that accounts for the group differences in variance. Results were consistent with the original ANCOVA, F(2,42) = 9.82, p < .001.
Contributor Information
Jason A. Demery, Psychology Service, North Florida/South Georgia Veterans Health System, Gainesville, Florida
Michael J. Larson, Departments of Psychology and Neuroscience, Brigham Young University, Provo, Utah
Neha K. Dixit, Psychology Service, North Florida/South Georgia Veterans Health System, Gainesville, Florida
Russell M. Bauerand, Department of Clinical & Health Psychology, University of Florida, Gainesville, Florida
William M. Perlstein, Department of Clinical & Health Psychology, University of Florida, Gainesville, Florida
References
- Alexander MP. Mild traumatic brain injury: Pathophysiology, natural history, and clinical management. Neurology. 1995;45:1253–1260. doi: 10.1212/wnl.45.7.1253. [DOI] [PubMed] [Google Scholar]
- Anderson CV, Bigler ED, Butler DD. Frontal lobe lesions, diffuse damage, and neuropsychological functioning in traumatic brain injured patients. Journal of Clinical and Experimental Neuropsychology. 1995;17:900–908. doi: 10.1080/01688639508402438. [DOI] [PubMed] [Google Scholar]
- Anderson V, Levin HS, Jacobs R. Executive functions after frontal lobe injury: A developmental perspective. In: Stuss DT, Knight RT, editors. Principles of frontal lobe function. New York: Oxford University Press; 2002. [Google Scholar]
- Andersson S, Bergedalen AM. Cognitive correlates of apathy in traumatic brain injury. Neuropsychiatry, Neuropsychology, and Behavioral Neurology. 2002;15:184–191. [PubMed] [Google Scholar]
- Armstrong CM, Allen DN, Donohue B, Mayfield J. Sensitivity of the comprehensive trail making test to traumatic brain injury in adolescents. Archives of Clinical Neuropsychology. 2008;23:351–358. doi: 10.1016/j.acn.2007.11.004. [DOI] [PubMed] [Google Scholar]
- Axelrod BN, Fichtenberg NL, Millis SR, Wertheimer JC. Detecting incomplete effort with Digi Span from the Wechsler Adult Intelligence Scale--Third Edition. The Clinical Neuropsychologist. 2006;20:513–523. doi: 10.1080/13854040590967117. [DOI] [PubMed] [Google Scholar]
- Axelrod BN, Goldman RS, Heaton RK, Curtiss G, Thompson LL, Chelune GJ, et al. Discriminability of the Wisconsin Card Sorting Test using the standardization sample. Journal of Clinical and Experimental Neuropsychology. 1996;18:338–342. doi: 10.1080/01688639608408991. [DOI] [PubMed] [Google Scholar]
- Beck AT, Ward CH, Mendelson M, Mock J, Erbaugh J. An inventory for measuring depression. Archives of General Psychiatry. 1961;4:561–571. doi: 10.1001/archpsyc.1961.01710120031004. [DOI] [PubMed] [Google Scholar]
- Belanger HG, Curtiss G, Demery J, Lebowitz B, Vanderploeg RD. Factors moderating neuropsychological outcomes following mild traumatic brain injury: A meta-analysis. Journal of the International Neuropsychological Society. 2005;11:215–227. doi: 10.1017/S1355617705050277. [DOI] [PubMed] [Google Scholar]
- Benson DF, Miller BL. The frontal lobes: Clinical and anatomic aspects. In: Feinberg TE, Farah MJ, editors. Behavioral Neurology and Neuropsychology. New York: McGraw Hill; 1999. pp. 401–408. [Google Scholar]
- Bielauskas LA, Fastenau PS, Lacy MA, Roper BL. Use of the odds ratio to translate neuropsychological test scores into real-world outcomes: From statistical significance to clinical significance. Journal of Clinical and Experimental Neuropsychology. 1997;19:889–896. doi: 10.1080/01688639708403769. [DOI] [PubMed] [Google Scholar]
- Bigler ED. Anterior and middle cranial fossa in traumatic brain injury: relevant neuroanatomy and neuropathology in the study of neuropsychological outcome. Neuropsychology. 2007;21:515–531. doi: 10.1037/0894-4105.21.5.515. [DOI] [PubMed] [Google Scholar]
- Binder LM, Rohling ML, Larrabee GJ. A review of mild head trauma. Part I: Meta-analytic review of neuropsychologicla studies. Journal of Clinical and Experimental Neuropsychology. 1997;19:421–431. doi: 10.1080/01688639708403870. [DOI] [PubMed] [Google Scholar]
- Blair JR, Spreen O. Predicting premorbid IQ: A revision of the National Adult Reading Test. The Clinical Neuropsychologist. 1989;3:129–136. [Google Scholar]
- Bond MR. Neurobehavioral sequelae of closed head injury. In: Grant I, Adams KM, editors. Neuropsychological assessment of neuropsychological disorders. New York: Oxford University Press; 1986. pp. 347–373. [Google Scholar]
- Cicerone KD, Azulay J. Diagnostic utility of attention measures in post-concussion syndrome. The Clinical Neuropsychologist. 2002;16:280–289. doi: 10.1076/clin.16.3.280.13849. [DOI] [PubMed] [Google Scholar]
- Cohen J. Statistical power analysis for the behavioral sciences. Hillsdale, NJ: Erlbaum Associates; 1988. [Google Scholar]
- Demakis GJ, Rimland CA. Untreated mild traumatic brain injury in a young adult population. Archives of Clinical Neuropsychology. 2010;25:191–196. doi: 10.1093/arclin/acq004. [DOI] [PubMed] [Google Scholar]
- Dikman SS, Levin HS. Methodological issues in the study of mild head injury. Journal of Head Trauma Rehabilitation. 1993;8:30–37. [Google Scholar]
- Elwood RW. Clinical discriminations and neuropsychological tests: An appeal to Bayes’ theorem. The Clinical Neuropsychologist. 1993;7:224–233. doi: 10.1080/13854049308401527. [DOI] [PubMed] [Google Scholar]
- Faul M, Xu L, Wald MM, Coronado VG. Traumatic brain injury in the United States: Emergency Department visits, hospitalizations, and deaths 2002–2006. Atlanta, GA: Centers for Disease Control and Prevention: National Center for Injury Prevention and Control; 2010. [Google Scholar]
- Finkelstein E, Corso P, Miller T. The incidence and economic burden of injuries in the United States. New York: Oxford University Press; 2006. [Google Scholar]
- Gennarelli TA, Graham DI. Neuropathology. In: Silver JM, McAllister TW, Yudofsky SC, editors. Textbook of Traumatic Brain Injury. Washington, D.C: American Psychiatric Publishing, Inc; 2005. pp. 27–50. [Google Scholar]
- Gerstenbrand F, Stepan CH. Mild traumatic brain injury. Brain Injury. 2001;15:95–97. doi: 10.1080/026990501458326. [DOI] [PubMed] [Google Scholar]
- Golden JC. Stroop Color and Word Test. Chicago: Stoelting Co; 1978. [Google Scholar]
- Grodzinsky GM, Barkley RA. Predictive power of frontal lobe tests in the diagnosis of attention deficit hyperactivity disorder. The Clinical Neuropsychologist. 1999;13:12–21. doi: 10.1076/clin.13.1.12.1983. [DOI] [PubMed] [Google Scholar]
- Gronwall DMA. Paced auditory serial-addition task: A measure of recovery from concussion. Perceptual and Motor Skills. 1977;44:367–373. doi: 10.2466/pms.1977.44.2.367. [DOI] [PubMed] [Google Scholar]
- Heaton RK, Chelune GJ, Talley JL, Kay GG, Curtiss G. Wisconsin Card Sorting Test manual: Revised and expanded. Odessa, FL: Psychological Assessment Resources, Inc; 1993. [Google Scholar]
- Himanen L, Portin R, Tenovuo O, Taiminen T, Koponen S, Hiekkanen H, et al. Attention and depressive symptoms in chronic phase after traumatic brain injury. Brain Injury. 2009;23:220–227. doi: 10.1080/02699050902748323. [DOI] [PubMed] [Google Scholar]
- Iverson GL, Lovell MR, Smith S, Franzen MD. Prevalance of abnormal CT-scans following mild head injury. Brain Injury. 2000;14:1057–1061. doi: 10.1080/02699050050203559. [DOI] [PubMed] [Google Scholar]
- Kay T, Harrington DE, Adams R, Anderson T, Berrol S, Cicerone K, et al. Report of the Mild Traumatic Brain Injury Committee of the Head Injury Interdisciplinary Special Interest Group of the American Congress of Rehabilitation Medicine: Definition of mild traumatic brain injury. Journal of Head Trauma Rehabilitation. 1993;8:86–87. [Google Scholar]
- King NS, Crawford S, Wenden FJ, Moss NE, Wade DT. Interventions and service need following mild and moderate head injury: The Oxford Head Injury Service. Clinical Rehabilitation. 1997;11:13–27. doi: 10.1177/026921559701100104. [DOI] [PubMed] [Google Scholar]
- Lange RT, Iverson GL, Franzen MD. Neuropsychological functioning following complicated vs. uncomplicated mild traumatic brain injury. Brain Injury. 2009;23:83–91. doi: 10.1080/02699050802635281. [DOI] [PubMed] [Google Scholar]
- Lange RT, Iverson GL, Zakrzewski MJ, Ethel-King PE, Franzen MD. Interpreting the Trail Making Test following traumatic brain injury: Comparison of traditional time scores and derived indices. Journal of Clinical and Experimental Neuropsychology. 2005;27:897–906. doi: 10.1080/1380339049091290. [DOI] [PubMed] [Google Scholar]
- Lezak MD, Howieson D, Loring D. Neuropsychological Assessment. 4. New York: Oxford Press; 2004. [Google Scholar]
- Lovejoy DW, Ball JD, Keats M, Stutts MI, Spain EH, Janda L, et al. Neuropsychological performance of adults with attention deficit hyperactivity disorder (ADHD): Diagnostic classification estimates for measures of frontal lobe/executive functioning. Journal of the International Neuropsychological Society. 1999;5:222–233. doi: 10.1017/s1355617799533055. [DOI] [PubMed] [Google Scholar]
- Mathias JL, Wheaton P. Changes in attention and information processing speed following severe traumatic brain injury: A meta-analytic review. Neuropsychology. 2007;21:212–223. doi: 10.1037/0894-4105.21.2.212. [DOI] [PubMed] [Google Scholar]
- McMillan TM, Jongen EL, Greenwood RJ. Assessment of post-traumatic amnesia after severe closed head injury: Retrospective or prospective? Journal of Neurology, Neurosurgery, and Psychiatry. 1996;60:422–427. doi: 10.1136/jnnp.60.4.422. [DOI] [PMC free article] [PubMed] [Google Scholar]
- Mittenberg W, Roberts DM. Mild traumatic brain injury and postconcussion syndrome. In: Morgan JE, Ricker JH, editors. Textbook of clinical neuropsychology: Studies on neuropsychology, neurology and cognition. New York: Taylor & Francis; 2008. pp. 430–436. [Google Scholar]
- Reitan RM. Validity of the Trail Making Test as an indicator of organic brain damage. Perceptual and Motor Skills. 1958;8:271–276. [Google Scholar]
- Reitan RM, Wolfson D. The Halstead-Reitan Neuropsychological Test Battery. Tucson, AZ: Neuropsychology Press; 1985. [Google Scholar]
- Retzlaff PD, Gibertini M. Neuropsychometric issues and problems. In: Vanderploeg RD, editor. Clinician’s Guide to Neuropsychological Assessment. 2. Mahwah, New Jersey: Lawrence Erlbaum Associates; 2000. [Google Scholar]
- Roebuck-Spencer T, Sherer M. Moderate and severe traumatic brain injury. In: Morgan JE, Ricker JH, editors. Textbook of Clinical Neuropsychology. New York, N.Y: Taylor & Francis; 2008. [Google Scholar]
- Russell WR. The traumatic amnesias. London: Oxford University Press; 1971. [Google Scholar]
- Sarazin M, Pillon B, Giannakopoulos P, Rancurel G, Samson Y, Dubois B. Clinicometabolic dissociation of cognitive functions and social behavior in frontal lobe lesions. Neurology. 1998;51:142–148. doi: 10.1212/wnl.51.1.142. [DOI] [PubMed] [Google Scholar]
- Spielberger CD, Gorsuch RL, Lushene RE. Manual for the state-trait anxiety inventory. Palo Alto, CA: Consulting Psychologists Press; 1970. [Google Scholar]
- Stein SC, Ross SE. Mild head injury: A plea for routine early CT scanning. The Journal of Trauma. 1992;33:11–13. [PubMed] [Google Scholar]
- Teasdale G, Jennett B. Assessment of coma and impaired consciousness: A practical scale. Lancet. 1974;ii:81–84. doi: 10.1016/s0140-6736(74)91639-0. [DOI] [PubMed] [Google Scholar]
- Wechsler D. Wechsler Adult Intelligence Scale. 3. San Antonio, TX: The Psychological Corporation; 1997. [Google Scholar]