

Abstract
The compromised abilities to localize sounds and to understand speech are two hallmark deficits in aged individuals. The auditory cortex is necessary for these processes, yet we know little about how normal aging affects these early cortical fields. In this study, we recorded the spatial tuning of single neurons in primary (auditory cortex, A1) and secondary (caudolateral field, CL) auditory cortical areas in young and aged alert rhesus macaques. We found that the neurons of aged animals had greater spontaneous and driven activity, and broader spatial tuning compared with those of younger animals. Importantly, spatial tuning was not sharpened between A1 and CL in aged monkeys as it is in younger monkeys. This implies that a major effect of normal aging is a degradation of the hierarchical processing between serially connected cortical areas, which could be a key contributing mechanism of the general cognitive decline that is commonly observed in normal aging.
Introduction
Normal aging is commonly accompanied by deficits in understanding speech, particularly in noisy environments, and in the ability to localize sounds, which likely contributes to the difficulty in parsing different auditory streams (speakers) in a complex environment. Although age-related peripheral hearing loss can take a variety of forms (Schuknecht, 1964; Ohlemiller, 2004), central mechanisms of age-related hearing deficits have largely been examined in subcortical areas and indicate that there is a decrease in neuronal inhibition throughout the ascending auditory pathway, which has been related to increased spontaneous and driven activity in subcortical auditory structures (for review, see Caspary et al., 2008). The bulk of these studies were performed in rodents; how the primate brain is affected by normal aging has been little explored. What is also unclear is how primary or secondary auditory cortical neurons are affected by normal aging in any species. Two previous cortical studies indicate that there are changes in the temporal response properties (Mendelson and Ricketts, 2001) and in the distribution of the receptive field types (Turner et al., 2005), but no changes in spontaneous or driven rates. A more recent study did note an increase in spontaneous and driven activity in the anesthetized rat auditory cortex (Hughes et al., 2009), consistent with what has been observed in the primate visual cortex (Wang et al., 2005). The decreased inhibition seen throughout the ascending auditory system predicts that there should be an increase in both spontaneous and driven activity in aged compared with younger auditory cortical neurons, a prediction tested by the experiments reported here.
The primate auditory cortex is organized in a core–belt–parabelt fashion (Kaas and Hackett, 2000; Hackett et al., 2001). The caudolateral belt area (CL) is serially and hierarchically connected with the primary auditory cortex (A1) and these two areas can be both histologically and functionally defined (Kaas and Hackett, 2000; Rauschecker and Tian, 2000; Recanzone et al., 2000a). Neurons in CL have sharper spatial tuning compared with neurons in other core and belt cortical areas (Woods et al., 2006). In addition, the firing rate of the population of CL neurons, but not A1 neurons, is sufficient to account for contralateral sound localization across a broad intensity range (Miller and Recanzone, 2009). It is also known that sound localization ability is degraded with age (Brown, 1984; Kubo et al., 1998; Abel et al., 2000), which predicts that spatial tuning of area CL neurons should show a corresponding broadening. To test this hypothesis, we recorded the spatial tuning functions of single neurons in auditory cortical areas A1 and CL across 360° of acoustic space using broadband noise stimuli at a single intensity in aged macaque monkeys. These responses were compared with those from younger animals to determine what types of changes in spatial tuning occur with aging.
Materials and Methods
Animals.
All methods were approved by the University of California at Davis Institutional Animal Care and Use Committee and conformed to Association for Assessment and Accreditation of Laboratory Animal Care and Society for Neuroscience guidelines. Neurons recorded from three young male monkeys (identified as F, G, and L) were taken from Woods et al. (2006) and detailed methods of those procedures can be found there. Recordings from two aged male animals (A and B) were virtually identical to those of the younger animals. Young monkeys were aged 5.1–6.2 years (monkey F), 6.3–7.5 years (monkey G), and 9.5–11.5 years (monkey L) over the course of the study, whereas monkey A was 24.1–25.8 years and monkey B was 24.4–26.2 years during the course of these experiments. Aging in the macaque after sexual maturity can be considered to be approximately three times that of a human, corresponding to ∼75 years of age in the aged monkeys. These animals were raised at the California National Primate Research Center and had no history of exposure to ototoxic drugs, excessive loud noise, or ear infections. Additionally, they had similar rearing histories before participating in the current study.
A recording cylinder and head post was surgically implanted in an aseptic procedure to allow access to the superior plane of the superior temporal gyrus using a vertical approach (Recanzone et al., 2000a). The left hemisphere was investigated in all five animals. Animals were seated in an acoustically transparent primate chair and placed in a sound booth (IAC) lined with echo-attenuating foam (Sonex).
Stimulus presentation and data collection.
Stimuli consisted of unfrozen Gaussian noise (65 dB SPL) for 200 ms duration (5 ms rise/fall) presented from one of 16 speakers ∼1 m from the center of the interaural axis and at 0° elevation. Speaker locations spanned 360° in azimuth in 22.5° steps. An additional trial type where no stimulus was presented was used to measure spontaneous activity. Several stimuli (3–7) were presented from random locations (S1) until a stimulus was presented from the same location two times consecutively (S2). The no-stimulus condition used to measure spontaneous activity occurring in place of an S1 stimulus, ensuring that any difference between spontaneous and driven activity was not due to anticipatory or other factors. Following the S2 stimulus, the monkey was given a liquid reward and a new trial was initiated after a brief delay to allow the animal to swallow.
Single neurons were recorded using single tungsten microelectrodes (FHC) that were advanced using a hydraulic microdrive (Narshige) until unit activity responsive to auditory stimuli was encountered. Search stimuli included broadband noise and band-passed noise and tones, as well as more complex stimuli such as hand clapping and vocalizations. Single neurons were isolated using a time–amplitude window discriminator (BAK). The characteristic frequency and threshold were manually defined by decreasing the stimulus intensity and adjusting the frequency until the lowest intensity stimulus that could still reliably drive the neuron was found. Action-potential times were recorded by a computer at 1 ms resolution, which also controlled stimulus and reward delivery using Tucker–Davis Technologies hardware and software interfaced with customized software. Responses were recorded for 12 trials for each location (including spontaneous trials), and only data from S1 stimuli are presented here. There were two main differences between these data and those collected in the younger animals. The first was that the aged animals were tested at only 65 dB SPL whereas the young monkeys were tested at 25, 35, 55, and 75 dB SPL. We compared the results from presentations at 55 and 75 dB SPL in the younger animals for all the metrics described here, and in no cases were there statistically significant differences. The second difference is that two of the three young monkeys were also performing a simple discrimination task whereas one of the younger animals (monkey G) and the two aged animals were alert but not performing a specific task. For the simple task, the monkey had to depress a lever to start a trial. The stimuli were presented as described above and the presentation of the S2 stimulus was followed by a small fluid reward and an audible noise from the water delivery system. The monkey could then release the lever to obtain a larger reward. Monkey G and the old monkeys did not have to depress the lever, but they did hear the same sounds, including the S2 stimulus, and were presented with a small reward that was immediately followed by the larger reward. We compared the responses between the two young animals and monkey G for all the analyses reported here, and there were no statistically significant differences. We further compared these response metrics for neurons in the two belt cortical areas adjacent to area CL, the caudomedial (CM) and the mediolateral (ML) fields, between these two sets of monkeys and again found no statistically significant difference. Thus, although attention may influence the response properties of auditory cortical neurons, there is no evidence that the subtle differences between the two tasks in these experiments evoked these influences in the comparisons made as they had no effect on the results presented here.
Data analysis.
Spike trains were taken from stimulus onset until 150 ms after stimulus offset (350 ms total), as in Woods et al. (2006). The best direction was defined as the speaker location that elicited the greatest response. The worst direction was defined as the location that elicited the smallest response. Spontaneous activity was recorded as the response when no stimulus was presented. The signal-to-noise ratio (SNR) was defined as the response in the best direction divided by the spontaneous activity. Tuning index was defined as 1 − (response in worst direction/response in best direction). This value varies from 0 (best and worst directions are the same) to 1 (best direction is much greater than the worst direction). Vector strength (Goldberg and Brown, 1969) was defined by assigning each direction of motion a vector with the magnitude equal to the average number of spikes per trial and a direction corresponding to the spatial location. These vectors were then summed and divided by the total number of spikes across vectors. This value varies between 0.0 (no spatial tuning) and 1.0 (responses for only one location). Statistical analysis included unpaired t test to determine whether a neuron was responsive or spatially tuned. The Kolmogorov–Smirnov nonparametric test was used to test for differences in spontaneous and driven activity, tuning index, and signal-to-noise ratio. Chi-square tests were used for the analysis of best direction.
Audiometric testing.
The two aged animals, as well as four different younger animals (aged 8–14 years) (the young animals tested physiologically were no longer available), were also trained on an auditory detection task. It should be noted that the young animals tested physiologically showed normal thresholds across frequencies in their cortical responses (Recanzone et al., 2000a) and showed no signs of hearing impairment, as with the four animals tested here, when performing a variety of acoustic discrimination tasks. Animals depressed a lever to start a trial. A 200 ms noise or tone was presented following 0.5–3.0 s. If the animal released the lever within 500 ms of stimulus onset, it received a fluid reward and the next presentation was at a lower intensity. Not releasing the lever resulted in no reward and the next trial was presented at a higher intensity. Decreases were 5 dB until the first reversal, and then increments and decrements were set at 1 dB. Threshold was defined as 15 reversals and was repeated 2–4 times for each stimulus. Stimuli tested were 0.5, 1, 2, 4, 8, 12, and 16 kHz and the broadband noise used in the physiology experiments.
Results
The behavioral audiograms of the two aged animals as well as the means of four younger animals (∼8–14 years, corresponding to 24–42 human years) from the same colony are shown in Figure 1. There was a close correspondence between the two groups of animals, and they were also well in line with similar data collected in Japanese macaques (gray line) (Jackson et al., 1999). The only subtle difference was at 8 kHz, where older monkeys had slightly larger thresholds, although the mean difference was only 10 dB. These three functions were not statistically significantly different (t test, p > 0.05). Importantly, the detection thresholds for broadband noise stimuli, used for the spatial tuning data in this report, were not different between the two groups of animals. Thus, any differences seen between the two groups must be due primarily to age.
Figure 1.

Mean behavioral audiograms of two geriatric and four young macaque monkeys. Animals were trained to release a lever when they detected a 200-ms-duration tonal stimulus. Stimulus intensity was decreased 1 dB with each correct detection and increased 1 dB with each unsuccessful trial. Threshold was defined by 10–20 reversals. The two aged animals (filled circles) showed normal audiograms compared with the younger animals (empty circles) up to ∼12 kHz. Detection thresholds for the noise stimulus used in the physiology experiments were not different (noise). Gray line shows data taken from Jackson et al. (1999) for Japanese macaques.
Single neuron recordings
We recorded from a total of 731 neurons from the left hemispheres of the five monkeys. Single neuron responses were categorized as being in A1 or CL based on the characteristic frequency (CF), CF progression, response to tone and noise stimuli, and the location within the recording cylinder. Histological examination of the younger animals confirmed that the recording sites were appropriately classified. The two older animals are still participating in experiments, and the CF maps for these two monkeys are shown in Figure 2. Isofrequency bands in 1-octave ranges are shown by the shading of the circles with red backgrounds denoting A1 locations and blue CL locations. The solid black line is drawn approximately orthogonally to the isofrequency bands and runs approximately rostral (upward) to caudal (downward) with lateral on the left of the figure. Additional locations are shown that helped to determine the medial and rostral boundaries of these fields. The total number of neurons recorded in each monkey from each cortical area that are reported here is provided in Table 1.
Figure 2.
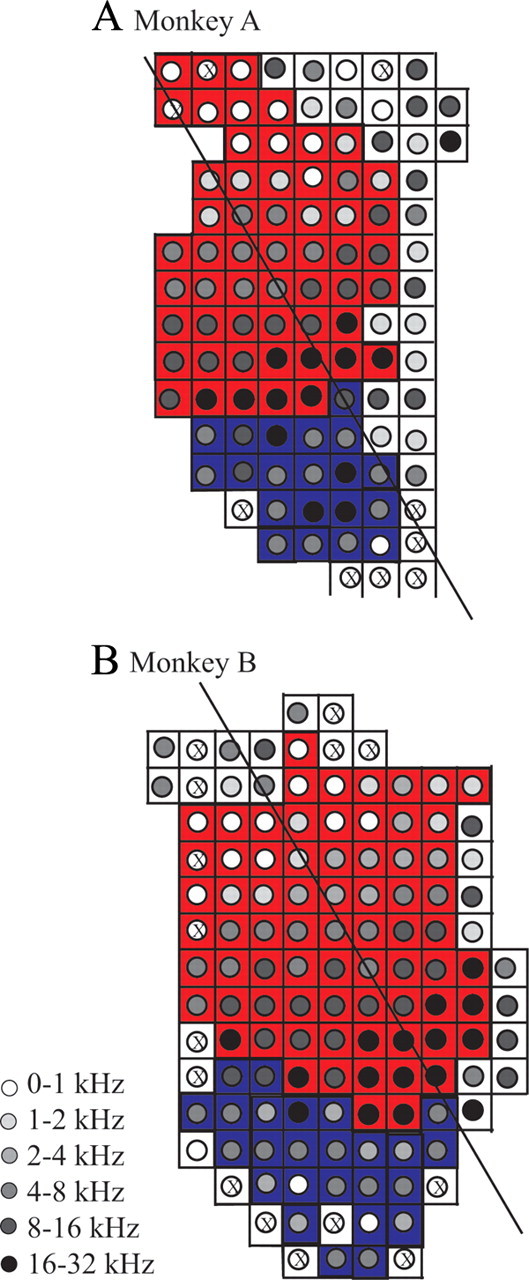
CF topography in A1 and CL of aged monkeys. A, B, Schematics of the recording grid where neurons in A1 (red) and CL (blue) were collected. Circles denote locations with characteristic frequencies within 1 octave bands (see text). X's denote regions where electrode penetrations occurred but no single neuron was isolated. The solid line is located approximately in the rostral (upward) to caudal direction and lies approximately orthoganol to the isofrequency axis along the middle of A1. This line was used to differentiate CL from CM, located more medially. Only locations in cortical areas immediately surrounding A1 and CL are shown for clarity (e.g., the rostral, middle medial, and caudomedial fields). A1 shows the characteristic isofrequency bands whereas this topography is not as apparent in area CL. Penetrations are separated by 1 mm.
Table 1.
Numbers of neurons recorded
| A1 | CL | Total | |
|---|---|---|---|
| Young | |||
| Monkey F | 50 | 71 | 121 |
| Monkey L | 131 | 119 | 250 |
| Monkey G | 114 | 0 | 114 |
| Total | 295 | 190 | 485 |
| Old | |||
| Monkey A | 57 | 42 | 99 |
| Monkey B | 98 | 49 | 137 |
| Total | 155 | 91 | 246 |
| Grand total | 450 | 281 | 731 |
The CF and threshold are shown for the young and old monkeys for the two cortical areas in Figure 3. These data are consistent with those described previously (Recanzone et al., 2000a) for younger animals. The data from the older animals is largely consistent, with two slight differences. One is that there were fewer units recorded in older animals with high thresholds compared with younger animals. Although this was not a dramatic effect, it did reach statistical significance (unpaired t test, p < 0.05). The second was that the younger animals had the lower thresholds across CF compared with older animals in A1. This could be due to either a sampling bias, since there were considerably more neurons recorded in younger animals (Table 1), or genuine differences between the two populations of neurons. Regardless, these differences were slight (within 10 dB) and are consistent with the behavioral audiograms (Fig. 1), indicating that the aged monkeys in this report did not have a significant hearing loss.
Figure 3.

CF and threshold values for recorded neurons. A–D, Threshold for all single neurons as a function of characteristic frequency in young (A, C) and old (B, D) monkeys for A1 (A, B) and CL (C, D). The range of frequencies tested were similar between the two groups of monkeys, but the minimum thresholds were greater in the older animals compared with the younger animals.
Changes in spontaneous and driven activity
The first level of analysis was to determine whether there was any difference in the spontaneous and/or driven activity. Spontaneous activity was taken during the behavioral task during the no-sound control (see Materials and Methods). Statistical analysis indicated that there was no difference between the three younger monkeys, nor between the two older monkeys, so monkeys from those two groups were combined. Figure 4 shows the distributions of this activity for A1 and CL neurons for young and aged monkeys. Statistical analysis [Kolmogorov–Smirnov (K–S) nonparametric test] showed that there was a difference between young and old monkeys in A1 (mean, 4.196 vs 5.747 for young vs old, respectively; K–S test, 1.450; p < 0.05) as well as in CL (mean, 3.379 vs 9.849; K–S test, 4.309; p < 0.001). This difference was most evident in CL neurons (Fig. 4B). Between-cortical-field analysis in younger monkeys found that the spontaneous activity was greater in A1 than in CL neurons (K–S test, 1.575; p < 0.05); however, the spontaneous activity was greater in CL than in A1 neurons in aged monkey (K–S test, 2.393; p < 0.001).
Figure 4.
Distributions of spontaneous activity. There was no difference between young monkeys or old monkeys so those data were combined. A, Distributions of A1 neurons. B, Distributions of CL neurons. Neurons from old monkeys (solid bars) had greater spontaneous activity compared with the neurons from young monkeys (open bars), particularly in area CL. spks, Spikes.
This difference in activity was also seen in the driven response across all directions. Figure 5 shows the responses of three representative CL neurons from younger animals (Fig. 5A) and three from older animals (Fig. 5B). Two main points can be taken from this figure. First, there was considerably more driven activity in the aged monkeys compared with younger monkeys, consistent with the increase in spontaneous rate. Second, the selectivity of the neurons for spatial location was greater in the younger animals compared with the older animals. This can be seen by comparing the overall response along each column. For the younger monkeys, there was a clear difference between the best and worst locations, whereas in the aged monkeys these differences were much more subtle.
Figure 5.
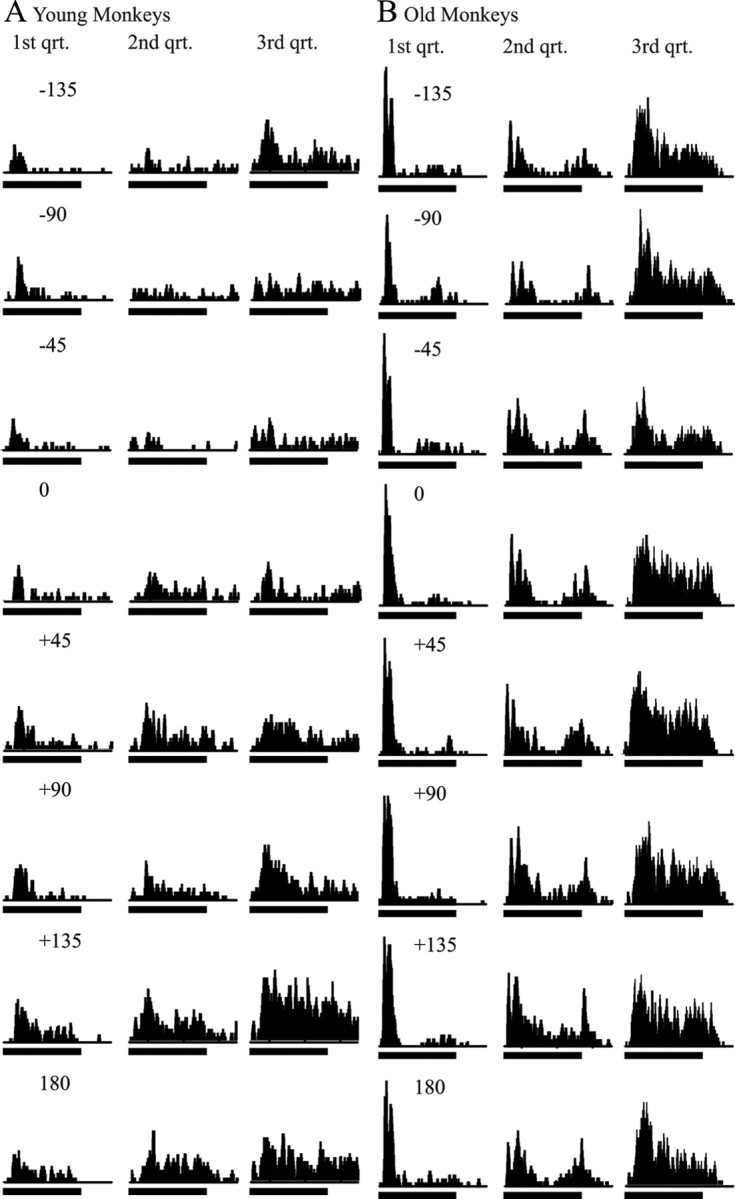
Spatial tuning from six exemplar CL neurons. A, Three different single neuron responses from young animals. B, Three different single neuron responses from old animals. Each column shows the peristimulus time histogram from a single neuron that ranked at the first (left), second (center), and third (right) quartile (qrt). Each column shows the response from a different direction, with 0 being directly in front of the monkey and +90 and −90 being to the far right and left, respectively. Responses to locations from the four cardinal directions as well as the two obliques only are shown for clarity, although the intermediate locations were also tested (e.g., 22.5°). The horizontal bar beneath each peristimulus time histogram shows the stimulus duration (200 ms); the entire peristimulus time histogram is 350 ms. Each peristimulus time histogram is composed from 12 individual trials. These rankings were based on the average response >350 ms for the direction that elicited the greatest response. Overall activity increased and spatial tuning decreased in older compared with younger animals.
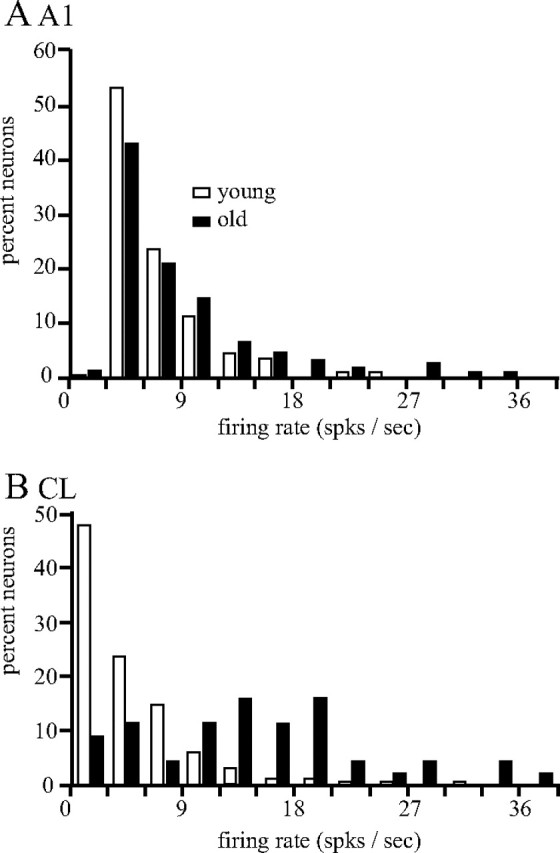
These impressions were verified statistically. Once again, there was no difference between the distributions of the driven response to the best direction as a function of stimulus intensity (55 vs 75 dB), between the three young animals, or between the two older animals, so these data were combined. The resulting distributions are shown in Figure 6. Aged animals had statistically significant greater driven activity for stimuli presented from the best direction compared with younger animals, and this difference was quite large. The driven rate was greater in the aged animals compared with the younger animals at any intensity in both A1 (mean, 11.346 vs 27.976 for young vs old, respectively; K–S test, 5.583; p < 0.001) and CL (mean, 9.002 vs 28.526; K–S test, 6.312; p < 0.001). We also compared the signal-to-noise ratio (SNR) by dividing the activity to the location that gave the best response by the spontaneous activity. Here there was not a statistically significant difference between the aged and younger animals (p > 0.05).
Figure 6.

Distributions of driven activity for the stimulus at the best direction. A, Distribution of A1 neurons. There was no difference between the individual young monkeys or between the individual old monkeys, so those data were combined. Old monkeys generally had greater driven rates than young monkeys. B, Distributions of CL neurons. Neurons from old monkeys again had greater driven activity compared with the neurons from young monkeys. spks, Spikes.
Differences in spatial tuning
As noted in Figure 5, the spatial tuning of the neurons from the older animals was much less apparent than that seen in the neurons from the younger animals. Statistical analysis showed that nearly all cells encountered showed a statistically significant response to the direction that elicited the greatest response compared with spontaneous activity (unpaired t test, p < 0.05; 57 of 57 and 97 of 98 of A1 neurons, and 42 of 42 and 49 of 49 CL neurons; monkeys A and B, respectively). This is consistent with what has been seen in younger animals (Woods et al., 2006). Statistical analysis comparing the firing rates between the directions that gave the greatest and least response showed that the vast majority of neurons encountered in the aged monkeys were spatially tuned (t test, p < 0.01; 91–96% of neurons). This percentage is higher than that seen in the younger animals (78–87%) (Woods et al., 2006, their Table 2). Finally, the distributions of neurons with best direction in the left versus the right hemifields were not different between aged and young animals in A1 or CL when considered either over a 90° range [−135 to −45 vs 45 to 135°; χ2 (1, n = 338) = 1.03; p > 0.05 and χ2 (1, n = 281) = 3.18; p > 0.05 for A1 and CL, respectively] or over a 135° range (−157.5 to −22.5 vs 22.5 to 157.5°; χ2 (1, n = 338) = 2.96; p > 0.05 and χ2 (1, n = 281) = 3.80; p > 0.05 for A1 and CL, respectively). Thus, there were no differences in the percentages of responsive or tuned neurons or in the distribution of best directions between the two groups of monkeys in the two cortical areas.
Three metrics of spatial tuning were tested in these populations of neurons and all showed that neurons in aged animals had significantly broader spatial tuning. The first was the tuning index (TI), defined as 1 − (response to the worst direction/response to the best direction), that has been used previously to define the tuning of auditory cortical neurons (Woods et al., 2006) as well as direction tuning for visual motion in visual cortex (Baker et al., 1981; Recanzone et al., 1997). This metric defines the difference between the responses in the directions eliciting the greatest and least responses and is analogous to the SNR. The distributions of tuning index were not different between the individual monkeys within the young and aged groups, nor between 55 and 75 dB, so the data were pooled (Fig. 7). There was no significant difference in these distributions between young and aged animals for A1 (mean, 0.661 vs 0.649; K–S test, 0.945; p > 0.05). However, there was a statistically significant difference between young and old CL neurons (0.784 vs 0.642; K–S test, 3.376; p < 0.001). Perhaps more interesting was that the young monkeys showed an increase in the tuning index from A1 to CL of ∼19%, which was significant (p < 0.01). This is apparent in Figure 7, as there is a decrease in neurons with small TIs (<0.6) and more at the higher TIs (>0.8) in the younger monkeys. In contrast, no such difference was found between A1 and CL of the older monkeys (−1% difference, p > 0.05). Thus, in contrast to younger animals, there was no increase in the dynamic range of the neuronal responses as a function of space between the serially and hierarchically connected areas A1 and CL in aged monkeys.
Figure 7.

A, B, Distributions of tuning index in A1 (A) and CL (B). Old monkeys had a smaller tuning index (black bars) compared with younger monkeys (white bars) in both cortical areas. The increase in tuning index seen between A1 and Cl in young monkeys did not occur in the old monkeys (compare A vs B).
The tuning index defines the dynamic range of the neuronal response but does not necessarily describe the broadness of spatial tuning. We used two alternative metrics that take into account all of the locations tested. This first was to determine the vector strength of each neuron based on the response to the 360° tested (Goldberg and Brown, 1969). The results of this analysis are shown in Figure 8. Similar to what was observed for driven and spontaneous activity, there was no difference between the three younger animals or between stimuli presented at 55 and 75 dB SPL, so these distributions were combined. Once again, there was no difference between younger and older animals for A1 neurons (mean, 0.159 vs 0.164 for young vs old, respectively; K–S test, 1.258; p > 0.05) but there was a difference between younger and older animals for CL neurons (0.225 vs 0.183; K–S test, 2.079; p < 0.001). The differences between A1 and CL are shown in Figure 9, where the same data are replotted to directly compare the distributions in A1 and CL neurons. As was seen with the tuning index, there was also a substantial increase in spatial tuning, as reflected by a larger vector strength between CL and A1 neurons in younger monkeys (54% increase), which was statistically significant (p < 0.05). In contrast, although there was an increase in older monkeys between CL and A1 (12%), this did not reach statistical significance (p > 0.05).
Figure 8.
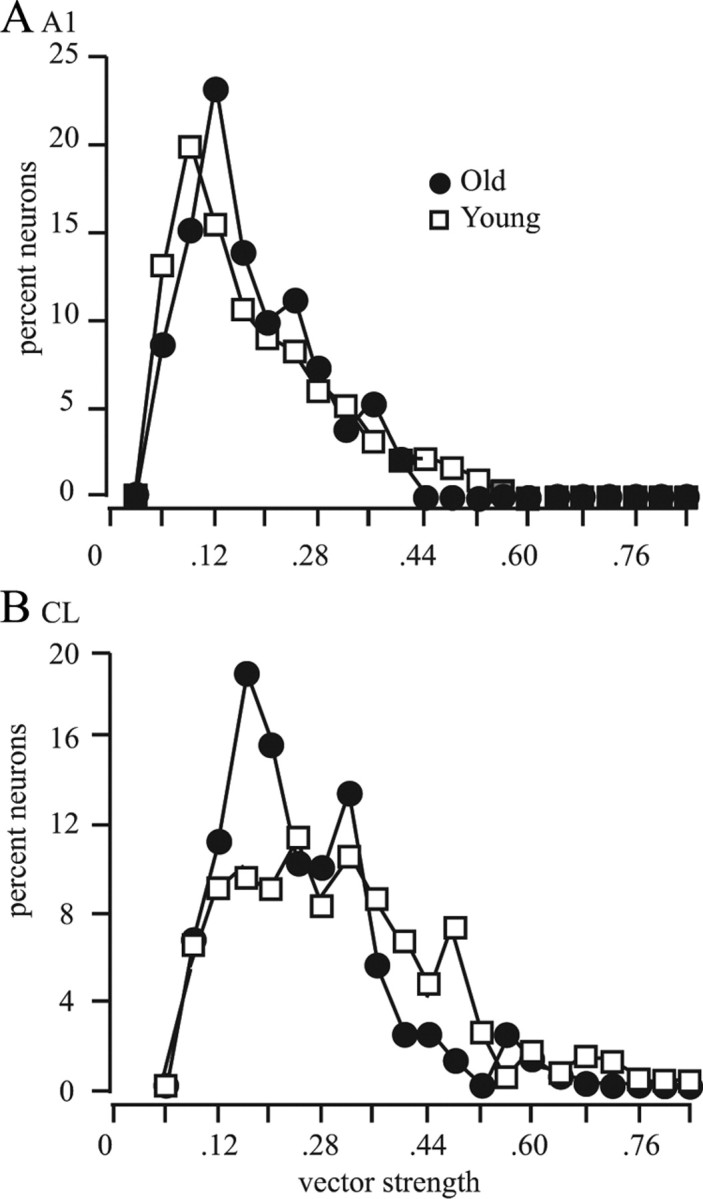
Distribution of vector strengths. Vector strength was calculated for each cell. A, Results from A1 neurons. B, Results from CL neurons. Neurons in older monkeys had a greater percentage of neurons with low vector strengths, indicating broad spatial tuning.
Figure 9.
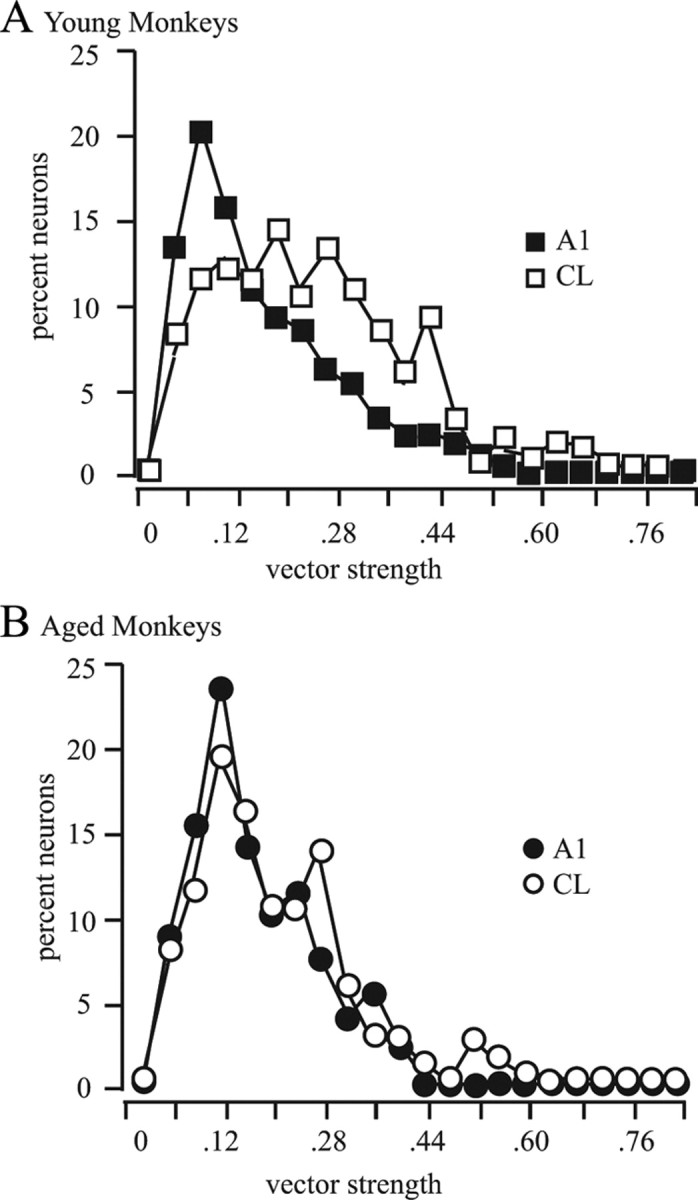
Comparisons of vector strengths between A1 and CL. A, B, Distribution of vector strengths for A1 (filled symbols) and CL (unfilled symbols). A, Results from young monkeys. There was a clear shift in the distribution to larger vector strengths between A1 and CL neurons. B, Distributions from the aged monkeys. Here there was no difference in the distributions, indicating that there was no increase in spatial tuning between A1 and CL in aged monkeys.
Next, we determined the tuning of the population of neurons recorded in each cortical area between young and older animals. In this case, the firing rate at each location was normalized by the firing rate at the best direction for that neuron. The data were also aligned by making the best direction at 0° and the response at all other locations presented relative to that location. The results are shown in Figure 10. Once again, there were no differences in the spatial tuning of A1 neurons between the younger monkeys, the older monkeys, or the stimulus intensity. For CL neurons, however, there was a difference between the two older monkeys compared with the three younger monkeys (but no differences were noted within groups). In this case, the older monkeys had broader spatial tuning compared with the younger monkeys, as was seen by previous metrics.
Figure 10.
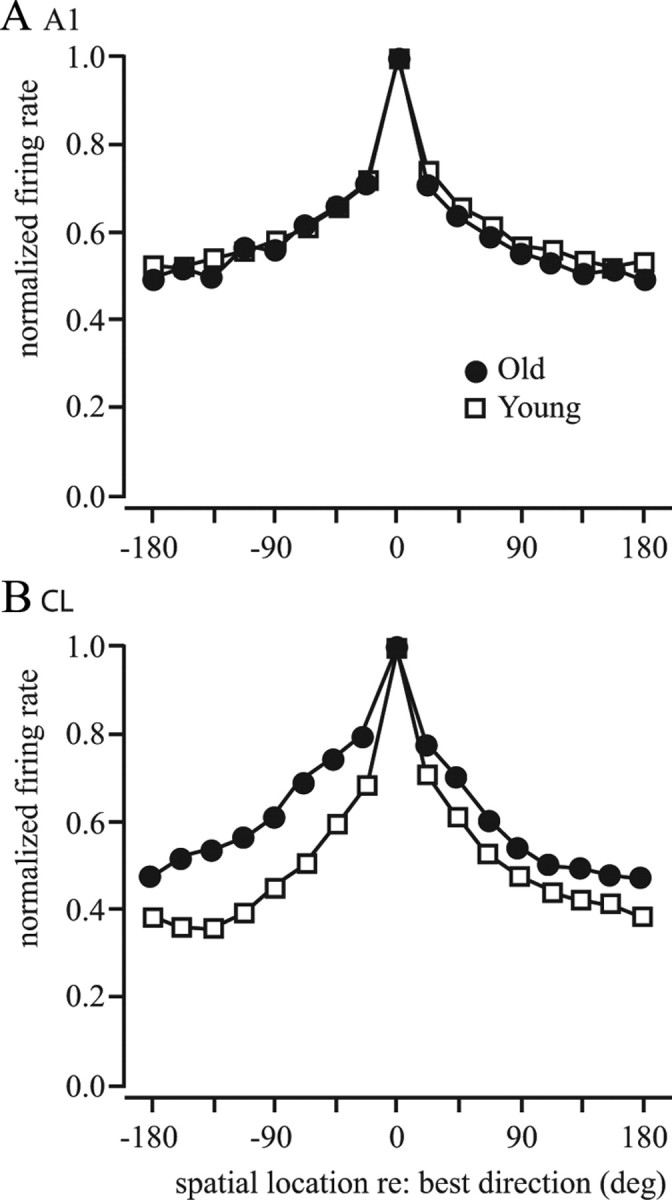
A, B, Normalized population tuning curves. Each neuron was normalized by the peak firing rate and centered with the best direction at 0°. A, A1 neurons showed similar population tuning between old monkeys and young monkeys. B, There was a broader spatial tuning of CL neurons in older monkeys compared with younger monkeys.
One shortcoming of the preceding analyses is that the spontaneous activity can influence the metrics. For example, a high spontaneous rate will cause the tuning index to become smaller by increasing the response in the worst direction. The vector strength metric suffers from a similar problem, as there will be some level of activity at all directions. Subtracting the spontaneous activity before calculating the tuning index or vector strength is inherently difficult, as it can result in negative numbers for locations that are inhibited, leading to numbers >1.0, which are difficult to interpret. The population tuning curves do not suffer from this issue, so we reanalyzed the data by first subtracting the spontaneous activity from the response to each direction before the normalization. These results in the population tuning analysis are shown in Figure 11. In this case, there are clear differences between the spatial tuning of the population of older A1 neurons compared with younger A1 neurons (Fig. 11A). This difference was even more dramatic when comparing the tuning functions of CL neurons, where there was clear inhibition in the farthest non-best directions (particularly on the ipsilateral side), whereas no inhibition occurred at the population level in older animals.
Figure 11.
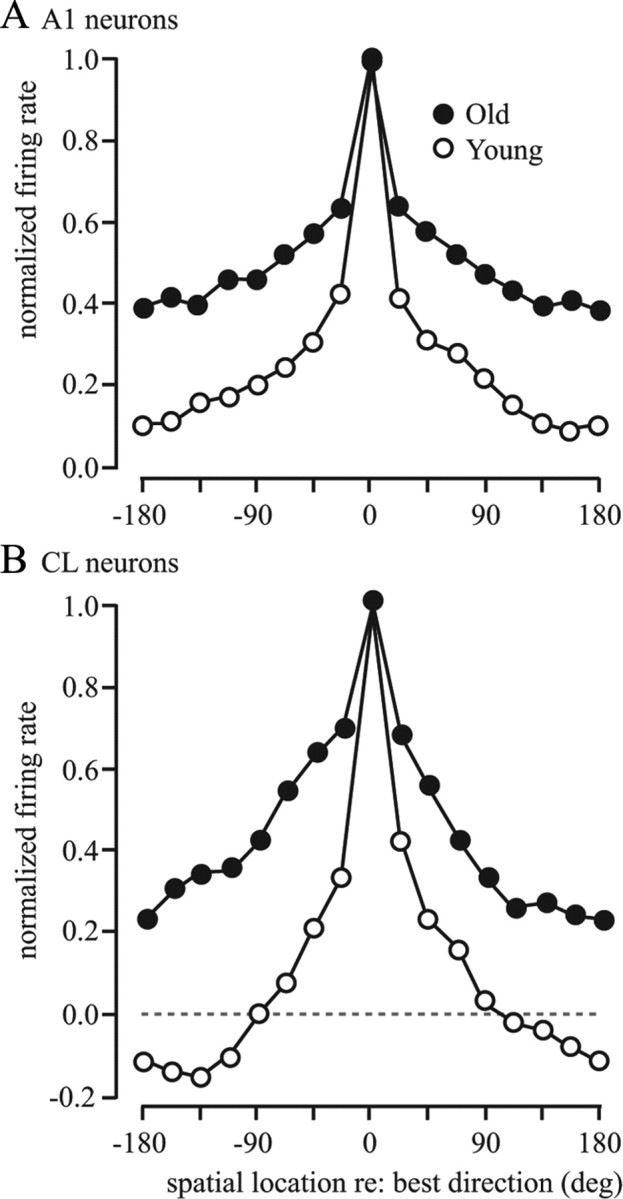
A, B, Normalized population tuning curves with spontaneous activity removed. The spontaneous activity was subtracted from the firing rate for each direction tested before the normalization. Best direction was centered at 0°. Older monkeys had broader spatial tuning compared with younger monkeys and an overall higher relative firing rate, particularly for CL neurons, where the population response was inhibited in younger monkeys for directions far from the best direction.
The differences between A1 and CL neurons are shown in Figure 12 for direct comparison and are consistent with the results described previously. There is a slight sharpening of tuning for older animals in A1. One metric to compare these differences is to compute the sum of the square of the difference between each of the 16 locations. In this case, the sum for old animals is 0.214, whereas the sum for younger animals is over twice that at 0.539. The three sets of analysis (tuning index, vector strength, and population tuning) all converge on the same general finding that the effects of aging on the spatial tuning in A1 is relatively small and not always statistically significantly different from that of younger animals. However, there is a significant effect of aging on the spatial tuning of CL neurons, and the difference between A1 and CL neurons in aged monkeys is modest at best. This is in stark contrast to the spatial tuning of CL neurons in younger monkeys, which is much sharper than that of A1 neurons.
Figure 12.
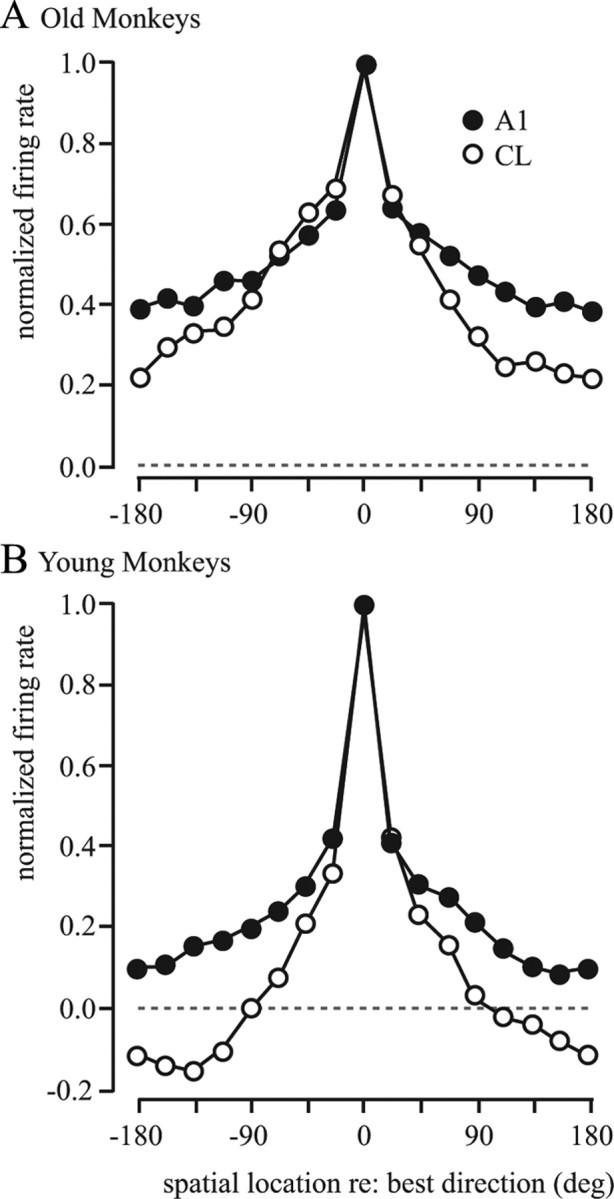
A, B, Normalized population tuning curves comparing A1 and CL in old and young monkeys. Data from Figure 11 are replotted here to directly compare the tuning of the population of A1 neurons (filled circles) with CL neurons (unfilled circles) in old (A) and young (B) monkeys. There is a much greater sharpening of tuning in the young monkeys compared with the older monkeys. Points below the dashed line indicate inhibition.
Potential effects of behavioral task in young monkeys
We have reported results from two young monkeys that were performing a simple lever task (monkeys F and L) with one (monkey G) that listened to the same stimuli and received the same rewards, but was not required to perform the task, similar to the conditions for the older monkeys. Comparisons between the neurons in A1 in monkey G were not statistically significantly different from the responses measured in the other two young monkeys, as stated above. However, task-dependent effects may be greater in belt cortical areas compared with primary cortical areas. This was addressed by comparing the same metrics in the two belt areas adjacent to area CL, the CM and ML fields, where single neuron data were collected from all three animals. The comparisons in CM were based on 148 versus 71 neurons in monkeys L and F versus monkey G, respectively, and the comparisons in ML were based on 60 versus 56 neurons, respectively (Woods et al., 2006; their Table 1). As was seen for the A1 neurons, there was no difference between these monkeys in any of the metrics described in this report (all p values >0.05). We conclude that the subtle differences in the tasks performed by these groups of monkeys are unlikely to influence these response properties in a manner restricted only to cortical area CL.
Discussion
These results demonstrate that there are two main affects of natural aging on auditory cortical neurons that are independent of hearing loss. The first is an increase in both spontaneous and driven activity, but without a change in the signal-to-noise ratio. The second is a decrease in spatial tuning in area CL, and the spatial tuning was by most metrics no different from that seen for A1 neurons in the aged monkeys. This indicates that one of the main central effects of normal aging is the degradation in the transmission and processing of information from primary auditory cortex to neurons in the lateral belt.
Similarities between young and old monkeys
The similarities between the young and aged monkeys in this report include the audiograms, which were all well within the normal range for this genus (Jackson et al., 1999; Kusmierek and Rauschecker, 2009). The distribution of characteristic frequency of A1 and CL neurons was also similar, and although there were slight differences in the neuronal thresholds, they were all within ∼10 dB of those distributions seen in younger animals. Further, the best location and the incidences of responsive and spatially tuned neurons were all similar between the young and aged monkeys. All of these findings strongly indicate the differences seen between the aged and younger monkeys are primarily due to aging and are unlikely to be due to other factors such as peripheral damage or cognitive factors.
Differences in spontaneous and driven activity
The increases in neuronal activity in aged monkeys reported here are consistent with a release from inhibition due to a decrease in GABA effectiveness seen throughout the ascending auditory pathway (Caspary et al., 1995, 1999; Walton et al., 1998, 2002; Kazee and West, 1999; Ling et al., 2005). Physiological studies in the cochlear nucleus (Caspary et al., 2005, 2006) and inferior colliculus (Shadduck Palombi et al., 2001; Palombi and Caspary, 1996) have also shown increased activity, again presumably due to the decreased GABAergic inhibition. To our knowledge, only one other cortical study noted increased activity rates in A1 (Hughes et al., 2009), whereas two others did not (Mendelson and Ricketts, 2001; Turner et al., 2005), with all three studies in anesthetized rats. Studies in primate visual cortex have noted a similar increase in activity (Wang et al., 2005; Liang et al., 2008; Yang et al., 2008) but a decreased SNR. The differences between these studies and ours may be due in part to the effectiveness of the stimuli, as well as the use of anesthesia. However, the SNR we measured based on spatial tuning is consistent with the results from visual studies. It should be stressed that this increased activity level is not consistent with a general deterioration of cortical function, as the proportion of neurons with statistically significant responses and spatial tuning were similar if not better in the aged animals compared with the younger animals.
Differences in spatial tuning
Although there was no difference in the distribution of several different metrics of spatial tuning of A1 neurons, we found that CL neurons had considerably sharper tuning in young monkeys compared with older animals. Much of this is due to the increased spontaneous activity in aged monkeys, which influences the tuning index and vector strength metrics. This is akin to adding noise to a system and thus the resolution of acoustic space is compromised. When the spontaneous activity is accounted for, as in the population tuning shown in Figures 11 and 12, the deficits do remain but are not as dramatic; i.e., there is an increase in spatial tuning from A1 to CL neurons. How the nervous system could account for this change in spontaneous activity, and thus the noise introduced in the system, remains to be revealed.
This lack of spatial tuning sharpening would presumably give rise to the spatial processing deficits seen in geriatric humans (Brown, 1984; Kubo et al., 1998; Abel et al., 2000; Dubno et al., 2008, Marrone et al., 2008). A similar result has been observed in visual cortex where decreases in direction tuning are seen in areas V2 and MT compared with V1 in young and geriatric animals (Wang et al., 2005; Liang et al., 2008; Yang et al., 2008). This deficit in spatial tuning could underlie part of a major complaint of geriatric patients, the inability to understand speech in noisy environments. Poor sound localization performance would result in more difficulty segregating different sound sources, and therefore analysis of a particular source, the speaker of interest, would suffer (Kubo et al., 1998; Dubno et al., 2008; Morrell et al., 1996, Marrone et al., 2008). Presumably, there is a similar deficit in the processing of nonspatial attributes of a sensory signal from the core to the belt cortical areas, which would further degrade the intelligibility of the speech, and therefore ultimately lead to the deficits revealed in a variety of laboratory tests (Gordon-Salant and Fitzgibbons, 1993, 2001; Morrell et al., 1996; Phillips et al., 2000; Snell and Frisina, 2000; Barsz et al., 2002; Snell et al., 2002).
Task influences on cortical responses
We compared the responses of cortical neurons from two monkeys that were performing a simple lever task and three monkeys (two aged) that did not perform the task but were presented with the same acoustic stimuli and rewards. There were no differences between the younger monkeys as a function of task performance in any of the metrics described in this report. This indicates to us that the task requirements imposed here did not influence the results, presumably as all of the monkeys were equally alert and listening to the acoustic stimuli. Attentional effects have been described in macaque monkey and other species' auditory cortex (Benson et al., 1981; Fritz et al., 2005, 2007; Scott et al., 2007; Otazu et al., 2009) and indicate that attention does not consistently influence auditory cortical neurons in the same manner, as opposed to what is commonly seen in the macaque visual cortex (Desimone and Duncan, 1995). We also saw an increase in driven activity in our aged animals, which would be predicted if the animals were attending to the stimulus. It may be that belt cortical areas are more strongly affected by attention than primary areas. It is unfortunate that CL neurons were not recorded from monkey G. However, the responses in the adjacent belt fields, ML and CM, did not show any difference in this animal compared with the other young monkeys, suggesting that lateral belt fields are not more sensitive to these task requirements.
Degradation of hierarchical cortical processing
Although it is well known that aged humans suffer auditory temporal processing deficits (Snell, 1997), it has been unclear how these deficits are generated and propagated throughout the cortical hierarchy. Several studies have noted that there is a decrease in temporal fidelity in aged neurons, and this is presumed to be due in large part to changes in myelination and therefore conduction velocities, ultimately giving rise to degraded temporal summation (Ibanez et al., 2003; Luebke et al., 2010). This predicts that the transmission of information from one CNS station to the next would be jeopardized, and these effects would be expected to be greater between stations where there is considerable neuroanatomical divergence, and also areas that would normally show the greatest degree of neuroplasticity. This would create a greater need to filter the incoming inputs into those areas that can most effectively drive the recipient neuron. The primate auditory cortex is a good model system to investigate this hypothesis, as A1 and the caudal and medial lateral belt areas are serially connected (Rauschecker et al., 1997; Kaas and Hackett, 2000; Hackett et al., 2001) and there is a clear increase in spatial tuning of neurons from area A1 to CL (Recanzone et al., 2000b; Woods et al., 2006). This increase can account for sound localization ability in the contralateral hemifield (Miller and Recanzone, 2009), and the auditory cortex is necessary for both sound localization and processing complex acoustic patterns such as vocalizations (Heffner and Heffner, 1989, 1990; Harrington et al., 2001). The results of this study show that there is a deficit in the refinement or extraction of particular stimulus features, in this case acoustic space, between hierarchically connected cortical areas. If this is a common cortical phenomenon, regardless of the cause, this degradation would only be exacerbated at higher and higher cortical areas, leading to increasing deficits of more complex stimulus processing and reduced plasticity capacity (and consequent changes in perceptual abilities) (Recanzone et al., 1992, 1993). Such a mechanism could be the major contributor to the general cognitive decline seen in many geriatric patients.
Footnotes
This work was supported by National Institutes of Health Grants DC 02371, DC 00442, AG 034137, and AG 0234371.We thank Lee Miller for comments on previous versions of this manuscript, and Rhonda Oates-O'Brien and Guy Martin for expert animal care.
References
- Abel SM, Giguère C, Consoli A, Papsin BC. The effect of aging on horizontal plane sound localization. J Acoust Soc Am. 2000;108:743–752. doi: 10.1121/1.429607. [DOI] [PubMed] [Google Scholar]
- Baker JF, Petersen SE, Newsome WT, Allman JM. Visual response properties of neurons in four extrastriate visual areas of the owl monkey (Aotus trivirgatus): a quantitative comparison of the medial, dorsomedial, dorsolateral, and middle temporal areas. J Neurophysiol. 1981;45:397–416. doi: 10.1152/jn.1981.45.3.397. [DOI] [PubMed] [Google Scholar]
- Barsz K, Ison JR, Snell KB, Walton JP. Behavioral and neural measures of auditory temporal acuity in aging humans and mice. Neurobiol Aging. 2002;23:565–578. doi: 10.1016/s0197-4580(02)00008-8. [DOI] [PubMed] [Google Scholar]
- Benson DA, Hienz RD, Goldstein MH., Jr Single-unit activity in the auditory cortex of monkeys actively localizing sound sources: spatial tuning and behavioral dependencies. Brain Res. 1981;219:249–267. doi: 10.1016/0006-8993(81)90290-0. [DOI] [PubMed] [Google Scholar]
- Brown CH. Directional hearing in aging rats. Exp Aging Res. 1984;10:35–38. doi: 10.1080/03610738408258539. [DOI] [PubMed] [Google Scholar]
- Caspary DM, Milbrandt JC, Helfert RH. Central auditory aging: GABA changes in the inferior colliculus. Exp Gerontol. 1995;30:349–360. doi: 10.1016/0531-5565(94)00052-5. [DOI] [PubMed] [Google Scholar]
- Caspary DM, Holder TM, Hughes LF, Milbrandt JC, McKernan RM, Naritoku DK. Age-related changes in GABA(A) receptor subunit composition and function in rat auditory system. Neuroscience. 1999;93:307–312. doi: 10.1016/s0306-4522(99)00121-9. [DOI] [PubMed] [Google Scholar]
- Caspary DM, Schatteman TA, Hughes LF. Age-related changes in the inhibitory response properties of dorsal cochlear nucleus output neurons: role of inhibitory inputs. J Neurosci. 2005;25:10952–10959. doi: 10.1523/JNEUROSCI.2451-05.2005. [DOI] [PMC free article] [PubMed] [Google Scholar]
- Caspary DM, Hughes LF, Schatteman TA, Turner JG. Age-related changes in the response properties of cartwheel cells in rat dorsal cochlear nucleus. Hear Res. 2006;216–217:207–215. doi: 10.1016/j.heares.2006.03.005. [DOI] [PubMed] [Google Scholar]
- Caspary DM, Ling L, Turner JG, Hughes LF. Inhibitory neurotransmission, plasticity and aging in the mammalian central auditory system. J Exp Biol. 2008;211:1781–1791. doi: 10.1242/jeb.013581. [DOI] [PMC free article] [PubMed] [Google Scholar]
- Desimone R, Duncan J. Neural mechanisms of selective visual attention. Annu Rev Neurosci. 1995;18:193–222. doi: 10.1146/annurev.ne.18.030195.001205. [DOI] [PubMed] [Google Scholar]
- Dubno JR, Ahlstrom JB, Horwitz AR. Binaural advantage for younger and older adults with normal hearing. J Speech Lang Hear Res. 2008;51:539–556. doi: 10.1044/1092-4388(2008/039). [DOI] [PubMed] [Google Scholar]
- Fritz J, Elhilali M, Shamma S. Active listening: task-dependent plasticity of spectrotemporal receptive fields in primary auditory cortex. Hear Res. 2005;206:159–176. doi: 10.1016/j.heares.2005.01.015. [DOI] [PubMed] [Google Scholar]
- Fritz JB, Elhilali M, David SV, Shamma SA. Auditory attention: focusing in the searchlight on sound. Curr Opin Neurobiol. 2007;17:437–455. doi: 10.1016/j.conb.2007.07.011. [DOI] [PubMed] [Google Scholar]
- Goldberg JM, Brown PB. Response of binaural neurons of dog superior olivary complex to dichotic tonal stimuli: some physiological mechanisms of sound localization. J Neurophysiol. 1969;32:613–636. doi: 10.1152/jn.1969.32.4.613. [DOI] [PubMed] [Google Scholar]
- Gordon-Salant S, Fitzgibbons PJ. Temporal factors and speech recognition performance in young and elderly listeners. J Speech Hear Res. 1993;36:1276–1285. doi: 10.1044/jshr.3606.1276. [DOI] [PubMed] [Google Scholar]
- Gordon-Salant S, Fitzgibbons PJ. Sources of age-related recognition difficulty for time-compressed speech. J Speech Lang Hear Res. 2001;44:709–719. doi: 10.1044/1092-4388(2001/056). [DOI] [PubMed] [Google Scholar]
- Hackett TA, Preuss TM, Kaas JH. Architectonic identification of the core region in auditory cortex of macaques, chimpanzees and humans. J Comp Neurol. 2001;441:197–222. doi: 10.1002/cne.1407. [DOI] [PubMed] [Google Scholar]
- Harrington IA, Heffner RS, Heffner HE. An investigation of sensory deficits underlying the aphasia-like behavior of macaques with auditory cortex lesions. Neuroreport. 2001;12:1217–1221. doi: 10.1097/00001756-200105080-00032. [DOI] [PubMed] [Google Scholar]
- Heffner HE, Heffner RS. Effect of restricted cortical lesions on absolute thresholds and aphasia-like deficits in Japanese macaques. Behav Neurosci. 1989;103:158–169. doi: 10.1037//0735-7044.103.1.158. [DOI] [PubMed] [Google Scholar]
- Heffner HE, Heffner RS. Effect of bilateral auditory cortex lesions on sound localization in Japanese macaques. J Neurophysiol. 1990;64:915–931. doi: 10.1152/jn.1990.64.3.915. [DOI] [PubMed] [Google Scholar]
- Hughes LF, Turner JG, Parrish JL, Caspary DM. Processing of broadband stimuli across A1 layers in young and aged rats. Hear Res. 2010;264:79–85. doi: 10.1016/j.heares.2009.09.005. [DOI] [PMC free article] [PubMed] [Google Scholar]
- Ibanez C, Shields SA, El-Etr M, Leonelli E, Magnaghi V, Li WW, Sim FJ, Baulieu EE, Melcangi RC, Schumacher M, Franklin RJ. Steriod and the reversal of age-associated changes in myelination and remyelintion. Prog Neurobiol. 2003;71:49–56. doi: 10.1016/j.pneurobio.2003.09.002. [DOI] [PubMed] [Google Scholar]
- Jackson LL, Heffner RS, Heffner HE. Free-field audiogram of the Japanese macaque (Macaca fuscata) J Acoust Soc Am. 1999;106:3017–3023. doi: 10.1121/1.428121. [DOI] [PubMed] [Google Scholar]
- Kaas JH, Hackett TA. Subdivisions of auditory cortex and processing streams in primates. Proc Natl Acad Sci U S A. 2000;97:11793–11799. doi: 10.1073/pnas.97.22.11793. [DOI] [PMC free article] [PubMed] [Google Scholar]
- Kazee AM, West NR. Preservation of synapses on principal cells of the central nucleus of the inferior colliculus with aging in the CBA mouse. Hear Res. 1999;133:98–106. doi: 10.1016/s0378-5955(99)00058-1. [DOI] [PubMed] [Google Scholar]
- Kubo T, Sakashita T, Kusuki M, Kyunai K, Ueno K, Hikawa C, Wada T, Shibata T, Nakai Y. Sound lateralization and speech discrimination in patients with sensorineural hearing loss. Acta Otolaryngol Suppl. 1998;538:63–69. [PubMed] [Google Scholar]
- Kusmierek P, Rauschecker JP. Functional specialization of medial auditory belt cortex in the alert rhesus monkey. J Neurophysiol. 2009;102:1606–1622. doi: 10.1152/jn.00167.2009. [DOI] [PMC free article] [PubMed] [Google Scholar]
- Liang Z, Yang Y, Li G, Zhang J, Wang Y, Zhou Y, Leventhal AG. Aging effects the direction selectivity of MT cells in rhesus monkeys. Neuriobiol Aging. 2010;31:863–873. doi: 10.1016/j.neurobiolaging.2008.06.013. [DOI] [PubMed] [Google Scholar]
- Ling LL, Hughes LF, Caspary DM. Age-related loss of the GABA synthetic enzyme gluamic acid decarboxylas in rat primary auditory cortex. Neuroscience. 2005;132:1103–1113. doi: 10.1016/j.neuroscience.2004.12.043. [DOI] [PubMed] [Google Scholar]
- Luebke J, Barbas H, Peters A. Effects of normal aging on prefrontal area 46 in the rhesus monkey. Brain Res Rev. 2010;62:212–232. doi: 10.1016/j.brainresrev.2009.12.002. [DOI] [PMC free article] [PubMed] [Google Scholar]
- Marrone N, Mason CR, Kidd G., Jr The effect of hearing loss and age of the benefit of spatial separation between multiple talkers in reverberant rooms. J Acoust Soc Am. 2008;124:3064–3075. doi: 10.1121/1.2980441. [DOI] [PMC free article] [PubMed] [Google Scholar]
- Mendelson JR, Ricketts C. Age-related temporal processing speed deterioration in auditory cortex. Hear Res. 2001;158:84–94. doi: 10.1016/s0378-5955(01)00294-5. [DOI] [PubMed] [Google Scholar]
- Miller LM, Recanzone GH. Populations of auditory cortical neurons can accurately encode acoustic space across stimulus intensity. Proc Natl Acad Sci U S A. 2009;106:5931–5935. doi: 10.1073/pnas.0901023106. [DOI] [PMC free article] [PubMed] [Google Scholar]
- Morrell CH, Gordon-Salant S, Pearson JD, Brant LJ, Fozard JL. Age- and gender-specific reference ranges for hearing level and longitudinal changes in hearing level. J Acoust Soc Am. 1996;100:1949–1967. doi: 10.1121/1.417906. [DOI] [PubMed] [Google Scholar]
- Ohlemiller KK. Age-related hearing loss: the status of Schuknecht's typology. Curr Opin Otolaryngol Head Neck Surg. 2004;12:439–443. doi: 10.1097/01.moo.0000134450.99615.22. [DOI] [PubMed] [Google Scholar]
- Otazu GH, Tai LH, Yang Y, Zador AM. Engaging in an auditory task suppresses responses in auditory cortex. Nat Neurosci. 2009;12:646–654. doi: 10.1038/nn.2306. [DOI] [PMC free article] [PubMed] [Google Scholar]
- Palombi PS, Caspary DM. Physiology of the aged Fischer 344 rat inferior colliculus: responses to contralateral monaural stimulation. J Neurophysiol. 1996;76:3114–3125. doi: 10.1152/jn.1996.76.5.3114. [DOI] [PubMed] [Google Scholar]
- Phillips SL, Gordon-Salant S, Fitzgibbons PJ, Yeni-Komshian G. Frequency and temporal resolution elderly listeners with good and poor work recognition. J Speech Lang Hear Res. 2000;43:217–228. doi: 10.1044/jslhr.4301.217. [DOI] [PubMed] [Google Scholar]
- Rauschecker JP, Tian B. Mechanisms and streams for processing of “what” and “where” in auditory cortex. Proc Natl Acad Sci U S A. 2000;97:11800–11806. doi: 10.1073/pnas.97.22.11800. [DOI] [PMC free article] [PubMed] [Google Scholar]
- Rauschecker JP, Tian B, Pons T, Mishkin M. Serial and parallel processing in rhesus monkey auditory cortex. J Comp Neurol. 1997;382:89–103. [PubMed] [Google Scholar]
- Recanzone GH, Merzenich MM, Schreiner CE. Changes in the distributed temporal response properties of SI cortical neurons reflect improvements in performance on a temporally based tactile discrimination task. J Neurophysiol. 1992;67:1071–1091. doi: 10.1152/jn.1992.67.5.1071. [DOI] [PubMed] [Google Scholar]
- Recanzone GH, Schreiner CE, Merzenich MM. Plasticity in the frequency representation of primary auditory cortex following discrimination training in adult owl monkeys. J Neurosci. 1993;13:87–103. doi: 10.1523/JNEUROSCI.13-01-00087.1993. [DOI] [PMC free article] [PubMed] [Google Scholar]
- Recanzone GH, Wurtz RH, Schwarz U. Responses of MT and MST neurons to one and two moving objects in the receptive field. J Neurophysiol. 1997;78:2904–2915. doi: 10.1152/jn.1997.78.6.2904. [DOI] [PubMed] [Google Scholar]
- Recanzone GH, Guard DC, Phan ML. Frequency and intensity response properties of single neurons in the auditory cortex of the behaving macaque monkey. J Neurophysiol. 2000a;83:2315–2331. doi: 10.1152/jn.2000.83.4.2315. [DOI] [PubMed] [Google Scholar]
- Recanzone GH, Guard DC, Phan ML, Su TK. Correlation between the activity of single auditory cortical neurons and sound localization behavior in the macaque monkey. J Neurophysiol. 2000b;83:2723–2739. doi: 10.1152/jn.2000.83.5.2723. [DOI] [PubMed] [Google Scholar]
- Schuknecht HF. Further observations on the pathology of presbycusis. Arch Otolaryngol. 1964;80:369–382. doi: 10.1001/archotol.1964.00750040381003. [DOI] [PubMed] [Google Scholar]
- Scott BH, Malone BJ, Semple MN. Effect of behavioral context on representation of a spatial cue in core auditory cortex of awake macaques. J Neurosci. 2007;27:6489–6499. doi: 10.1523/JNEUROSCI.0016-07.2007. [DOI] [PMC free article] [PubMed] [Google Scholar]
- Shadduck Palombi P, Backoff PM, Caspary DM. Responses of young and aged rat inferior colliculus neurons to sinusoidally amplitude modulated stimuli. Hear Res. 2001;153:174–180. doi: 10.1016/s0378-5955(00)00264-1. [DOI] [PubMed] [Google Scholar]
- Snell KB. Age-related changes in temporal gap detection. J Acoust Soc Am. 1997;101:2214–2220. doi: 10.1121/1.418205. [DOI] [PubMed] [Google Scholar]
- Snell KB, Frisina DR. Relationships among age-related differences in gap detection and word recognition. J Acoust Soc Am. 2000;107:1615–1626. doi: 10.1121/1.428446. [DOI] [PubMed] [Google Scholar]
- Snell KB, Mapes FM, Hickman ED, Frisina DR. Word recognition in competing babble and the effects of age, temporal processing, and absolute sensitivity. J Acoust Soc Am. 2002;112:720–727. doi: 10.1121/1.1487841. [DOI] [PubMed] [Google Scholar]
- Turner JG, Hughes LF, Caspary DM. Affect of aging on receptive fields in rat primary auditory cortex layer V neurons. J Neurophysiol. 2005;94:2738–2747. doi: 10.1152/jn.00362.2005. [DOI] [PubMed] [Google Scholar]
- Walton JP, Frisina RD, O'Neill WE. Age-related alteration in processing of temporal sound features in the auditory midbrain of the CBA mouse. J Neurosci. 1998;18:2764–2776. doi: 10.1523/JNEUROSCI.18-07-02764.1998. [DOI] [PMC free article] [PubMed] [Google Scholar]
- Walton JP, Simon H, Frisina RD. Age-related alterations in the neural coding of envelope periodicities. J Neurophysiol. 2002;88:565–578. doi: 10.1152/jn.2002.88.2.565. [DOI] [PubMed] [Google Scholar]
- Wang Y, Zhou Y, Ma Y, Leventhal AG. Degradation of signal timing in cortical areas V1 and V2 of senescent monkeys. Cereb Cortex. 2005;15:403–408. doi: 10.1093/cercor/bhh143. [DOI] [PubMed] [Google Scholar]
- Woods TM, Lopez SE, Long JH, Rahman JE, Recanzone GH. Effects of stimulus azimuth and intensity on the single-neuron activity in the auditory cortex of the alert macaque monkey. J Neurophysiol. 2006;96:3323–3337. doi: 10.1152/jn.00392.2006. [DOI] [PubMed] [Google Scholar]
- Yang Y, Liang Z, Li G, Wang Y, Zhou Y, Leventhal AG. Aging effects contrast response functions and adaptation of middle temporal visual area neurons in rhesus monkeys. Neuroscience. 2008;156:748–757. doi: 10.1016/j.neuroscience.2008.08.007. [DOI] [PubMed] [Google Scholar]