Abstract
The use of porous polymer monoliths functionalized with silver nanoparticles is introduced in this work for high-sensitivity surface-enhanced Raman scattering (SERS) detection. Preparation of the SERS detection elements is a simple process comprising the synthesis of a discrete polymer monolith section within a silica capillary, followed by physically trapping silver nanoparticle aggregates within the monolith matrix. A SERS detection limit of 220 fmol for Rhodamine 6G (R6G) is demonstrated, with excellent signal stability over a 24 h period. The capability of the SERS-active monolith for label-free detection of biomolecules was demonstrated by measurements of bradykinin and cyctochrome c. The SERS-active monoliths can be readily integrated into miniaturized micro-total-analysis systems for on-line and label-free detection for a variety of biosensing, bioanalytical, and biomedical applications.
INTRODUCTION
Surface-enhanced Raman scattering is a highly sensitive vibrational spectroscopic technique relying on the interactions between analyte molecules and metallic nanostructures within 10–100 nm length scales. These interactions are well known to yield tremendous enhancements in Raman scattering efficiency, and thus detection senstivity.1,2 When employing resonant excitation with wavelengths close to the electronic vibration levels of analyte molecules, extremely strong Raman scattering signals can be observed, allowing sensitivities down to the single molecule level without the use of labeling.3 Furthermore, unlike techniques such as Fourier-transform infrared spectroscopy (FTIR), SERS can provide information on the molecular structure of samples within aqueous environments without incurring strong interference from water molecules. Due to these benefits, the application of SERS detection to bioanalysis, clinical diagnostics, and homeland security has achieved rapid growth in recent years.4,5
The preparation of nanostructured SERS-active materials is commonly performed using a variety of techniques. The earliest SERS-active material preparation methods relied on roughening of a metal electrode surface using electrochemical oxidation/reduction reactions.6–9 Chemical etching has also been employed to prepare SERS-active metal substrates with roughened surfaces.10 SERS-active metallic materials prepared using surface roughening techniques tend to present irregular and irrepropducible nanometer-sized surface structures, so that the resulting Raman scattering enhancement is difficult to repeat. SERS-active materials with more stable performance can be prepared by fabricating highly organized nanostructures on planar substrates using nanoparticle self-assembly11–13 or lithography14–16. This approach can be used for non-metallic surfaces by depositing a thin layer of metal on top of the substrates following nanostructures formation. A fundamental limitation of these planar metallic SERS-active surfaces is that analyte molecules must rely on slow diffusion from the bulk sulution to the surface to facilitate molecule-metal interactions, an essential prerequisite for SERS detection. Thus long detection times are required to achieve reasonable sensitivities for planar SERS sensors, which is unfavorable for on-line real-time analysis. At the same time, the effective surface area of planar nanoparticle-presenting substrates is limited.
A simpler and widely employed approach to SERS detection is to directly mix metal colloids with target analytes.17–19 The metal nanoparticle aggregates containing many “hot spots” suspended in solution can present a large total surface area, thus facilitating effective interactions with analytes and generation of strong Raman scattering emission. In comparison to SERS sensing using nanostructured metal films, which are inherently planar detectors, this approach allows direct probing of analytes within a defined volume of solution, thereby providing higher sensitivity. However, metallic colloid aggregates are inherently unstable and tend to precipitate from solution, resulting in loss of SERS signals. The addition of surfactants or hydrophilic polymers can stabilize the colloids, but these reagents are known to interfere with the SERS signals of target analytes.20,21 Furthermore, in the absence of active mixing, interactions between suspended colloids and analytes still rely on relatively slow diffusive transport within the solution. It would thus be advantageous to develop a SERS detection element capable of providing high sensitivity through the use of volumetric detection together with the excellent stability of planar nanostructured surfaces, while simultaneously offering enhanced analyte-metal interactions for rapid on-line detection
Polymer monoliths are highly porous, 3D-structured organic materials prepared from monomers with unsaturated vinyl groups.22 Typical monoliths have micrometer to nanometer-sized tortuous fluidic channel networks defined by interconnected micrometer-scale spheres, a unique feature that allows monoliths to support convection flow for rapid mass transfer while offering short characteristic diffusion lengths and large surface areas for enhanced analyte-monolith interactions. Monoliths can be synthesized by a range of polymerization techniques, with heat or UV initiated free radical polymerization being the most commonly used methods. An advantage of UV polymerization is that monoliths with well defined geometries at specific locations can be obtained by simple shadow masking during UV exposure. Key properties of the resulting monoliths, in particular porosity, surface area and flow resistance, may be tuned by adjusting the relative concentrations of monomers, organic solvents and free radical initiators in the reaction mixture. Monoliths are traditionally used as stationary phases in liquid chromatography and as solid-phase extraction media for the separation and purification of biomolecules.23–25 The use of monoliths has also been extended to a range of microfluidic applications including proteolytic bioreactors,26 mixers,27 valves,28 solid-phase extraction elements,29 and electrospray emitters for mass spectrometry.30 More recently, we demonstrated the use of polymer monoliths as volumetric biodetection elements, with the monoliths serving as a novel solid support for flow-through immunosensing.31
In this work, we employ porous polymer monoliths as SERS scaffolds for label-free detection of biomolecules. By embedding silver nanoclusters within the porous monolith, a three-dimensional microfluidic detection element is realized. In contrast to conventional planar SERS detectors, the monolith structure combines convective flow and short diffusion length scales to significantly reduce the time required for analyte molecules to reach the SERS-active surfaces. Furthermore, compared to colloidal solutions, the monolith concentrates the metal nanostructures and presents a tremendous amount of surface area, resulting in much higher interaction between analyte molecules and SERS-active sites.
To demonstrate the potential of porous monoliths as volumetric SERS-active substrates, we formed short polymer monoliths within silica capillaries by in-situ UV polymerization and immobilized aggregated silver nanoparticles (AgNP) within the monolith matrix. The physically-immobilized AgNP aggregates serve as the detection elements for sensitive SERS detection. The SERS activity of the AgNP-aggregate-immobilized monoliths was confirmed by measuring the Raman scattering signals for a variety of model analytes. Unlike SERS-active colloid solutions, Raman scattering enhancement due to interactions with the monolith detection elements was found to be highly stable without the use of additional stabilizer reagents, thus avoiding introduction of unwanted interferants. While the SERS-active monoliths are demonstrated using capillary flow cells in the present work, the technique can be readily adapted to realize integrated on-line volumetric SERS detection elements for microfluidic lab-on-a-chip systems, opening the door to integrated label-free detection for a range of applications including clinical diagnostics, environmental analysis, forensic analysis, and homeland security.
EXPERIMENTAL SECTION
Materials
Glycidyl methacrylate (GMA), butyl methacrylate (BMA), ethylene glycol dimethacrylate (EDMA), poly(ethylene glycol) diacrylate, (PEGDA, MW~258), 2,2’-dimethoxy-2-phenylacetophenone (DMPA), cyclohexanol, silver nitrate, citric acid, trimethoxysilylpropyl methacryalte (TPM), bradykinin and cytochrome c were purchased from Sigma-Aldrich. Rhodamine 590 Chloride, also known as Rhodamine 6G (R6G), was purchased from Exciton (Dayton, OH). Ethoxylated trimethylolpropane triacrylate (SR454) was received as a free sample from Sartomer (Warrington, PA). Polyimide coated silica capillary with (360 µm O.D. and 100 µm I.D.) was procured from Polymicro (Phoenix, AZ). HPLC grade water, tris(hydroxymethyl)aminomethane (TRIS), hydrochloric acid (HCl), methanol, ethanol and acetone were obtained from Thermo Fisher Scientific (Rockford, IL).
Preparation of SERS-active monoliths
Before monolith preparation, two sets of MicroTight fittings and unions (Upchurch Scientific, Oak Harbor, WA) were connected to both ends of a 5 cm long capillary, which was then rinsed with acetone, HPLC water, and 0.1 M HCl. The two unions were then capped with gauge plugs (Upchurch Scientific) to seal 0.1 M HCl solution in the capillary. The resulting capillary assembly was incubated at 105 °C for at least 12 h to condition the capillary surface. Before silane treatment, the HCl solution in the conditioned capillary was replaced with HPLC water and rinsed with ethanol. The polyimide coating of the conditioned silica capillary was then removed with a multi-purpose lighter and a 30% (v/v) TPM ethanol solution was sealed in the capillary. After 24 h, the TPM-treated capillary was again rinsed with ethanol and dried with nitrogen gas.
To synthesize a monolith section in a TPM-treated capillary section, a reaction solution containing 24% (w/w) GMA, 16% (w/w) SR454, 50% (w/w) cyclohexanol, 10% (w/w) methanol and 1% (w/w) DMPA was first loaded and sealed in the capillary section. The outer surface of the capillary was coated with a black liquid rubber coating (Plasti Dip International, Blaine, MN) except for a 3 mm long exposure window. The masked capillary was exposed to a UV source (PRX-1000; Tamarack Scientific, Corona, CA) with an incident power of 22.0 mW/cm2 for 300 s, allowing a monolith segment to form within the exposed capillary region. The monolith section was thoroughly rinsed with acetone then HPLC water before further use.
AgNPs were synthesized following a reduction process reported previously.17 The resulting stock AgNP solution possessed an estimated concentration on the order of 1 nM. To render the monolith sections SERS-active, the AgNP solution was diluted 3 fold with a 20 mM Tris-HCl solution (pH 8.2) to promote AgNP aggregation and then loaded into the monolith using a syringe pump (PHD 4400; Harvard Apparatus, Holliston, MA) at 2.5 µL/min for 60 min, followed by rinsing with DI water at 2 µL/min for 30 min before SERS measurements.
SERS measurement using AgNP-trapped monoliths
R6G aqueous solutions with concentrations of 33 nM, 100 nM, 333 nM, and 1 µM were prepared in 20 mM TRIS-HCl buffer for measurement of monolith SERS activity. In a typical experiment, a R6G solution was injected into a monolith capillary section at a flow rate of 2 µL/min for 6 min, followed by a quick rinsing with TRIS-HCl buffer. The capillary was then placed on the stage of a LabRAM HR-VIS Raman microscope system (Horiba Jobin-Yvon, Edison, NJ), the center of the capillary was brought into focus, and Raman scattering measurements from selected points along the SERS-active monolith were acquired. A 10×/N.A. 0.30 objective and a 633-nm He-Ne laser excitation source (~15 mW) were used in all measurements. The spectra within a Raman shift window between 500 cm−1 to 2000 cm−1 were recorded using a mounted CCD camera and integrated over a 2 s period.
Identical monolith preparation and experimental procedures and conditions were followed for measurements of native bradykinin and cytochrome c using SERS-active monolith elements. In these tests, the concentration of bradykinin and cytochrome c was 10 µM and 1 µM, respectively. For reference, SERS measurements of each analyte in a silver colloid were spotted onto a glass slide in 25 µL droplets and analyzed with the Raman system.
RESULTS AND DISCUSSION
Preparation of polymer monoliths for SERS detection
Because of their unique properties and capabilities for in-situ fabrication, acrylic porous polymer monoliths were chosen as 3D scaffolds to support SERS-active nanoparticle aggregates. In an initial effort to synthesize SERS-active monoliths, nanoparticles were harvested from AgNP stock solution using centrifugation (10,000 g, 2 min) and then dispersed in a monolith monomer solution before UV polymerization. While monoliths with homogeneously distributed AgNPs were obtained using this approach, as confirmed by scanning electron microscopy (data not shown), poor sensitivity toward the detection of R6G suggested a scarcity of SERS-active hot-spots within the monolith. Increasing the concentration of AgNPs in the monomer solution did not yield improved sensitivity. The poor performance of SERS detection elements formed using this polymerization approach is believed to be due to insufficient formation of suitable AgNP clusters within the monolith monomer solution, together with limited presentation of exposed AgNP clusters at the monolith surface.
To avoid this difficulty, we next investigated the direct loading of AgNP aggregates to pre-polymerized monoliths. This preparation strategy was first tested with a hydrophobic BMA-EDMA monolith, a common stationary phase for reversed-phase liquid chromatography. However, it was found that the aggregated AgNPs rapidly precipitated and tended to clog the monolith inlet during loading. The same problem was observed in our other preparation tests when using a hydrophilic monolith chemistry.32
In contrast, significantly improved results were achieved using a GMA-SR454 monolith, a hydrophilic composition with tri-vinyl crosslinkage. Unlike the prior monoliths with di-vinyl crosslinkage, no significant inlet clogging was observed for GMA-SR454 monoliths during AgNP aggregate loading. During the loading process, the back pressure did not exhibit a significant increase, further indicating that the monolith did not clog during convective transport of AgNP clusters through the monolith zone.
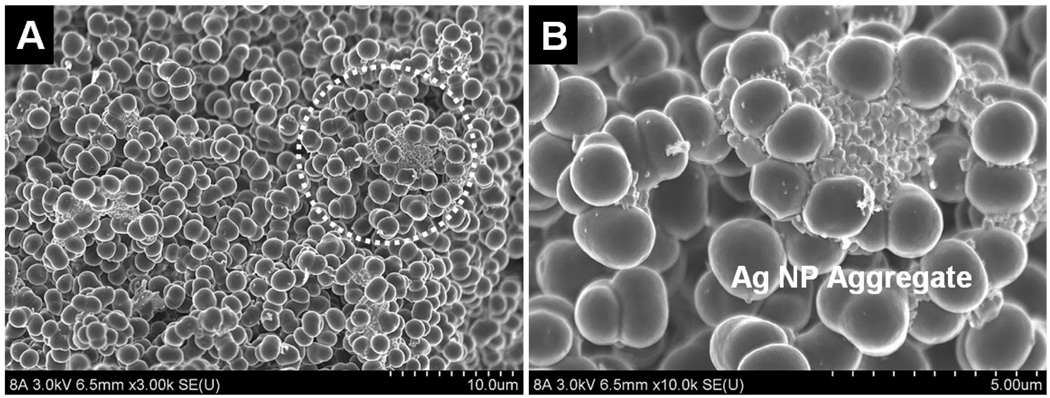
Using R6G dye, a well-studied molecular probe for Raman spectroscopy, strong SERS signals were readily detected along the full length of an AgNP-trapped GMA-SR454 monolith, implying that AgNP hot-spots were well-dispersed throughout the polymer network. The SEM images of a typical SERS-active monolith shown in Fig. 1 confirm the presence of AgNP aggregates in the polymer matrix. The images also reveal that the GMA-SR454 monolith is agglomerated from many large irregular particles fused by 3 or more single microglobules with an average diameter around 2 µm. The particular morphology of the monolith allows the AgNP aggregates to flow through the interstices and then be captured by the irregular particles along their tortuous flow path, thus forming stable SERS-active regions throughout the monolith matrix.
Fig. 1.
(A) SEM image of the central section of a GMA-SR454 monolith with physically-immobilized AgNP aggregates. (B) A trapped AgNP aggregate is shown in a magnified view of the circle area in (A). Aggregates generally comprise between around 5 and 200 individual ~50 nm diameter AgNPs, with the highest density of clusters appearing near the monolith head.
Characterization of the SERS-active monoliths
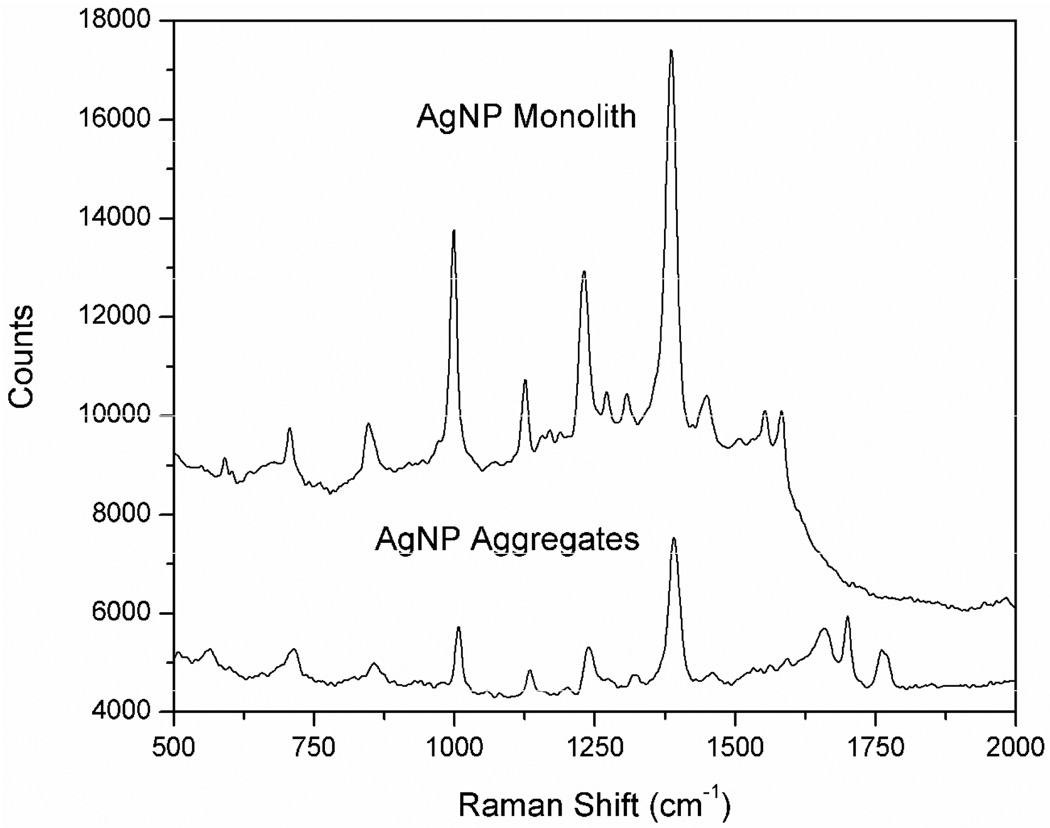
Before SERS detection using AgNP-trapped GMA-SR454 monolith sections, the background SERS signal of the monolith was first measured in a blank experiment using a 20-mM Tris-HCl buffer as a negative control. As shown in Fig. 2, multiple Raman bands were found between 500 cm−1 to 1600 cm−1 on the spectrum of the AgNP-trapped monolith. However, a further SERS measurement of an AgNP aggregate solution revealed that most major scattering signals of the SERS-active monolith were not caused by the polymer material. Since AgNPs were aggregated with Tris-HCl buffer before loading to a GMA-SR454 monolith, the clusters lodged in the polymer matrix are likely to contain cations including Tris. The additional bands appearing in the spectra reflect various vibration modes of those small cations co-aggregating with the AgNPs, and were subtracted from the measured signals for all spectra to avoid interference.
Fig. 2.
SERS signals detected from a AgNP-immobilized monolith in a blank experiment using 20-mM TRIS-HCl buffer (top) and from a bulk solution of AgNP aggregates (bottom). Signal integration time for the AgNP monolith is 2 s, compared to 25 s for the AgNP aggregate solution. The bands above 1600 cm−1 in the SERS spectrum of AgNP aggregates were caused by room light scattering.
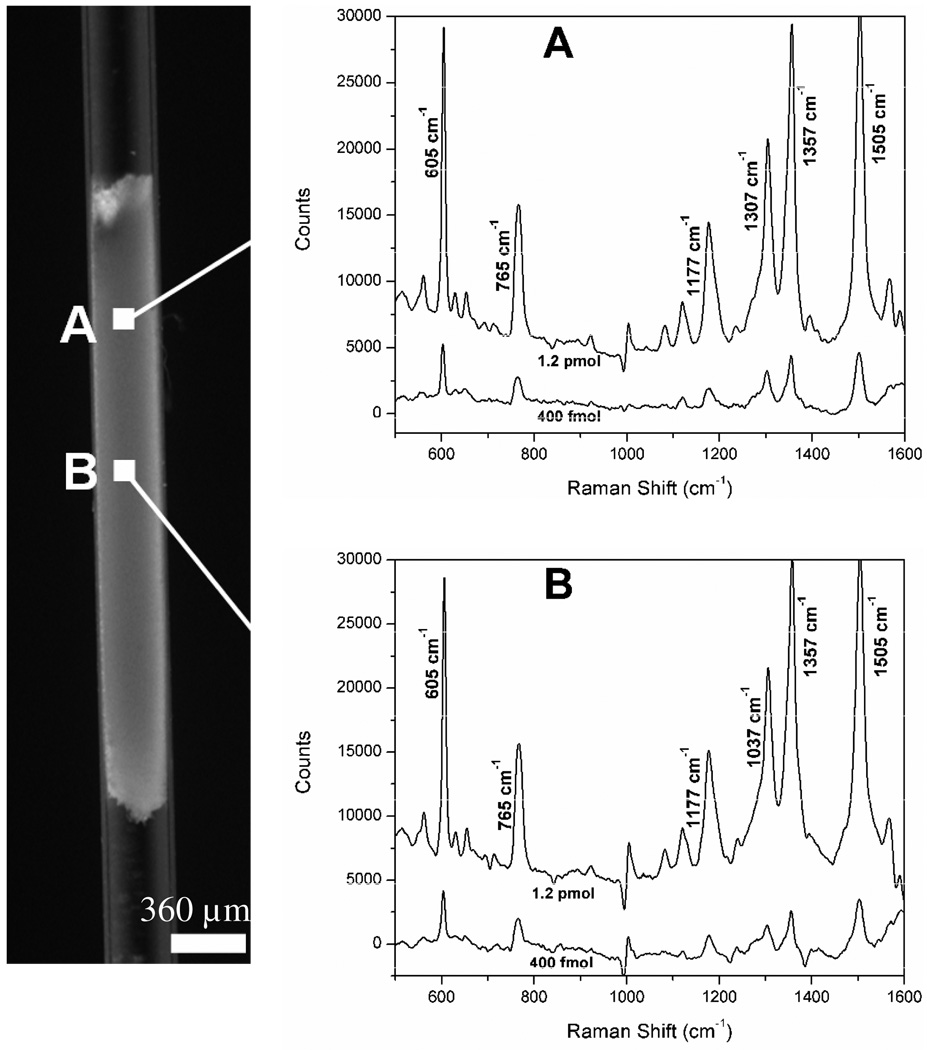
The performance of AgNP-trapped monoliths was evaluated using R6G. After loading R6G solutions to the monolith section, intense scattering signals were detected at multiple Raman shifts characteristic of R6G (Fig. 3), whereas no R6G Raman signals were detected on a native GMA-SR454 monolith section without AgNPs, even when a significantly higher R6G concentration was used. SERS spectra from two representative detection spots shown in Fig. 3 reveal that characteristic SERS bands of R6G (605, 765, 1177, 1307, 1357, 1505 cm−1) can be directly observed from the monolith section. The SERS signal intensity along the length of the monolith section is not uniform, with the strongest responses arising from the head to the central portion. This observation reveals that the density of the SERS-active nanoparticle aggregates is highest within the first half of the monolith, as expected for the case of convective loading, and suggests measurements should be performed proximal to the monolith head to maximize sensitivity.
Fig. 3.
SERS spectra of R6G dye using a SERS-active monolith element at different R6G loading concentrations (400 fmol and 1.2 pmol) and different locations A and B within the monolith zone. The distance between detection points A and B is approximately 500 µm. The spectrum integration time for all measurements is 2 s.
The coefficient of variation (CV) for multiple intensity measurements performed at different locations near the head of a nanoparticle-functionalized monolith, the most sensitive region of the detector, was below 10%, while the CV across different monolith sensing elements was below 20%. The variation is closely correlated with the irregularity of the microscopic morphology of a polymer monolith. Careful control of factors affecting the monolith synthesis, i.e., reaction time, temperature, radiation intensity and polymer monolith recipe, is critical to improve the homogeneity of the monolith morphology. Preparation through new synthesis routes33 is an especially promising approach to producing monoliths with homogeneous pore structures while maintaining or enhancing the desired pore dimensions and high sensor surface area. Another source of variation originates in the heterogeneous nature of the nanoparticle clusters prepared by in-solution aggregation, together with our use of convective loading of nanoparticles into the monolith. Alternative functionalization methods, such as in-situ preparation of nanoparticles on the monolith backbone,34 may offer benefits toward improved homogeneity of nanoparticle clusters.
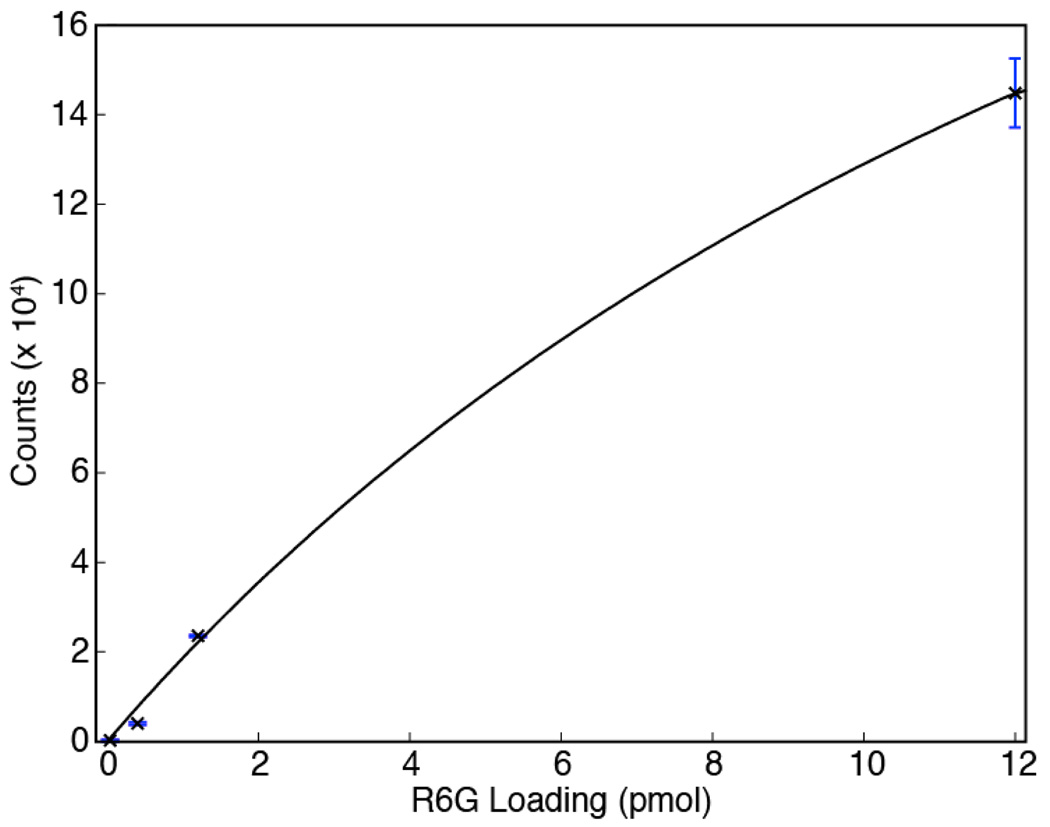
The limit of detection (LOD) for the SERS-active monoliths was evaluated by loading 12 µL volumes of sample solutions at varying R6G concentrations through a monolith, then measuring the intensity of the characteristic R6G band at 605 cm−1 at a position near the head of the monolith. For each data point, three measurements were performed at different locations within a single monolith. At low concentrations, a nearly linear relation is observed between the background-corrected SERS signal intensity and R6G loading (Fig. 4), resulting in an estimated LOD of 220 fmol defined by substituting 3 times of the standard deviation of the blank signal into the fitted linear equation. This LOD is superior to those obtained using regular silver nanoparticle aggregates35 or silver-coated nanostructured silicon wafers36,37 as SERS-active substrates. Fig. 4 further reveals that when R6G loading within the detection zone is greater than several pmol, the SERS signal intensity deviates from the linear relation observed at lower loading levels, a characteristic sign of depletion of the available binding sites on the monolith-immobilized AgNP clusters. To model this behavior, a Langmuir isotherm fit to the experimental data by nonlinear least squares regression is also shown in the figure.
Fig. 4.
Variation of SERS signal intensities at 605 cm−1 at different R6G loadings through a nanoparticle-functionalized monolith column. Each datum represents the average of measurements from 3 different detection spots at the head portion of a SERS active monolith. The estimated molar LOD is 220 fmol. The curve fit reflects a Langmuir isotherm fit to the experimental data by nonlinear least squares regression.
Extending the linear dynamic range of the monolith sensor can potentially be achieved by increasing the density of nanoparticle aggregates in the matrix. However, clogging of the monolith by the aggregates is likely to dictate an upper limit to this strategy. It is also notable that no significant SERS signal degradation was observed for at least 24 h on the SERS-active monoliths, presumably because the AgNP clusters are locked in a 3D framework and thus cannot further aggregate, a primary cause of SERS signal loss in colloid solutions.
Peptide and protein detection using SERS-active monoliths
Simple and sensitive methods to identify biomolecules in aqueous solutions without the need for labeling of the native molecules are critically needed for a range of fundamental life science studies and practical biotechnology and biosensing applications. Because of its high sensitivity, label-free detection capability, and compatibility with physiological environments, SERS is emerging as an indispensible analytical technique for detecting biologically important molecules in vitro or imaging their distribution in organisms in vivo.38–44 Noble metal colloid solutions are commonly used for SERS detection of biomolecules, but reproducible detection can be compromised by denaturation of biomolecules in the colloid solutions and inappropriate uncontrollable aggregation of nanoparticles.45 The SERS-active monoliths reported in this work offer potential to circumvent both of these problems.
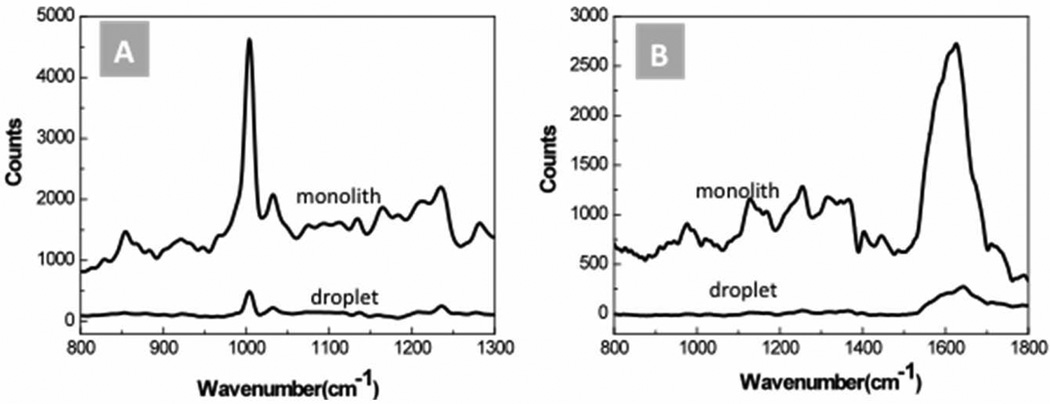
The ability of the AgNP-immobilized monoliths to detect label-free biomolecules was demonstrated by identifying from aqueous solutions the SERS responses of the peptide bradykinin and protein cytochrome c, two biomolecules which play important roles in the dilation of blood vessels46 and cell apoptosis47 respectively. As presented in Fig. 5, the spectral profiles of the peptides obtained using the monolith sensor elements show SERS spectral features similar to those observed using metal colloid solutions for these macromolecules.41,45,48 The multiple peaks appearing in the spectra indicate that the relatively large biomolecules adopt multiple orientations when interacting with the AgNP aggregates trapped in the monolith matrix, allowing the resonant features of different molecular bonds to be probed. It is notable that the peptide concentrations used in these tests were close to the reported detection limits for SERS measurement of label-free proteins, even while using an integration time at least 5 times shorter than those used in previous work.41,43,48 Interestingly, significant differences exists between the obtained SERS spectra and simple Raman spectra for native bradykinin49 and cytochrome c.50 These differences are expected, since in normal Raman spectroscopy experiments the sample molecules are freely dispersed in solution, while during SERS measurements the molecules are required to interact with metal nanoclusters, resulting in conformation changes and variations in molecular vibration modes.
Fig. 5.
Detection of label-free peptide and protein using a SERS-active monolith section. (A) 10 µM bradykinin and (B) 1 µM cytochrome c. Raman spectra measured from 25 µL droplets of the same sample solutions enhanced with Ag colloid are also shown for comparison. Multiple characteristic peaks are amplified using the monolith sensor.
CONCLUSIONS
Novel 3D-structured SERS sensor elements were fabricated by physically loading nanoparticle aggregates into the matrix of porous polymer monoliths. The hydrophilic GMA-SR454 monolith used in this work provides large pores enabling effective convective transport of nanoparticle clusters, together with an irregular trapping structure composed of fused microglobules which serve to capture AgNP aggregates throughout the monolith, thus forming a unique 3D scaffold decorated with many SERS-active hot-spots. The monoliths exhibit low background noise for SERS measurements, enabling sensitivities rivaling that of conventional SERS sensors based on noble metal colloid solutions, while providing significantly higher signal stability. Label-free measurements of selected biomolecules were performed by detecting the characteristic Raman shifts of native bradykinin and cytocrome c in aqueous solutions. Adjustments of experimental conditions, including optimization of AgNP cluster density in the monolith matrix, as well as the use of modifications of both the nanoparticle surfaces and monolith properties to enhance selected interactions between sample molecules and the sensor, are expected to yield further improvements in sensitivity and selectivity using the SERS-active monoliths. The photolithographic-based synthesis of SERS-active polymer monolith zones demonstrated here can provide facile integration of the sensing elements into a range of capillary and microfluidic devices for biomolecular detection.
ACKNOWLEDGEMENT
This research was supported by the National Institutes of Health (grants R01GM072512 and 5K25EB6011-5 and the University of Maryland Center for Energetic Concepts Development (CECD). The authors thank the Maryland Nanocenter and the Nano-Bio Systems Laboratory at the University of Maryland for providing access to the Horiba Jobin-Yvon spectrometer used in this work.
REFERENCES
- 1.Hering K, Cialla D, Ackermann K, Dorfer T, Moller R, Schneidewind H, Mattheis R, Fritzsche W, Rosch P, Popp J. Anal Bioanal Chem. 2008;390:113–124. doi: 10.1007/s00216-007-1667-3. [DOI] [PubMed] [Google Scholar]
- 2.Campion A, Kambhampati P. Chem. Soc. Rev. 1998;27:241–250. [Google Scholar]
- 3.Nie S, Emory SR. Science. 1997;275:1102–1106. doi: 10.1126/science.275.5303.1102. [DOI] [PubMed] [Google Scholar]
- 4.Kneipp J, Kneipp H, Kneipp K. Chem. Soc. Rev. 2008;37:1052–1060. doi: 10.1039/b708459p. [DOI] [PubMed] [Google Scholar]
- 5.Golightly RS, Doering WE, Natan MJ. Acs Nano. 2009;3:2859–2869. doi: 10.1021/nn9013593. [DOI] [PubMed] [Google Scholar]
- 6.Pemberton JE, Buck RP. Anal. Chem. 1981;53:2263–2267. [Google Scholar]
- 7.Beer KD, Tanner W, Garrell RL. J. Electroanal. Chem. 1989;258:313–325. [Google Scholar]
- 8.Loo BH. J. Phys. Chem. 1983;87:3003–3007. [Google Scholar]
- 9.Thierry D, Leygraf C. Surf. Sci. 1985;149:592–600. [Google Scholar]
- 10.Miller SK, Baiker A, Meier M, Wokaun A. J. Chem. Soc.-Faraday Trans. I. 1984;80 1305-&. [Google Scholar]
- 11.Moody RL, Vodinh T, Fletcher WH. Appl. Spectrosc. 1987;41:966–970. [Google Scholar]
- 12.Camden JP, Dieringer JA, Wang YM, Masiello DJ, Marks LD, Schatz GC, Van Duyne RP. J. Am. Chem. Soc. 2008;130:12616–12617. doi: 10.1021/ja8051427. [DOI] [PubMed] [Google Scholar]
- 13.Mulvihill M, Tao A, Benjauthrit K, Arnold J, Yang P. Angew. Chem., Int. Ed. 2008;47:6456–6460. doi: 10.1002/anie.200800776. [DOI] [PubMed] [Google Scholar]
- 14.Liao PF, Stern MB. Opt. Lett. 1982;7:483–485. doi: 10.1364/ol.7.000483. [DOI] [PubMed] [Google Scholar]
- 15.Green M, Liu FM. J. Phys. Chem. B. 2003;107:13015–13021. [Google Scholar]
- 16.Liu GL, Lee LP. Appl. Phys. Lett. 2005;87:074101–074103. [Google Scholar]
- 17.Lee PC, Meisel D. J. Phys. Chem. 1982;86:3391–3395. [Google Scholar]
- 18.Hildebrandt P, Stockburger M. J. Phys. Chem. 1984;88:5935–5944. [Google Scholar]
- 19.Pergolese B, Bigotto A, Muniz-Miranda M, Sbrana G. Appl. Spectrosc. 2005;59:194–199. doi: 10.1366/0003702053085034. [DOI] [PubMed] [Google Scholar]
- 20.Heard SM, Grieser F, Barraclough CG. Chem. Phys. Lett. 1983;95:154–158. [Google Scholar]
- 21.Lee PC, Meisel D. Chem. Phys. Lett. 1983;99:262–265. [Google Scholar]
- 22.Peters EC, Svec F, Frechet JMJ. Adv. Mater. 1999;11:1169–1181. [Google Scholar]
- 23.Guiochon G. J. Chromatogr. A. 2007;1168:101–168. doi: 10.1016/j.chroma.2007.05.090. [DOI] [PubMed] [Google Scholar]
- 24.Svec F. J. Sep. Sci. 2004;27:747–766. doi: 10.1002/jssc.200401721. [DOI] [PubMed] [Google Scholar]
- 25.Svec F, Huber CG. Anal. Chem. 2006;78:2100–2107. doi: 10.1021/ac069383v. [DOI] [PubMed] [Google Scholar]
- 26.Peterson DS, Rohr T, Svec F, Frechet JMJ. Anal. Chem. 2002;74:4081–4088. doi: 10.1021/ac020180q. [DOI] [PubMed] [Google Scholar]
- 27.Rohr T, Yu C, Davey MH, Svec F, Frechet JMJ. Electrophoresis. 2001;22:3959–3967. doi: 10.1002/1522-2683(200110)22:18<3959::AID-ELPS3959>3.0.CO;2-5. [DOI] [PubMed] [Google Scholar]
- 28.Chen GF, Svec F, Knapp DR. Lab on a Chip. 2008;8:1198–1204. doi: 10.1039/b803293a. [DOI] [PubMed] [Google Scholar]
- 29.Liu J, Chen C-F, Tsao C-W, Chang C-C, Chu C-C, DeVoe DL. Anal. Chem. 2009;81:2545–2554. doi: 10.1021/ac802359e. [DOI] [PMC free article] [PubMed] [Google Scholar]
- 30.Koerner T, Turck K, Brown L, Oleschuk RD. Anal. Chem. 2004;76:6456–6460. doi: 10.1021/ac049438y. [DOI] [PubMed] [Google Scholar]
- 31.Liu J, Chen C-F, Chang C-W, DeVoe DL. Biosens. Bioelectron. 2010 doi: 10.1016/j.bios.2010.06.007. [DOI] [PMC free article] [PubMed] [Google Scholar]
- 32.Li Y, Gu BH, Tolley HD, Lee ML. J. Chromatogr. A. 2009;1216:5525–5532. doi: 10.1016/j.chroma.2009.05.037. [DOI] [PubMed] [Google Scholar]
- 33.Svec F. J. Chromatogr. A. 2009;1217:902–924. doi: 10.1016/j.chroma.2009.09.073. [DOI] [PMC free article] [PubMed] [Google Scholar]
- 34.Xu Y, Cao Q, Svec F, Frchet JMJ. Anal. Chem. 2010;82:3352–3358. doi: 10.1021/ac1002646. [DOI] [PMC free article] [PubMed] [Google Scholar]
- 35.Culha M, Kahraman M, Tokman N, Turkoglu G. J. Phy. Chem. C. 2008;112:10338–10343. [Google Scholar]
- 36.Tan RZ, Agarwal A, Balasubramanian N, Kwong DL, Jiang Y, Widjaja E, Garland A. Sens. Actuators, A. 2007;139:36–41. [Google Scholar]
- 37.Lin HH, Mock J, Smith D, Gao T, Sailor MJ. Journal of Physical Chemistry B. 2004;108:11654–11659. [Google Scholar]
- 38.Sundararajan N, Mao DQ, Chan S, Koo TW, Su X, Sun L, Zhang JW, Sung KB, Yamakawa M, Gafken PR, Randolph T, McLerran D, Feng ZD, Berlin AA, Roth MB. Anal. Chem. 2006;78:3543–3550. doi: 10.1021/ac051525i. [DOI] [PubMed] [Google Scholar]
- 39.Driskell JD, Tripp RA. Chem. Commun. 2010;46:3298–3300. doi: 10.1039/c002059a. [DOI] [PubMed] [Google Scholar]
- 40.Habuchi S, Cotlet M, Gronheid R, Dirix G, Michiels J, Vanderleyden J, De Schryver FC, Hofkens J. J. Am. Chem. Soc. 2003;125:8446–8447. doi: 10.1021/ja0353311. [DOI] [PubMed] [Google Scholar]
- 41.Han XX, Huang GG, Zhao B, Ozaki Y. Anal. Chem. 2009;81:3329–3333. doi: 10.1021/ac900395x. [DOI] [PubMed] [Google Scholar]
- 42.Zavaleta CL, Smith BR, Walton I, Doering W, Davis G, Shojaei B, Natan MJ, Gambhir SS. Proc. Natl. Acad. Sci. U. S. A. 2009;106:13511–13516. doi: 10.1073/pnas.0813327106. [DOI] [PMC free article] [PubMed] [Google Scholar]
- 43.Kennedy DC, Hoop KA, Tay L-L, Pezacki JP. Nanoscale. 2010 doi: 10.1039/c0nr00122h. [DOI] [PubMed] [Google Scholar]
- 44.Kneipp J, Kneipp H, McLaughlin M, Brown D, Kneipp K. Nano Lett. 2006;6:2225–2231. doi: 10.1021/nl061517x. [DOI] [PubMed] [Google Scholar]
- 45.Keating CD, Kovaleski KM, Natan MJ. J. Phys. Chem. B. 1998;102:9404–9413. [Google Scholar]
- 46.Regoli D, Barabe J. Pharm. Rev. 1980;32:1–46. [PubMed] [Google Scholar]
- 47.Liu XS, Kim CN, Yang J, Jemmerson R, Wang XD. Cell. 1996;86:147–157. doi: 10.1016/s0092-8674(00)80085-9. [DOI] [PubMed] [Google Scholar]
- 48.Kahraman M, Sur I, Culha M. Anal. Chem. 2010;82:7596–7602. doi: 10.1021/ac101720s. [DOI] [PubMed] [Google Scholar]
- 49.Fox JW, Vavrek RJ, Tu AT, Stewart JM. Peptides. 1982;3:193–198. doi: 10.1016/0196-9781(82)90050-x. [DOI] [PubMed] [Google Scholar]
- 50.Hu S, Morris IK, Singh JP, Smith KM, Spiro TG. J. Am. Chem. Soc. 1993;115:12446–12458. [Google Scholar]


