Abstract
The absence of imaging lenses after the specimen in the scanning transmission electron microscope (STEM) enables electron tomography to be performed in the STEM mode on micrometer-thick plastic-embedded specimens without the deleterious effect of chromatic aberration, which limits spatial resolution and signal-to-noise ratio in conventional TEM. Using Monte Carlo calculations to simulate electron scattering from gold nanoparticles situated at the top and bottom surfaces of a plastic section, we assess the optimal acquisition strategy for axial bright-field STEM electron tomography at a beam-energy of 300 keV. Dual tilt-axis STEM tomography with optimized axial bight-field detector geometry is demonstrated by application to micrometer-thick beta cells from mouse pancreatic islet. The quality of the resulting three-dimensional reconstructions is comparable to that obtained from much thinner (0.3-micrometer) sections using conventional TEM tomography. The increased range of specimen thickness accessible to axial STEM tomography without the need for serial sectioning enables the 3-D visualization of more complex and larger subcellular structures.
Keywords: Electron tomography, Scanning transmission electron microscopy, STEM tomography, Monte Carlo simulations
Introduction
Electron tomography (ET) is increasingly becoming a fundamental research tool in cell biology because of its unique ability to provide three-dimensional (3-D) views of intracellular structure down to nanoscale spatial resolution (3–8 nm) (Bárcena and Koster, 2009; Hoenger and McIntosh, 2009; Leis et al., 2009). For ultrastructural studies of large eukaryotic cells and tissue, conventional ET of heavy-metal stained specimens has been traditionally the technique of choice, since specimens are embedded in resin and thus easily sectioned in an ultramicrotome. Although staining typically precludes achieving molecular resolution in reconstructed tomograms, it still provides a reliable means to obtain valuable high-resolution information about intracellular membrane architecture.
Specimen thickness in ET of stained plastic sections falls within two distinct regimes: thin sections of less than about 200 nm that yield the best possible resolution in the 3-D reconstructions; and semi-thick sections of around 300–400 nm that are employed when structures of interest need to be visualized in their entirety along the z direction. These thickness ranges pertain to a microscope operating at an acceleration voltage of 300 kV. There have also been some attempts to perform ET in sections of thickness exceeding 1 micrometer using ultra high voltage electron microscopes or alternative imaging modes in standard microscopes, but these approaches have not yet found widespread use (Han et al., 1997; Martone et al., 2000; Bouwer et al., 2004).
More recently, ET based on the technique of scanning transmission electron microscopy (STEM) has emerged as a promising approach to obtain 3-D reconstructions from specimens of about 1 micrometer in thickness (Aoyama et al., 2008; Hohmann-Marriott et al., 2009; Sousa et al., 2009). This ability to image micrometer-thick sections could be valuable, for example, in 3-D ultrastructural studies of eukaryotic parasites either in isolated form or interacting with an intracellular host (Rocha et al., 2006; Gadelha et al., 2009; Hohmann-Marriott et al., 2009; Hanssen et al., 2010). Owing to their relatively small sizes, these organisms could be imaged entirely in a single one-micrometer-thick section or at most in a few serial thick sections.
STEM tomography of thick-sections can be realized by optimizing microscope operating parameters. Specifically, the convergence angle of the incident beam must be made sufficiently small (around 1–2 mrad) to increase depth of field so that the entire thick section is in focus along its depth, i.e., z-direction (Hyun et al., 2008; Loos et al., 2009; Hohmann-Marriott et al., 2009; Biskupek et al., 2010). Furthermore, use of an axial bright-field (BF) detector in lieu of a standard high-angle annular dark-field (HAADF) detector is found to reduce blurring of specimen features situated toward the bottom of thick sections (Hohmann-Marriott et al., 2009; Sousa et al., 2009).
Here we extend our recent work on axial STEM tomography of thick sections to dual-axis reconstruction. First, we show how Monte Carlo electron trajectory simulations can be used to rationalize the choice of relevant experimental parameters. Then, to illustrate the performance of the technique, we generate a dual-axis tomographic reconstruction from a specimen of pancreatic beta cells sectioned to a thickness of 1 micrometer.
Experimental
Electron tomography
Electron microscopy was performed in a Tecnai TF30 electron microscope (FEI Company, USA) operating with a Shottky field-emission gun and at an acceleration voltage of 300 kV. This instrument is equipped with a 2048 × 2048 pixel Ultrascan CCD camera situated after a Tridiem post-column imaging filter (Gatan, USA). In addition, this microscope is fitted with an in-column high-angle annular dark-field STEM detector (Fischione, USA) as well as an axial bright-field STEM detector (Gatan) located below the viewing screen.
Samples for electron tomography consisted of plastic-embedded and post-stained sections of chemically fixed pancreatic beta cells. Particularly for STEM tomography of thick sections, introducing unnecessarily large amounts of heavy-metal stain should be avoided. This is because introducing too much stain would most probably not reveal any additional ultrastructural detail, but might lead to an increased broadening of the STEM probe and thus to a lower resolution towards the bottom sample surface.
Three distinct electron tomography experiments were performed: (1) conventional ET (with zero-loss filtering) on 300-nm thick sections; (2) most-probable energy-loss tomography (MPEL) on 1-µm thick sections; and (3) axial bright-field STEM tomography also on 1-µm thick sections. For the STEM tomographic tilt series, the regions to be analyzed were first pre-irradiated and stabilized with a broad beam in transmission mode before switching to STEM. In all these experiments, we recorded dual-axis tilt series ranging from −60° to +60° in increments of 1.5° and with a total electron dose of 3.9 × 10⁴ e/nm2. The pixel size of the images in the tilt series was 4 nm, which corresponded to specimen fields approximately 8.2 × 8.2 µm2 in area. A STEM tomographic tilt series with pixel size of 1.4 nm and dose of 3.2 × 10⁵ e/nm2 was also recorded. MPEL tomography was carried out with a 30 eV energy window centered for each tilt angle at the maximum in the energy-loss spectrum. Axial STEM tomography was performed with a convergence semi-angle of the incident probe of 1.6 mrad and a BF STEM detector outer semi-angle of 9.3 mrad. For both MPEL and axial STEM tomography, the 1-µm-thick samples were flipped upside-down in addition to being rotated by 90° during acquisition of the second orthogonal tilt series.
3-D reconstruction of the tilt series was computed using the weighted back-projection algorithm included in the IMOD package (University of Colorado, USA) (Kremer et al., 1996). All tomograms were generated with a binning factor of 2, and were post-processed with a median filter of size 3.
Monte Carlo electron trajectory simulations
A Monte Carlo simulation program was written to generate images of gold particles situated at the top and bottom surfaces of thick sections. In the simulations, the matrix consisted of a uniform mixture of carbon and osmium atoms to represent a stained biological specimen. The main workflow of the computer program, which is largely based on the algorithms outlined by Joy (1995) and Hovington et al. (1997), has been described elsewhere (Sousa et al., 2009). For samples such as these consisting of gold particles embedded in a matrix of uniform composition, the calculations must take into account the change in sample composition when an electron travels from matrix to particle and vice versa. We thus followed a scheme described by Gauvin et al. (1995) that enables the proper calculation of electron trajectories in this type of heterogeneous specimen.
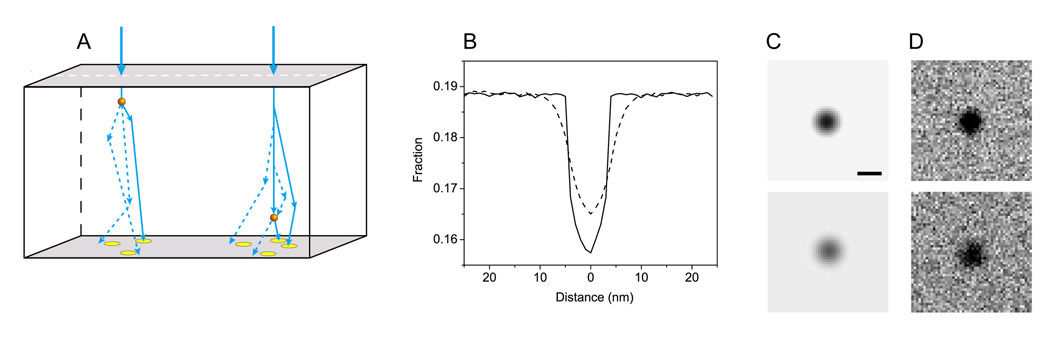
To simulate images of gold particles, we begin by performing Monte Carlo calculations along a line profile across the particles (Fig. 1A). Specifically, at each 1-nm pixel in the profile we compute the trajectories of 1–5 million electrons as they traverse the sample (Fig. 1A). We then use the net scattering angle of each electron at the exit surface of the sample to determine whether a STEM detector of given collection angle intercepts that electron trajectory. The line profile with the fraction of collected electrons (Fig. 1B) is then rotated in plane by 360° giving rise to an image of a gold particle (Fig. 1C). We finally multiply the resulting image by a given number of incident electrons and add Poisson noise (Fig. 1D). Fig. 1 shows a gold particle at the bottom of a thick sample with a slightly blurrier, more diffuse outline, in agreement with beam broadening of the incident beam in thick specimens.
Fig. 1.
Monte Carlo simulations of gold particles on thick specimens. (A) Schematic diagram illustrating typical trajectories of incident electrons as they traverse a thick biological specimen containing gold particles. The net scattering angle of each electron at the exit surface of the sample is used to determine whether the electron impinges on a STEM detector of fixed collection angle. Circles at the bottom sample surface represent upward projections of the bright-field STEM detector area. Diagram is not to scale. (B) Fraction of collected electrons along a line profile across 10-nm gold particles situated near to the top surface (solid line) and bottom surface (dashed line) of a 1-µm thick sample. (C) Images of top and bottom gold particles (upper and lower panels, respectively) obtained by rotating the line profile through 360°. (D) Same particles shown in (C) after adding Poisson noise for 10,000 incident electrons.
Using the above method, we simulated BF and HAADF STEM dual-axis tilt series for a specimen consisting of 10-nm gold particles located at the top and bottom surfaces of a 1-µm-thick section composed of 2 atomic % osmium in carbon. The series were calculated for tilt angles ranging from −60° to +60° in increments of 2° and for an electron dose of 104 incident electrons per nm2 in each image. The outer semi-angle of the BF STEM detector was 10 mrad, and the HAADF detector had a collection angle of 40–200 mrad.
Results and Discussion
Monte Carlo electron trajectory simulations
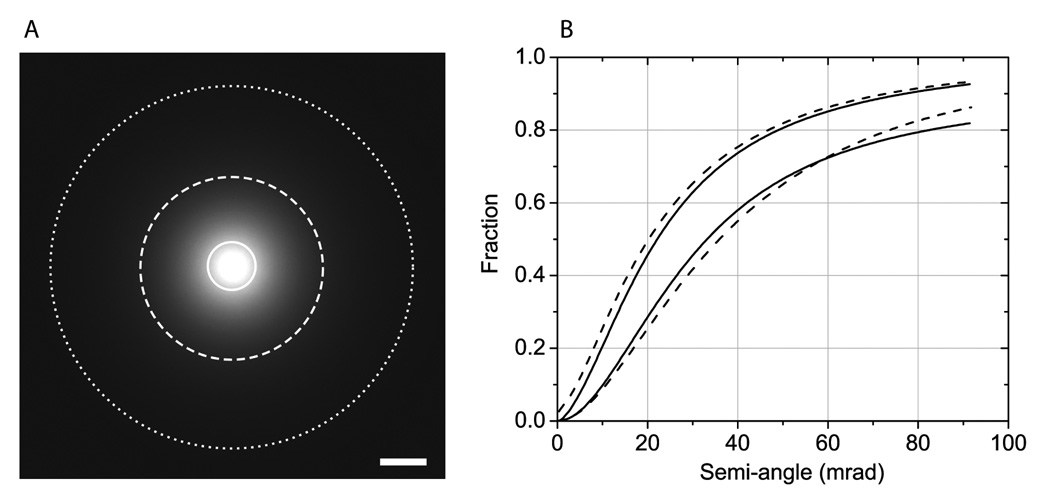
First, we checked the consistency of our Monte Carlo calculations in fitting correctly experimental data obtained from an osmium tetroxide-stained plastic section of about 1 µm nominal thickness. The specimen was illuminated with a stationary probe in STEM mode with a convergence semi-angle of 1.6 mrad and the resulting nanodiffraction pattern, corresponding to the transmitted electron intensity distribution as a function of scattering angle, was recorded on a CCD camera. This procedure was repeated with a sample of double the thickness, which was facilitated by tilting the specimen to 60°. We then radially integrated the intensity values in our nanodiffraction patterns (e.g., Fig. 2A) to obtain the solid curves shown in Fig. 2B, in which the upper and lower solid curves correspond to the untilted (about 1-µm nominal thickness, i.e., before shrinkage) and tilted (about 2-µm thick) specimens, respectively. We finally performed Monte Carlo simulations and compared the results of the calculations with the experimental curves in Fig. 2B. It was found that the simulations (Fig. 2B, dashed curves) were in reasonable agreement with the experimental data assuming 800 and 1600 nm-thick simulated specimens having constant density of 1.3 g/cm3 and uniform composition of 2 atomic % osmium in carbon. These values of thickness, density and composition adopted in the simulations are close to the expected values. For example, we have previously determined that stained samples contain between 1 and 3 atomic % of heavy atoms in relation to light atoms (Sousa et al., 2008). These results therefore suggest that our Monte Carlo calculations can be used to generate reliable STEM image simulations of thick specimens.
Fig. 2.
Comparison of Monte Carlo calculations to experimental measurements. (A) Nanodiffraction pattern acquired in STEM mode with a stationary probe showing transmitted electron intensity distribution as a function of scattering angle for a thick (< 2 µm) stained biological specimen. Circles define semi-angles of 10, 40 and 80 mrad. (B) Fraction of scattered electrons as a function of angle (mrad) for samples of about 1 and 2 µm nominal thickness (top and bottom solid curves, respectively). The curves were computed through radial integration of diffraction patterns, such as (A), and through normalization by the number of incident electrons. Monte Carlo simulations (dashed curves) give good fit to experimental data assuming 800 and 1600 nm-thick specimens with a density and composition of 1.3 g/cm3 and 2 atomic % of osmium in carbon. Scale bar, 20 mrad.
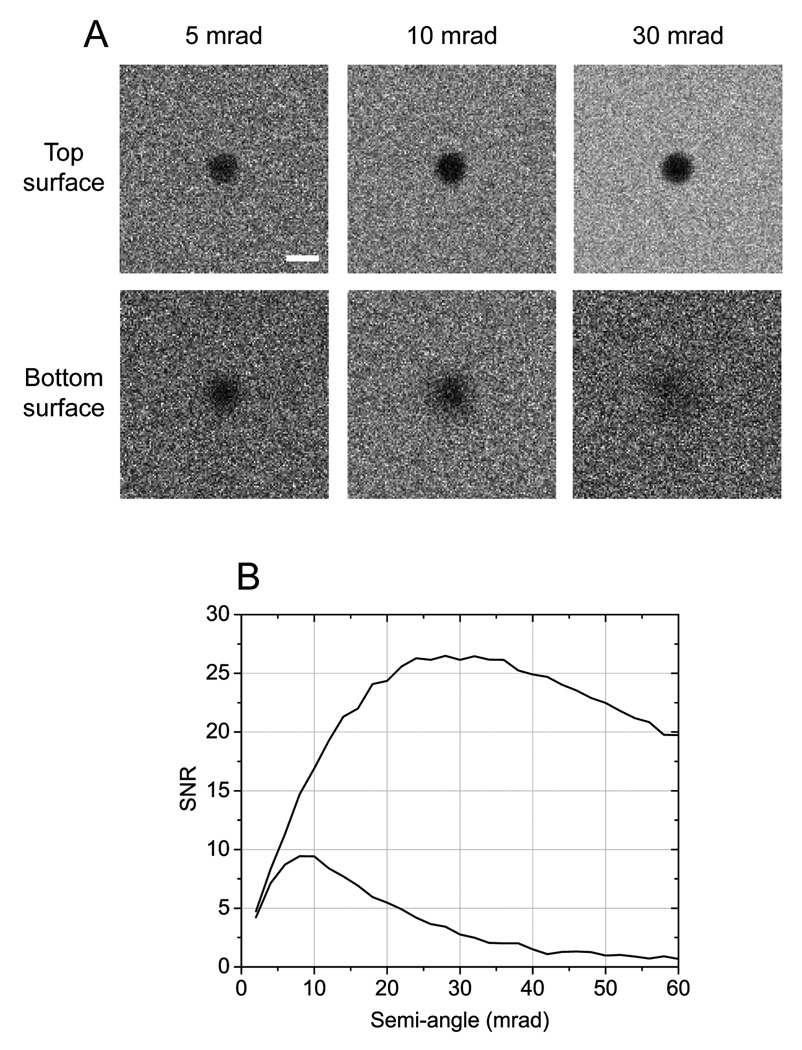
Next, we performed Monte Carlo calculations on simulated thick sections containing gold particles. Because these simulations are unaffected by experimental complications such as beam damage of the specimen, detective quantum efficiency, and conversion factor between detector counts and numbers of scattered fast electrons, the results are directly quantifiable. Fig. 3A shows simulated images of 20 nm gold particles situated at the top and bottom surfaces of a 2-µm-thick specimen consisting of 2 atomic % of osmium in a carbon matrix. As expected, particles located at the top of the sample are imaged with high spatial resolution, i.e., no image blurring. Fig. 3B reveals, in particular, that optimum values of SNR for these particles occur for "large" outer semi-angles of the BF detector of around 30 mrad. Conversely, particles situated at the bottom surface appear blurry due to beam spreading, and the effect is more significant for large collection angles of the BF detector (30 mrad). The SNR for the bottom particles is therefore maximized for "small" detector outer semi-angles of approximately 10 mrad.
Fig. 3.
Quantitative BF STEM image simulations using Monte Carlo calculations. (A) Simulated images of 20 nm gold particles located at the top and bottom surfaces of a 2-µm thick specimen. Values in mrad correspond to the outer semi-angle of the BF STEM detector. (B) SNR curves calculated from simulated images such as those displayed in (A). SNR for particles at the top surface is maximized for "large" collection angles of the BF detector (top curve). Particles situated at the bottom become blurry due to beam spreading and their SNR is thus optimized for "small" collection angles (bottom curve). Scale bar, 20 nm.
The SNR curves shown in Fig. 3B were computed for a specific sample thickness of 2 µm and particle size of 20 nm. We also performed Monte Carlo calculations assuming different combinations of specimen thicknesses (1 and 2 µm) and gold particle diameters (5, 10 and 20 nm). In all cases, we find that the SNR for particles situated at the top of the samples is maximized for "large" outer semi-angles of the BF detector, namely between 15 and 30 mrad depending on the specific values of thickness and particle size. On the other hand, the SNR for particles situated at the bottom is always optimized for smaller collection angles (around 5–10 mrad).
The above results imply that in the context of STEM tomography of micrometer thick sections, there should in theory be some improvement in reconstruction quality by adjusting the camera length of the STEM detector according to tilt angle as well as to whether sample features of interest are situated towards the top or the bottom sample surface. Although this scheme would maximize contrast and SNR and optimize the spatial resolution, in practice it would complicate considerably data acquisition and processing. Thus, we choose to work with a fixed BF detector of about 10 mrad outer semi-angle, which our calculations suggest as a good overall choice for STEM tomography of stained biological samples with 1-µm thickness.
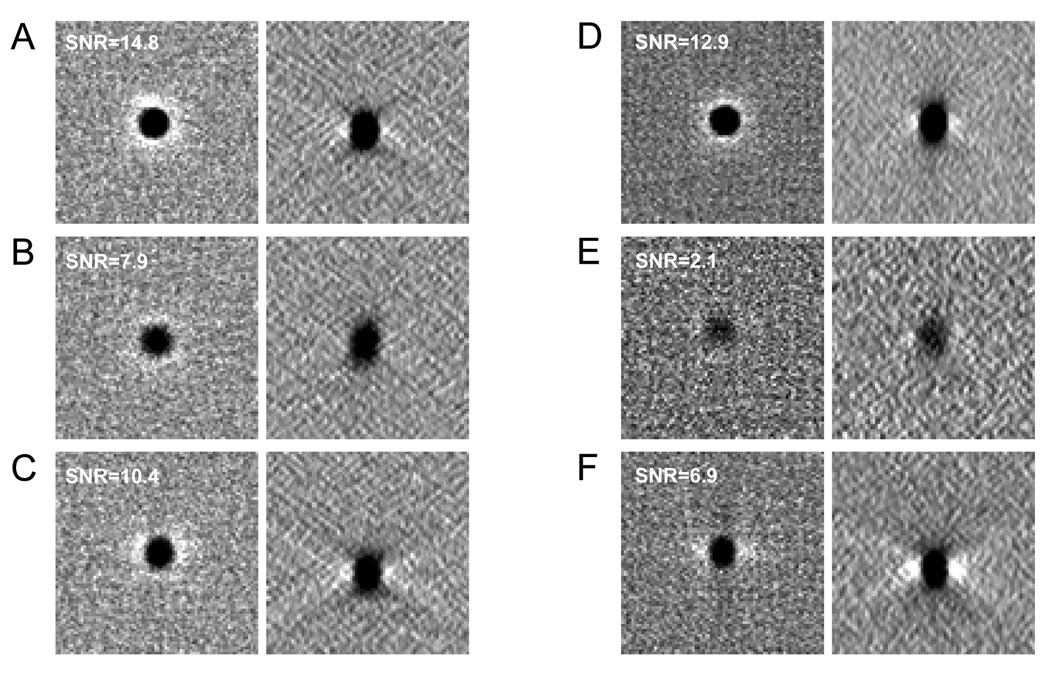
Even with an optimized detector outer angle of 10 mrad, axial STEM tomograms from thick sections will display an uneven reconstruction quality along the z direction. To illustrate this point, we used Monte Carlo calculations to simulate a dual-axis STEM tilt series from a 1-µm thick sample having 10-nm gold particles situated at its top and bottom surfaces. As expected, slices across the corresponding dual-axis reconstruction show that a gold particle at the top surface (Fig. 4A) has a sharper outline and higher SNR than a particle located at the bottom (Fig. 4B). This unevenness in reconstruction quality along the depth direction can be remedied to some extent by turning the sample upside-down in addition to rotating it by 90° between the first and second tilt series of a dual-axis acquisition. In this scheme, specimen regions near a given surface are positioned once towards the beam entrance surface, when they are imaged at higher spatial resolution, and once towards the beam exit surface, when they are imaged with lower spatial resolution and SNR. Fig. 4C shows a reconstructed gold particle from a simulated tomogram obtained according to this rotate-and-flip approach.
Fig. 4.
Simulated dual-axis STEM reconstructions of a 1-µm-thick specimen containing 10 nm gold particles. (A,B) Slices across the top (A) and bottom (B) surfaces of axial STEM tomogram. (C) Slices across either top or bottom surface of axial STEM tomogram generated following the rotate-and-flip approach. (D,E) Slices across the top (D) and bottom (E) surfaces of HAADF STEM tomogram. (F) Slices across either top or bottom surface of HAADF STEM tomogram generated by the rotate-and-flip approach. In (A–F), slices were taken through xy and xz planes of tomograms (left and right panels, respectively). Values of SNR for the gold particles are annotated in the images.
Finally, we use our Monte Carlo image simulations to assess the performance of HAADF STEM in relation to that of the axial bright-field STEM tomography technique. While these methods have been compared elsewhere (Hohmann-Marriott, 2009; Sousa et al., 2009), here our full tomographic simulations allow us to evaluate the HAADF and axial STEM techniques in more quantitative terms. A slice across the top of the HAADF STEM reconstruction (Fig. 4D) reveals that a 10-nm gold particle is imaged with about the same SNR as in BF mode (Fig. 4A). Conversely, a slice at the bottom shows a particle with much lower SNR in the HAADF STEM tomogram (Fig. 4E). This last result can be understood from the fact that beam broadening is manifested much more markedly in HAADF STEM than in BF STEM with a detector of small outer semi-angle (Sousa et al., 2009; Hohmann-Marriott et al., 2009; Motoki et al., 2010). We also show in Fig. 4F a slice taken from a simulated HAADF STEM tomogram generated with the rotate-and-flip acquisition approach. As expected, the SNR for the 10-nm-diameter particle is higher than shown in Fig. 4E but is still lower than for the axial STEM tomogram in Fig. 4C. Not clearly evident in the comparison between Figs. 4C and 4F is also the fact that the rotate-and-flip approach as applied to HAADF STEM results in less isotropic reconstructions than those that are computed from axial STEM tilt series. This is because in HAADF STEM a sample feature near a given surface is imaged with high SNR and resolution for one of the orthogonal tilt axis, but with much poorer SNR and resolution for the second orthogonal tilt axis.
Electron tomography on 1-µm-thick plastic sections
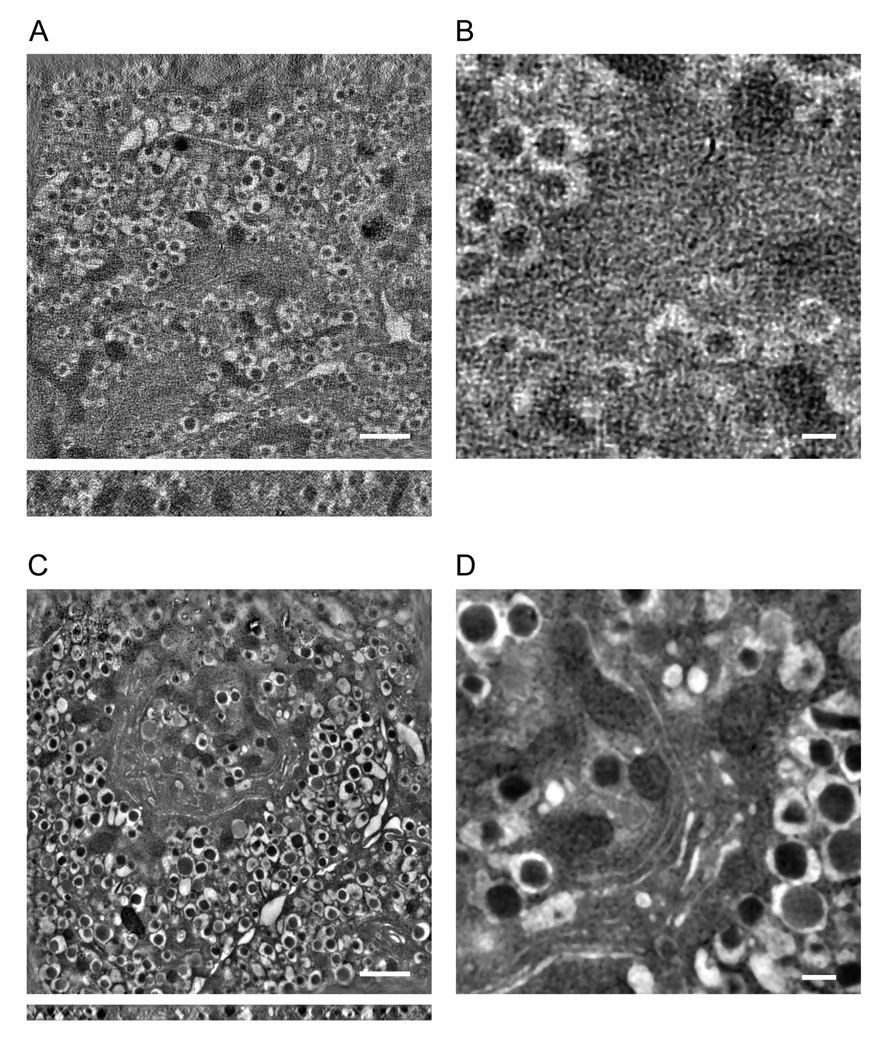
We have applied the axial STEM tomography technique to generate dual-axis reconstructions from 1-µm thick plastic sections of pancreatic beta cells. Before displaying these results, we first show a dual-axis tomogram from the same 1-µm thick section obtained using the most-probably energy-loss (MPEL) tomography technique (Bouwer et al., 2004). For a total electron dose of 3.9 × 10⁴ e/nm2 and at a pixel size of 8 nm after binning, the tomogram shows almost no discernible features aside from insulin granules and mitochondria (Fig. 5A,B; Supplementary Movie 1). Unsurprisingly, a better overall tomogram could be obtained by imaging a thinner, 300-nm-thick section (Fig. 5C,D).
Fig. 5.
Transmission electron tomography of thin and thick sections of pancreatic beta cells. (A) Most-probable energy-loss tomogram from a 1-µm-thick section. (B) Expanded view from (A) shows almost no discernible features aside from insulin granules. (C) For comparison, zero-loss filtered tomogram from a 300-nm-thick section showing better overall reconstruction but reduced structural information along the z direction. (D) Expanded view from (C). In (A,C), slices were taken through xy and xz planes of tomograms (top and bottom panels, respectively). Pixel size, 8 nm after binning. Scale bars, 1 µm (A,C) and 200 nm (B,D).
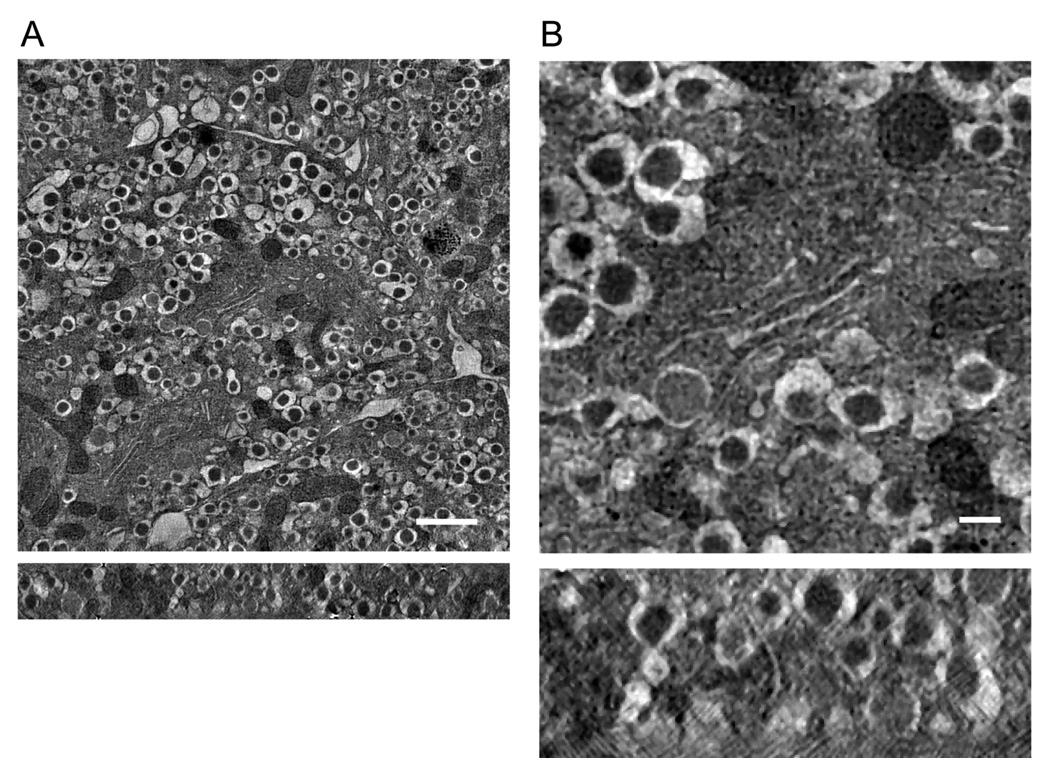
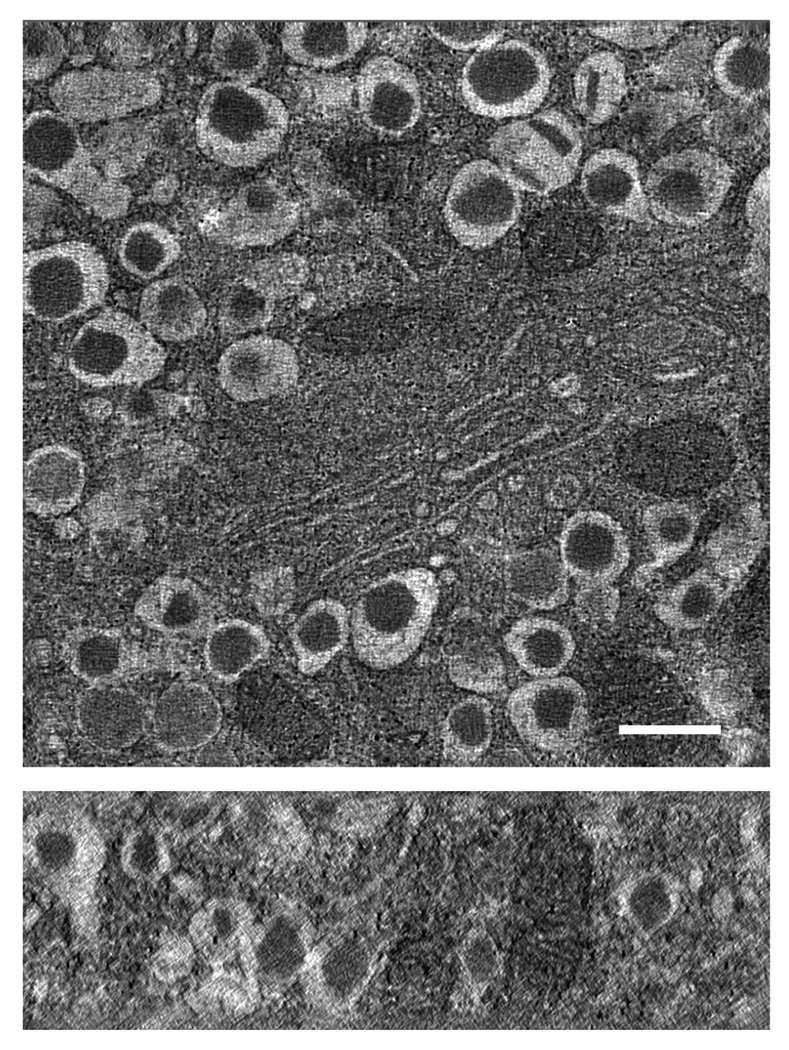
We then carried out axial STEM tomography on the same specimen region indicated in Fig 5A with dual-axis acquisition and the flip-and-rotate approach, and with the same values of electron dose and pixel size as used in the MPEL tomographic acquisition. It is evident that the overall quality of the STEM reconstruction (Fig. 6) is much improved compared with the reconstruction in Fig. 5A (see Supplementary Movie 2). We also obtained a tomogram with smaller pixel size (2.8 nm after binning) from the same area displayed in Fig. 6, in which fine ultrastructural details of a Golgi complex can now be seen more clearly in the center of the field of view (Fig. 7). Additional comparison between the MPEL and STEM methods is given elsewhere (Hohmann-Marriott et al., 2009).
Fig. 6.
Axial STEM tomography of a 1-µm-thick section of pancreatic beta cells. (A) Axial STEM tomogram showing improved reconstruction in relation to the MPEL technique (Fig. 5A,B). (B) Expanded view from (A). Slices were taken through xy and xz planes of tomogram (top and bottom panels, respectively). Scale bars, 1 µm (A) and 200 nm (B).
Fig. 7.
Axial STEM tomography of a 1-µm-thick section of pancreatic beta cells. The tilt series was obtained from the same area as displayed in Fig. 6 but with a smaller pixel size of 2.8 nm (after binning). Fine ultrastructural details of a Golgi complex can be seen in the center of the field of view. Slices were taken through xy and xz planes of tomogram (top and bottom panels, respectively). Scale bar, 400 nm.
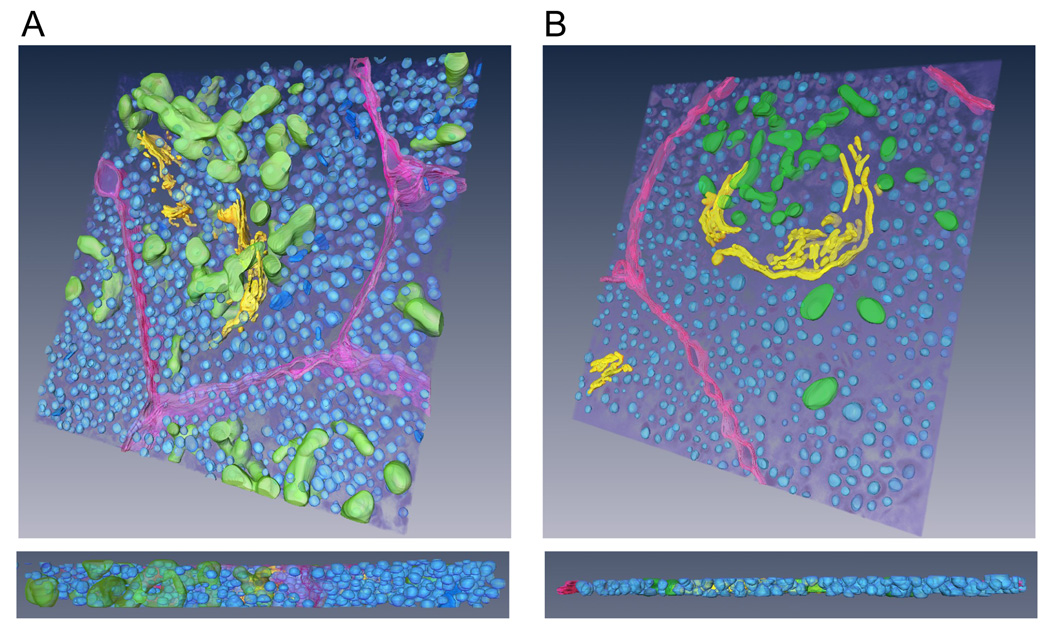
Importantly, the spatial resolution and SNR are sufficient in the 1-µm-thick STEM tomographic reconstructions to visualize identifiable features such as insulin granules, mitochondria and Golgi stacks and to surface-render those structures in considerable detail. To illustrate this point, we show in Fig. 8A a surface-rendered model derived from the axial STEM reconstruction (see also Supplementary Movie 3). For comparison, we have also segmented specimen features from the thin-section tomogram (Fig. 5C) and obtained the surface-rendered model displayed in Fig. 8B (see also Supplementary Movie 4).
Fig. 8.
3-D tomographic models from thin and thick sections of pancreatic beta cells. (A) Surface-rendered model derived from axial STEM reconstruction of 1-µm thick section. (B) Model derived from conventional ET reconstruction of 300-nm thick section. Insulin granules are rendered blue; Golgi complex, yellow; mitochondria, green; and plasma membrane, purple.
Taken together, Figs. 5, 6, 7 and 8 indicate that axial STEM tomography of 1-µm-thick sections yields 3-D reconstructions of comparable quality to those obtained from conventional TEM electron tomography of 300-nm thick sections but, because of the larger specimen thickness, the technique has the potential to provide more comprehensive 3-D models of extended cellular structures.
Finally, we briefly discuss the possibility of performing STEM tomography on biological sections thicker than 1 µm. Under these conditions, Monte Carlo simulations reveal that a BF detector of even smaller collection semi-angle than 10 mrad (e.g., 5 mrad) would be required to minimize image blurring at the bottom of the sections. However, a BF detector of 5 mrad would collect only 1.5% of the total number of incident electrons that are scattered from a sample of 2-µm thickness. After tilting the sample to 45°, this value would go down to about 0.5%. By comparison, a 10-mrad BF STEM detector collects as much as 20% of the incident electrons that are scattered by a 1-µm-thick sample. Therefore, in addition to exhibiting low contrast, axial STEM tomograms from sections thicker than 1 µm would be exceedingly noisy and preclude visualization of most specimen ultrastructure. To obtain dual-axis tomograms with better SNR, it would thus be necessary to increase the beam current by about an order of magnitude or more, which might be difficult to achieve while maintaining a nanometer-sized STEM probe of low convergence angle. Nevertheless, we note that it would be possible to visualize with very good resolution and SNR specimen features of interest that happened to be exclusively located toward the top regions of a thicker (> 1 µm) specimen (de Jonge et al., 2010). For this type of analysis, a BF STEM detector of large outer semi-angle or a HAADF detector would be the optimum choices.
For the 3-D reconstruction of large sample volumes (e.g., 10×10×5 µm3), axial STEM tomography could be performed on 1-µm-thick serial sections and the resulting individual tomograms stitched together along the z-direction (Soto et al., 1994). 3-D imaging of still larger volumes (e.g., imaging of tissue ultrastructure), although still feasible with this serial-section tomography method, would be more efficiently performed following other strategies such as focused ion-beam tomography in a focused ion-beam/scanning electron microscope (FIB/SEM) instrument (Heymann et al., 2006; Lešer et al., 2010).
Conclusions
We have shown that axial STEM tomography of 1-µm thick biological specimens yields 3-D reconstructions with adequate resolution and SNR to visualize characteristic subcellular membrane architecture and surface-render specimen structures of interest. In the axial STEM tomography technique, dual-axis tilt series are recorded using an incident probe of low convergence angle and a bright-field detector to collect the transmitted electron signal. A further advantage is realized by turning the thick section upside-down in addition to rotating it by 90° before acquiring the second orthogonal tilt series. Through Monte Carlo simulations, we found that a BF STEM detector of about 10-mrad outer semi-angle offers a good compromise between reducing image blurring at the bottom of thick sections and maintaining a sufficiently high SNR for specimen features situated at the top.
Overall, axial STEM tomography extends the regime of sample thickness in ET of fixed cells to beyond the 300–400 nm limit while maintaining adequate resolution and SNR in the resulting tomograms. This technique can therefore complement conventional ET, which yields tomograms at the highest possible resolution from the thinnest sections, and other methods such as slice-and-view in a dual beam microscope, which enables reconstructions from large sample volumes at somewhat poorer resolution.
Supplementary Material
Acknowledgments
The authors are grateful to Dr. David Mastronarde for helpful discussions and to Dr. Tao Cai for providing us with the isolated islets from mouse pancreata. This work was supported by the Intramural Research Program of the National Institute of Biomedical Imaging and Bioengineering, National Institutes of Health.
Footnotes
Publisher's Disclaimer: This is a PDF file of an unedited manuscript that has been accepted for publication. As a service to our customers we are providing this early version of the manuscript. The manuscript will undergo copyediting, typesetting, and review of the resulting proof before it is published in its final citable form. Please note that during the production process errors may be discovered which could affect the content, and all legal disclaimers that apply to the journal pertain.
References
- Aoyama K, Takagi T, Hirase A, Miyazawa A. STEM tomography for thick biological specimens. Ultramicroscopy. 2008;109:70–80. doi: 10.1016/j.ultramic.2008.08.005. [DOI] [PubMed] [Google Scholar]
- Bárcena M, Koster AJ. Electron tomography in life science. Sem. Cell. Dev. Biol. 2009;20:920–930. doi: 10.1016/j.semcdb.2009.07.008. [DOI] [PMC free article] [PubMed] [Google Scholar]
- Biskupek J, Leschner J, Walther P, Kaiser U. Optimization of STEM tomography acquisition - A comparison of convergent beam and parallel beam STEM tomography. Ultramicroscopy. 2010 doi: 10.1016/j.ultramic.2010.05.008. doi:10.1016/j.ultramic.2010.05.008. [DOI] [PubMed] [Google Scholar]
- Bouwer JC, MacKey MR, Lawrence A, Deerinck TJ, Jones YZ, Terada M, Martone ME, Peltier S, Ellisman MH. Automated most-probable loss tomography of thick selectively stained biological specimens with quantitative measurement of resolution improvement. J. Struct. Biol. 2004;148:297–306. doi: 10.1016/j.jsb.2004.08.005. [DOI] [PubMed] [Google Scholar]
- de Jonge N, Peckys DB, Kremers GJ, Piston DW. Electron microscopy of whole cells in liquid with nanometer resolution. Proc. Nat. Acad. Sci. USA. 2009;106:2159–2164. doi: 10.1073/pnas.0809567106. [DOI] [PMC free article] [PubMed] [Google Scholar]
- de Jonge N, Poirier-Demers N, Demers H, Peckys DB, Drouin D. Nanometer-resolution electron microscopy through micrometers-thick water layers. Ultramicroscopy. 2010 doi: 10.1016/j.ultramic.2010.04.001. doi: 10.1016/j.ultramic.2010.04.001. [DOI] [PMC free article] [PubMed] [Google Scholar]
- Gadelha C, Rothery S, Morphew M, McIntosh JR, Severs NJ, Gull K. Membrane domains and flagellar pocket boundaries are influenced by the cytoskeleton in African trypanosomes. Proc. Nat. Acad. Sci. USA. 2009;106:17425–17430. doi: 10.1073/pnas.0909289106. [DOI] [PMC free article] [PubMed] [Google Scholar]
- Gauvin R, Hovington P, Drouin D. Quantification of spherical inclusions in the scanning electron microscope using Monte Carlo simulations. Scanning. 1995;17:202–219. [Google Scholar]
- Han KF, Sedat JW, Agard DA. Practical image restoration of thick biological specimens using multiple focus levels in transmission electron microscopy. J. Struct. Biol. 1997;120:237–244. doi: 10.1006/jsbi.1997.3914. [DOI] [PubMed] [Google Scholar]
- Hanssen E, Carlton P, Deed S, Klonis N, Sedat J, DeRisi J, Tilley L. Whole cell imaging reveals novel modular features of the exomembrane system of the malaria parasite, Plasmodium falciparum. Int. J. Parasit. 2010;40:123–134. doi: 10.1016/j.ijpara.2009.09.004. [DOI] [PubMed] [Google Scholar]
- Heymann JA, Hayles M, Gestmann I, Giannuzzi LA, Lich B, Subramaniam S. Site-specific 3D imaging of cells and tissues with a dual beam microscope. J. Struct. Biol. 2006;155:63–73. doi: 10.1016/j.jsb.2006.03.006. [DOI] [PMC free article] [PubMed] [Google Scholar]
- Hoenger A, McIntosh JR. Probing the macromolecular organization of cells by electron tomography. Curr. Opin. Cell. Biol. 2009;21:89–96. doi: 10.1016/j.ceb.2008.12.003. [DOI] [PMC free article] [PubMed] [Google Scholar]
- Hohmann-Marriott MF, Sousa AA, Azari AA, Glushakova S, Zhang G, Zimmerberg J, Leapman RD. Nanoscale 3D cellular imaging by axial scanning transmission electron tomography. Nat. Methods. 2009;6:729–731. doi: 10.1038/nmeth.1367. [DOI] [PMC free article] [PubMed] [Google Scholar]
- Hovington P, Drouin D, Gauvin R. CASINO: A new Monte Carlo code in C language for electron beam interaction - Part I: Description of program. Scanning. 1997;19:1–14. [Google Scholar]
- Hyun JK, Ercius P, Muller DA. Beam spreading and spatial resolution in thick organic specimens. Ultramicroscopy. 2008;109:1–7. doi: 10.1016/j.ultramic.2008.07.003. [DOI] [PubMed] [Google Scholar]
- Joy DC. Monte Carlo Modeling for Electron Microscopy and Microanalysis. New York: Oxford University Press; 1995. [Google Scholar]
- Kremer JR, Mastronarde DN, McIntosh JR. Computer visualization of three-dimensional image data using IMOD. J. Struct. Biol. 1996;116:71–76. doi: 10.1006/jsbi.1996.0013. [DOI] [PubMed] [Google Scholar]
- Leis A, Rockel B, Andrees L, Baumeister W. Visualizing cells at the nanoscale. Trends Biochem. Sci. 2009;34:60–70. doi: 10.1016/j.tibs.2008.10.011. [DOI] [PubMed] [Google Scholar]
- Lešer V, Milani M, Tatti F, Tkalec ZP, Štrus J, Drobne D. Focused ion beam (FIB)/scanning electron microscopy (SEM) in tissue structural research. Protoplasma. 2010;246:41–48. doi: 10.1007/s00709-010-0118-8. [DOI] [PubMed] [Google Scholar]
- Loos J, Sourty E, Lu K, Freitag B, Tang D, Wall D. Electron tomography on micrometer-thick specimens with nanometer resolution. Nano Lett. 2009;9:1704–1708. doi: 10.1021/nl900395g. [DOI] [PubMed] [Google Scholar]
- Martone ME, Deerinck TJ, Yamada N, Bushong E, Ellisman MH. Correlated 3D light and electron microscopy: Use of high voltage electron microscopy and electron tomography for imaging large biological structures. J. Histotech. 2000;23:261–270. [Google Scholar]
- Motoki S, Kaneko T, Aoyama Y, Nishioka H, Okura Y, Kondo Y, Jinnai H. Dependence of beam broadening on detection angle in scanning transmission electron microtomography. J. Elec. Microsc. 2010 doi: 10.1093/jmicro/dfq030. doi: 10.1093/jmicro/dfq030. [DOI] [PubMed] [Google Scholar]
- Noske AB, Costin AJ, Morgan GP, Marsh BJ. Expedited approaches to whole cell electron tomography and organelle mark-up in situ in high-pressure frozen pancreatic islets. J. Struct. Biol. 2008;161:298–313. doi: 10.1016/j.jsb.2007.09.015. [DOI] [PMC free article] [PubMed] [Google Scholar]
- Rocha GM, Brandão BA, Mortara RA, Attias M, De Souza W, Carvalho TMU. The flagellar attachment zone of Trypanosoma cruzi epimastigote forms. J. Struct. Biol. 2006;154:89–99. doi: 10.1016/j.jsb.2005.11.008. [DOI] [PubMed] [Google Scholar]
- Soto GE, Young SJ, Martone ME, Deerinck TJ, Lamont S, Carragher BO, Hama K, Ellisman MH. Serial section electron tomography: a method for three-dimensional reconstructions of large structures. NeuroImage. 1994;1:230–243. doi: 10.1006/nimg.1994.1008. [DOI] [PubMed] [Google Scholar]
- Sousa AA, Hohmann-Marriott M, Aronova MA, Zhang G, Leapman RD. Determination of quantitative distributions of heavy-metal stain in biological specimens by annular dark-field STEM. J. Struct. Biol. 2008;162:14–28. doi: 10.1016/j.jsb.2008.01.007. [DOI] [PMC free article] [PubMed] [Google Scholar]
- Sousa AA, Hohmann-Marriott MF, Zhang G, Leapman RD. Monte Carlo electron-trajectory simulations in bright-field and dark-field STEM: Implications for tomography of thick biological sections. Ultramicroscopy. 2009;109:213–221. doi: 10.1016/j.ultramic.2008.10.005. [DOI] [PMC free article] [PubMed] [Google Scholar]
Associated Data
This section collects any data citations, data availability statements, or supplementary materials included in this article.


