Abstract
The U.S. National Press has brought to full public discussion concerns regarding the use of medical radiation, specifically x-ray computed tomography (CT), in diagnosis. A need exists for developing methods whereby assurance is given that all diagnostic medical radiation use is properly prescribed, and all patients’ radiation exposure is monitored. The “DICOM Index Tracker©” (DIT) transparently captures desired digital imaging and communications in medicine (DICOM) tags from CT, nuclear imaging equipment, and other DICOM devices across an enterprise. Its initial use is recording, monitoring, and providing automatic alerts to medical professionals of excursions beyond internally determined trigger action levels of radiation. A flexible knowledge base, aware of equipment in use, enables automatic alerts to system administrators of newly identified equipment models or software versions so that DIT can be adapted to the new equipment or software. A dosimetry module accepts mammography breast organ dose, skin air kerma values from XA modalities, exposure indices from computed radiography, etc. upon receipt. The American Association of Physicists in Medicine recommended a methodology for effective dose calculations which are performed with CT units having DICOM structured dose reports. Web interface reporting is provided for accessing the database in real-time. DIT is DICOM-compliant and, thus, is standardized for international comparisons. Automatic alerts currently in use include: email, cell phone text message, and internal pager text messaging. This system extends the utility of DICOM for standardizing the capturing and computing of radiation dose as well as other quality measures.
Key words: Data extraction, medical informatics applications, radiation dose, database management systems, knowledge base
Background
Quality assurance (QA) monitoring of ionizing radiation use with certain diagnostic and procedural imaging is required by state regulatory bodies and by The Joint Commission in the US.1 Of the eight U.S. National Quality Measures Clearinghouse2,3 (federal) metrics specific to Radiology, two deal with radiation exposure: reduction of computed tomography (CT) dose and documentation of x-ray fluoroscopy duration. Since these requirements are enterprise-wide, radiologists, cardiologists, vascular surgeons, urologists, GI physicians, and other permitted users of x-ray and nuclear equipment are required to be monitored to satisfy the national goals. Recently, public discussion in the U.S national news has expressed concerns regarding the use of CT, including its expanding use, and instances of erythema that have occurred following certain CT examinations.4–6 These concerns drive medical facilities to provide enhanced monitoring of radiation use.7,8 While picture archiving and communication systems (PACS) can provide some insights from archived examinations, they suffer from several drawbacks:
PACS are typically department-level devices, and do not offer insight into a patient’s exposure across multiple departments or sites.9
Commercial PACS, for performance reasons, generally do not permit performing a query on a live production system.
Radiation dose relevant digital imaging and communications in medicine (DICOM) tag values can be missing, inconsistent, or inappropriate.
At this time, records of fluoroscopy radiation use are commonly hand-recorded into paper logbooks typically at the operator’s control console, or are manually retrieved from PACS. However, fetching the whole exam to determine the relevant information (e.g., dose and exam duration time) is obviously uneconomic, as is the common approach of manually reviewing a large number of exams to generate user- or protocol-specific radiation quality reports. A standardized toolkit is needed to automatically capture and integrate radiation dose records in a timely fashion.
One precursor of such standardization is the integration of Structured Reporting (DICOM WG—08,10) standards to exchange structured data during image acquistion or post-examination so that radiation dose indicators or dose-related information is available in PACS.11 Two tools currently available are CT dose SR and X-ray angiography (XA) SR.10 CT dose SR develops a record of patient episode of radiation that includes the radiation-dose-related parameters. Summary reports can be sent to PACS and included in a patient’s health record. However, no known tools currently exist for centralizing the documented administration of ionizing radiation episodes of care into a form suitable for routine use by quality assurance monitoring staff. In this research, DICOM Index Tracker© (DIT) is designed to serve as a patient-centric, integrated DICOM information repository (including radiation dose index history) combined with continual monitoring and reporting tools.
Methods
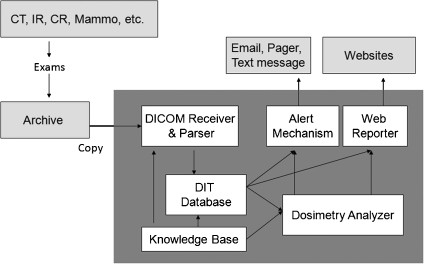
DIT is designed and implemented to be fully integrated into a DICOM-compliant infrastructure with the ability to capture and maintain longitudinal patient-specific exam indices of interest for all diagnostic and procedural uses of imaging modalities. This information system consists of six modules: a DICOM receiver accepting and parsing imaging files sent from equipment or PACS, a knowledge base (i.e., modalities, manufacturers, model, and software versions of known equipment) with mappings of the standard and proprietary DICOM tags of interest, a patient episode tracking database, dosimetry analyzer tools, a configurable web reporter, and an automated alert/messaging mechanism (e.g., unknown scanners, high radiation exposure, etc.). The system architecture of DIT, including the composite modules and the connection with other software, are shown in Figure 1. The implementation and evaluation of each component is summarized as follows.
Fig 1.
The architecture of DIT.
DICOM Receiver and Parser In DIT, the module called ‘DICOM Receiver and Parser’ receives images from DICOM-compliant devices/systems, extracts the tag information, and stores them into a DIT database. The Receiver takes advantage of the DICOM transport protocol12—the de facto standard in medical imaging transfer fully supported by the majority of device manufacturers and PACS vendors. DIT is able to receive and process medical images from various locations, modalities, and equipment. Following the receipt of images, the DICOM header information is parsed and transformed to XML format and then desposited to the tables in DIT database. DIT does not store image data (it can accept the DICOM Secondary Capture) to enhance performance and reduce storage needs.
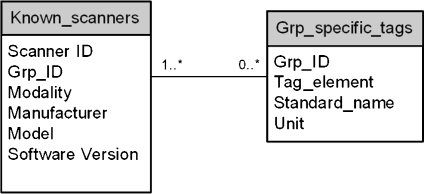
Knowledge Base DICOM tags commonly differ by modality, vendor, and software version even for the same vendor and modality. The continuously evolving DICOM standard often results in a given vendored product version being behind the newer DICOM committee standards. Nonetheless, even the base standard provides extensive information about the patient, the exact medical examination protocols, and the imaging modality acquisition settings. Every DICOM-compliant image file contains modality-/exam-specific attributes including: patient age, gender, examination ordered, protocol, and series descriptors, location of equipment, equipment software version, etc. Radiation dose-specific information varies by modality, but includes: kVp, mA and/or mAs, field of view, exposure index, air kerma at the patient entrance reference point (PERP), breast organ dose, body part, and with some nuclear equipment, the administered radioactivity (Bq). In the case of mammography, mean glandular organ dose is provided. Other important information might be in an image file (DICOM Secondary Capture). An example of this is the Exam Protocol screenshot, a method commonly used with CT to record the CT dose index (CTDIvol) and dose length product (DLP) for individual series and total examination.Because of the variation in supplied DICOM tags from different scanners, the Knowledge Base architecture design (Fig. 2) is included. Its schema identifies known scanners (defined as those having their hardware and software specifications, as well as the standard and proprietary dose-related tags present with this equipment) as being fully known by the database. The tag mappings drive the proper algorithm selection for calculating a dose approximation. Specifically, each known scanner (termed Known_scanners) belongs to one group of specific tags (termed Grp_specific_tags). In Known_scanners, the Grp_ID defines the group of proprietary data elements that will be harvested (chosen once, during a new equipment installation or with a new software version) from the DICOM header (in addition to the standard elements e.g., image UID, accession). The mapping from Grp_ID to dose-related information is defined in Grp_specific_tags. The advantage of such schema design is that it provides the system extensibility. For example, when a new scanner is added, or for an existing scanner, an update of software version, one record is added to known_scanners, and its list of dose-related tags are determined and appended into Grp_specific_tags. Importantly, this extension does not interfere with the processing of existing images, and it does not require any modification of programming with new images. Overall, the cost of adding an unknown scanner software version to DIT is minimal. Since the Knowledge Base serves as the foundation of the DIT system, its comprehensive and accurate content is essential for a successful implementation. The list of vendor modality specific tags was initially created as a team effort: radiology specialists from each modality, DICOM engineering staff, quality assurance staff, and system developer. The task ensures that the collected tags will satisfy all the facets of technical and expected QA needs e.g., dose calculation and quality monitoring within system technical constraints.
Fig 2.
The database schema of Knowledge Base.
DIT Database The database is designed to store all harvested tags while avoiding redundancy and maintaining a balanced storage to optimize data access efficiency. The resultant schema contains five parts: patient information, exam information (e.g., protocol), series information, image information, and vendor modality-specific-related information (e.g., dose). When images are sent from varied imaging devices into the DIT, the DICOM header is extracted; the data elements are parsed out and populated into the database. The specified elements are placed in database tables appropriate to the level of the information.In Figure 3, the table Patient has one record for each patient with information such as patient_local_ID, gender, and DOB. The table Exam contains the basic information pertinent to each exam common with each modality. This includes exam information (exam description, referring doctor, and radiologist), exam time, location, etc. The table Series stores the information related to series, such as series_UID and Series Description; and the table Images keeps the information at the image level, such as Image_UID and image acquisition time. The table Dose_Related_Info contains the data elements appropriate for the modality, device, and software. The schema is in a serial arrangement as in Figure 3, where the relationships between two neighboring tables are all one to many. That is, one Patient may have one or more exams, one Exam record contains one or more series, one Series usually have one or more Image records, and one Image record may be related to one or more Dose_Related_Info records. In this manner, the hierarchical structure of patient, exam, series, images, and dose information is reflected in the database design. The DIT database connects with the Knowledge Base to populate Dose_Related_Info. When each exam reaches DIT, tags for modality, manufacturer, model, and software version will be used to match the image to a known scanner in Knowledge Base. If the match is successful, DIT will fetch the list of specific desired tags from the Knowledge Base table Grp_specific_tags and populate these tags (taken from image header) into the DIT Database table Dose_Related_Info. If the match fails (the scanner/software is unknown), the database will automatically alert the database manager or medical physicist of the need to exactly specify DICOM tag dose-related fields for future archiving.Such database design minimizes data redundancy and accelerates a database search. The lower-level tables (left side of table in Fig. 3) have a far greater number of records, and thus, results in signficant computational cost to conduct the query as compared to the higher-level (right side of table in Fig. 3) tables. For example, to list the exams of specific patients, a query on the tables Patient and Exam is sufficient without involving table Series, Images, and Dose_Related_Info. Additionally, the design of table Dose_Related_Info gives improved flexibilty for querying any desired information since the number of dose-related data elements, their meaning, and units are not restricted by the table structure.
Fig 3.
The database schema of DIT Database.
Dosimetry Analyzer For each ionizing radiation modality, i.e., CT, CR, XA, PET, DX, etc., the computation of a patient-specific radiation dose estimate for a single (and each) episode of care is required in order to develop an overall cumulative estimate of dose associated with an individual. Extracted (tag) information available in the DIT includes wide ranging dose information; examination, and protocol, gender, age, projection angles, fluoroscopy exposure rate and time, air kerman rate, air kerman area, PERP, DLP, Bq breast organ dose, CTDIvol, dose area product (DAP), etc. This modality-specific information can be used by physicists to assess or estimate a dose particular to a specific exam, or to compare types of procedures, different vendors, or software versions, physican or technologist operator, and even different medical facilities. In some cases, the equipment and software version do not support any tag to precisely compute the dose. For example, with CT, a lack of consensus currently exists on the best method of computing an estimate of dose. Nonetheless, at least a recording of the number of specific examinations, by modality, can be identified for each patient.
Web Reporter With increasing numbers and multi-location episodes of diagnostic and interventional radiation examinations and procedures, IT systems must be capable of providing online reporting; this is arguably the only appoach to handling the complexity of access to dose information. It is also needed to provide distributed real-time review by current practice.13 For quality assurance purposes, a web reporting module enables the management, and performs ad hoc execution, of configurable reports. Each report template is created in Oracle® Reporter (Oracle®, Redwood Shores, CA) to run on an Oracle Report® server. The report profile can be selected in ASP.NET web pages; users set their configuration and generate reports online. As the focus of this project is quality assurance, in which the content is varied but not fully defined, the tool is intentionally general in design, providing flexibility to other database-based web reporting applications.This tool can be modified to provide reports on many of the DICOM tag values that may be of future interest. Alternatively, the results of a search also create a listing of the data requested which is rendered in a data table. A mammography search might include radiation dose, breast thickness, and the filter type (either chosen by the technologist or automatically selected by the equipment). A Save button creates an Excel file that is available for creation of any desired graph format using i.e., Chart Wizard (the user-friendly Excel function to generate charts).14 A box to insert legal disclaimers regarding the appropriate use of privileged QA information is included.
Alert Mechanism This highly important instant message alert system enables the time by notification of user-defined critical events. By setting different levels of urgency, the designated QA staff are alerted to preconditioned events in near real-time. DIT alerts are generated automatically during user-configurable time period monitoring (i.e., every hour, or at midnight). When the service level reaches some warning threshold or Triggers, an alert is sent.At this time, alerts are sent via internal email, designated cell phone text messaging, and internal pager text messages. All messaging are organized by a distribution list, and multiple staff receive specific messages. Alerts are also needed to maintain the robustness and accuracy of the system; any newly arriving images received by an unknown scanner generate an email message to support staff for a review of the data record and for an update on the Knowledge Base with the appropriate DICOM tags.
Results
Knowledge Base The system consisting of all the above six modules was developed at Mayo Clinic Arizona (MCA) starting in January, 2009. Testing and development of DIT has continued since August 2009. DIT (v1.0) was introduced into clinical use in September, 2009. The initial test database contained approximately 650 exams (~70,000 image headers) purposely chosen from different vendors and modalities to expand the Knowledge Base to approximately 25 different devices at MCA. Currently, additional devices are being added from Mayo Clinic Florida and Mayo Clinic Rochester. These include CT, MRI, US, interventional radiology, computed radiography, DR, cardiac catheterization, nuclear PET, and mammography. Ongoing testing and validation enables the system to improve and be accepted for use in clinical service at MCA. The MCA volume expected for 2010 are 250 K examinations having ~1 M image headers; however, historical archive of examinations is being considered.
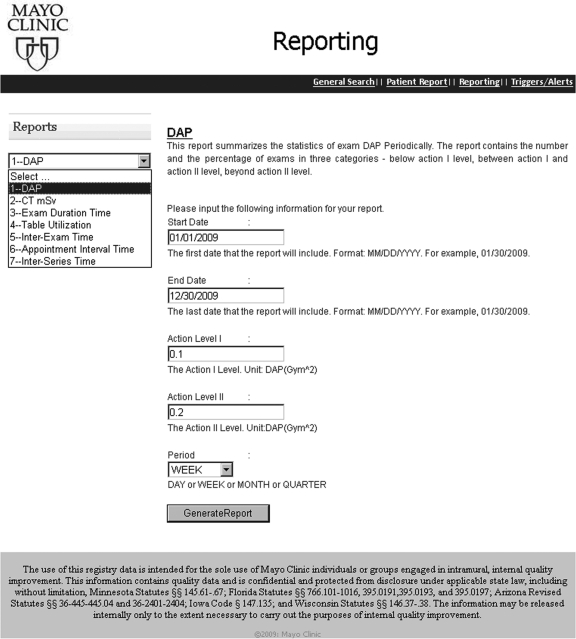
Web Reports QA staff are provided with ad hoc access to protocol and device specific as well as population-wide and patient-specific radiation exposures indices. Figure 4 shows the current web user interface for creating ad hoc reports. The user selects from the drop down menu for one of the eight available reports—DAP Report, CT mSv report, Exam Duration Time Report, Table Utilization Report, Inter-Exam Time Report, Appointment Interval Time Report, and/or Inter-Series Time Report. Each report is designed to address a quality assurance concern and is provided with configuration options. For example, the DAP Report contains the population-wide statistics of DAP for IR exams during a certain period.15 If DAP report is selected, the user is allowed to further input
Dates: start date and end date of the report time scope
Action Level I: the Level I DAP threshold. The exams with DAP beyond this level will trigger the control Action I. For example, an up-to-date report of exams can be reviewed in the quarterly QA committee meeting.
Action Level II: the Level II DAP threshold. The exams with DAP beyond this level will trigger the control Action II or, if wished, an Alert
Period (day, week, month, quarter): the frequency by which the statistics should be summarized.
Fig 4.
Web based user interface for report selection. In this case, dose area product (DAP) is selected.
A request with these chosen configuration parameters is sent to the web server when the user clicks the GenerateReport button. The web server will execute the request on an Oracle Report® server which is responsible for querying the database, composing the report, and returning the result to the user. The report will display in an ASP.NET web page, and the user can easily save it as a pdf file on the local drive (Fig. 5).
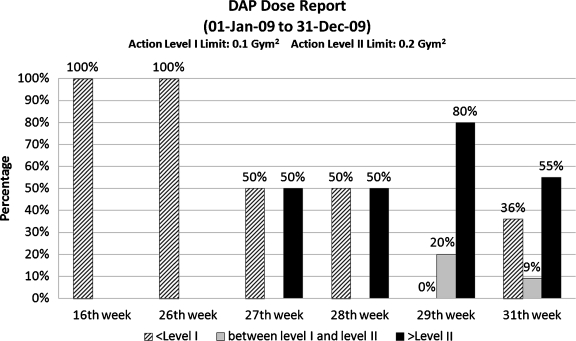
Fig 5.
Example report of DAP trends for the year 2009 (based on test data).
Reports provide full details and, to faciliate the interpretation of data, summarize statistics, charts, and diagrams. For example, the DAP Report lists the related exams and shows the histogram of DAP distribution by period. Figure 5 is the last page of a DAP Report, summarizing the weekly DAP statistics from 01 January 2009 to 31 December 2009. The week is plotted only if data exists in that particular time period; therefore, the x-axis is not necessarily continuous. The y-axis shows the percentages of exams falling into three categories: values less than Action Level I are considered safe (in pattern), caution is noted for values between Action Level I and II (gray), and values that exceed Action Level II require attention (black). Such diagrams may prove useful in indicating the trends that may require special attention. Figure 5 shows an increasing number of exams with high DAP from the 27th week to the 30th week.
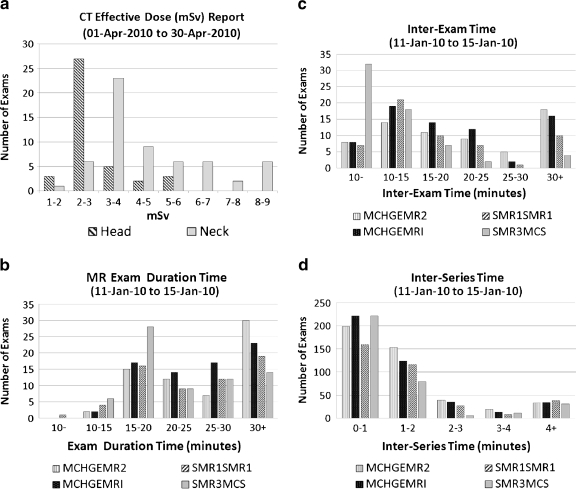
Figure 6a is a CT Effective Dose Report comparing dose usage with exams from different protocols (head vs. neck) using test data obtained with a DICOM Dose SR-compliant CT scanner. Effective Dose metric quantifies the radiation effective dose of these CT exams.16 In this report, Effective Dose metric is computed using DLP, patient’s age, and target region following the method described by AAPM Report 96.17 Plotting the number of exams in the discretized range of Effective Dose, the report renders a range of use, as illustrated. From Figure 6a, it is seen that test exams on the neck result had a higher Effective Dose than the head test data. Any desired comparisons of Effective Dose by equipment and/or by exam types and physical location is possible.
Fig 6.
a Dose Report for head and neck exams with a DICOM SR-compliant CT scanner. b Exam Duration (time) report. c Inter-exam report: the empty table time between patient exams. d Inter-series report: the waiting time between series of the same exam.
Other report examples are shown in Figure 6b to d,
Exam Duration Report: summarizes the statistics of exam duration. Users can generate the reports based on modality, or device, or protocol.
Inter-Exam Time Report: summarizes the statistics of inter-exam time. Inter-exam time is an estimate of empty table time between successive patient exams.
Inter-Series Time Report: summarizes the statistics of inter-series time. Inter-Series time is the time between the successive series in one exam.
The results of these reports are described in details in the paper of M. Hu et al.18
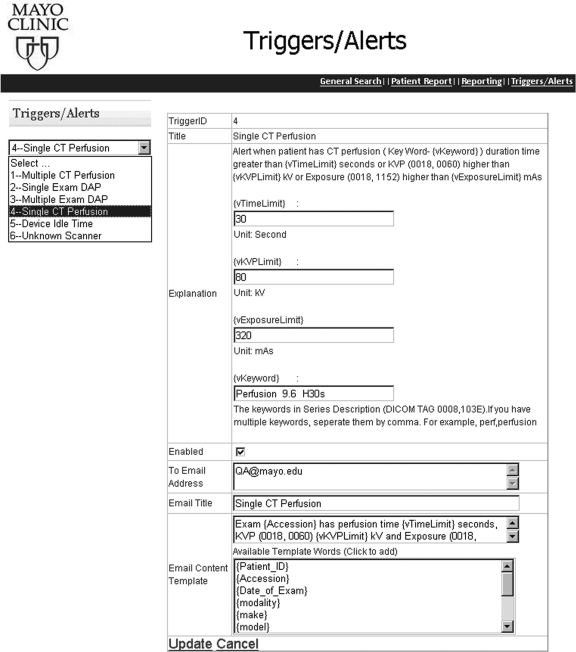
Alert Messaging Real-time notification to QA staff is automatically performed as the application executes the alerting process on a predefined frequency (e.g., every 2 h, each day) configurable by the user. Periodic queries by the database check each predetermined criteria and send alerts when any condition is satisfied. The existing triggers are managed via a web user interface (Fig. 7). Users can select the alert from a dropdown list. The explanation and conditional parameters are shown. Currently, six alert types are in clinical use:
Multiple CT perfusion: monitors for multiple CT perfusion examinations on the same patient within a specified period of time
Single-exam DAP: monitors for a single-exam instance in which a DAP value exceeds a configurable threshold
Mulitple-exam DAP: monitors for multiple exams on the same patient where the accumlated DAP value exceeds a configurable threshold
Single CT perfusion: monitors for a CT perfusion single instance which exceeds predetermined values of mA, or seconds, or kVp
Device Idle Time: monitors for long idle equipment time during scheduled working hours
Unknown Scanner: notifies staff when there are DICOM images sent to DIT from an unknown scanner
Fig 7.
The web page to configure the alerts in the event of a patient experiencing excessive procedure time/kVp/exposure in CT perfusion.
As an example, Figure 7 illustrates a single CT perfusion alert addressing an individual patient’s potential for high exposure during CT perfusion exam. The exam time(s), kVp, and mA in each CT perfusion exam is monitored by being compared with the predetermined thresholds. If any of the values exceed the trigger value, an alert (mobile text or email) is sent to all the recipients in the distribution list to call for immediate investigation and response.
Each trigger has parameters for configuration. In the case of Multiple-exam DAP alerts, the following can be set:
The vTimeLimit (in seconds) is the upper limit of the procedure duration time
The vKVPLimit (in kV) is the upper limit of kVp level adopted in the procedure
The vExposureLimit (in mAs) is the upper limit of exposure in the procedure
The vKeyword is the indicator of CT perfusion procedures that is contained in the Series Description tag (0008,103E) in DICOM header
The recipients of the email alerts
The title of the email
The contents of the email. In addition to plain text, the user can customize the email with dynamic information items, e.g., {patient_ID}, {Accession}, and {date of exam} so that the email recipient will be supplied with enough information to do further investigation. For instance, given the {Accession} = 123456, the template ‘Exam {Accession} has …’ results in an email content ‘Exam 123456 has ….’
Alert messages contain addressable destinations (email box, cell phone text address, and internal pager text mailbox). In this manner, individualized alerting is permitted, including full national coverage. For internal paging, alerts are sent to Arizona, Florida, and Minnesota from a central database.
As one of the testings, email, and internal pager alerts for 27 most recently performed CT perfusion examinations notified the QA staff of the exact x-ray acquisition employed. This automatic real-time review of all Perfusion Exams provided a validation of the dose employed as recently recommended by the FDA.
Discussion
In 2006, the European SENTINEL project19 carried out an evaluation of the practice of computerized patient records. The importance of recording and analyzing DICOM header information for the audit of radiation dose is echoed in the paper of Vano et al..20 As they pointed out, automatic dose analysis would improve the clinical practice. As also noted, important differences exist among x-ray systems regarding the content and format of dosmetric information. The enormous variability of equipment-specific data, coupled with the evolving and varied software versions in actual use, creates challenges in assembling a universal (multiple location, modality, and device) view of patient-specific or population-wide longitudinal exam parameters (such as radiation exposure or dose).
The wide availability of DICOM-compliant enterprise archives9,21 in the US has enabled the development of a centralized system to manage certain device-specific QA information obtained with medical images. By parsing the DICOM image headers and storing the messages to a database, Prieto et al. automated the detection of exam retakes.22 However, the usage of such a system is limited if vendor equipment-specific data (including custom “shadow” tags) are not considered. The difficulties of handling cross-institutional, multi-modality data are reflected in the work of Laprise et al.,23 where a process involving different roles was defined (Clinical Research Associate, documentation coordinators) to review, classify, and store the exams. However, this process requires considerable human intervention. With DIT, the DICOM images are sent directly from the modality to both the DIT and the PACS, automating the data importing process. The Knowledge Base enables the automatic storage/retrieval of the various information for different modalities and across software versions.
It is believed that DIT is the first implementation that provides a vertically integrated DICOM-compliant solution through information collection to intelligent data analysis/reporting/alerting in a clinical quality assurance context. The system is empowered by a number of IT techniques, including Oracle® database, Oracle Report®, ASP.NET, JavaScript, web, and email server, and it applies the domain knowledge of radiology specialists in dose prescription, estimates, and compliance metrics. DIT provides multiple options to generate patient-centric or population-wide dose reports and alerts. The data pool forms the foundation of evidence-based quality assurance practices and is ready for use in other applications.
The future development of DIT will bring tangible and intangible benefits to the practice of patient care and quality assurance. For example, we are currently conducting two pilot studies: the use of DIT for peak skin dose calculation and localization, and imaging devices efficiency. These will be reported separately.14,18,24 Dose reports for an individual patient may be customized to include the radiation history from all modalities and locations employing DICOM. This goal requires initializing a web call for the Master Patient Index to gather the patient global ID across multiple sites, to be accomplished upon the receipt of access approval from the respective institutional departments. Since DIT provides different data than other patient health information system, integrating DIT with existing Radiology Information System and Healthcare Information System systems will extend the benefits of all systems and will be explored in the future. Other future developments will include the use of business intelligence techniques (forecasting, risk–benefit analysis, optimization, and data mining) which have been successfully applied in other industries (manufacturing and finance service) for web reporting.
Conclusion
Requirements and recommendations from the Joint Commission, FDA, and national, regional, and individual healthcare providers in the US regarding radiation exposure can be addressed using DIT. The contributions of this work are twofold: providing an enterprise system solution for automated dose calculation in a multi-location, multi-modality, and multi-device environment, and forming a basis for evidence-based quality assurance and intelligent analysis regarding radiation dose estimates. Continuing advances with dosimetry analysis are predicated on greater availability of the DICOM Dose SR.
References
- 1.The Joint Commission: The Joint Commission Sentinel Event Policy and Procedures, Oakbrook Terrace, IL, 2007
- 2.Agency for Healthcare Research and Quality, Available at http://www.ahrq.gov/. Accessed 03 January, 2010
- 3.National Quality Measures Clearinghouse. Available at http://www.guideline.gov/browse/xrefnqmc.aspx. Accessed 03 January, 2010 [DOI] [PubMed]
- 4.FDA News Release. ‘FDA makes interim recommendations to address concerns of excess radiation exposure during CT Perfusion’, Dec 7, 2009. Available at http://www.fda.gov/NewsEvents/Newsroom/PressAnnouncements/2009/ucm193190.htm. Accessed 18 January, 2010
- 5.Opreanu RC, Kepros JP. Radiation doses associated with cardiac computed tomography angiography. JAMA. 2009;301(22):2324–2325. doi: 10.1001/jama.2009.764. [DOI] [PubMed] [Google Scholar]
- 6.Brenner DJ, Hall EJ. Computed tomography: an increasing source of radiation exposure. N Engl J Med. 2007;357:2277–2284. doi: 10.1056/NEJMra072149. [DOI] [PubMed] [Google Scholar]
- 7.Amis ES, Jr, Butler PF, Applegate KE, Birnbaum SB, Brateman LF, Hevezi JM, Mettler FA, Morin RL, Pentecost MJ, Smith GG, Strauss KJ, Zeman RK. American College of Radiology white paper on radiation dose in medicine. J. Am Coll Radiol. 2007;4:272–284. doi: 10.1016/j.jacr.2007.03.002. [DOI] [PubMed] [Google Scholar]
- 8.Center for Devices and Radiological Health, U.S. Food and Drug Administration, White Paper: Initiative to Reduce Unnecessary Radiation Exposure from Medical Imaging, 2010. http://www.fda.gov/downloads/Radiation-EmittingProducts/RadiationSafety/RadiationDoseReduction/UCM200087.pdf
- 9.Langer S. Issues Surrounding PACS Archiving to External. Third-Party DICOM Archives. J Digit Imaging. 2009;22(1):48–52. doi: 10.1007/s10278-008-9125-0. [DOI] [PMC free article] [PubMed] [Google Scholar]
- 10.DICOM Structured Report WG-08 and WG-15 Supplement 94, WG-21 CT Dose SR
- 11.Reiner BI. The challenges, opportunities, and imperative of structured reporting in medical imaging. J Digit Imaging. 2009;22(6):1–7. doi: 10.1007/s10278-009-9239-z. [DOI] [PMC free article] [PubMed] [Google Scholar]
- 12.DICOM Standards, available at ftp://medical.nema.org/medical/dicom/2009/, Accessed 23 July, 2010
- 13.Prevedello LM, Sodickson AD, Andriole KP, Khorasani R. IT tools will be critical in helping reduce radiation exposure from medical imaging. J Am Coll Radiol. 2009;6:125–126. doi: 10.1016/j.jacr.2008.11.003. [DOI] [PubMed] [Google Scholar]
- 14.Peter MB, Schueler B, Pavlicek W, Langer S, Wang SS, Hu MQ, Wu T: Quality assurance and radiation dose monitoring for digital mammography using the dose index tracker, 2010. Annual Meeting of the Society for Imaging Informatics in Medicine (SIIM), Minneapolis, Minnesota, June 3–6, 2010
- 15.Yakoumakis E, Tsalafoutas IA, Nikolaou D, Nazos I, Koulentianos E, Proukakis C. Differences in effective dose estimation from dose-area product and entrance surface dose measurements in intravenous urography. Br J Radiol. 2001;74:727–34. doi: 10.1259/bjr.74.884.740727. [DOI] [PubMed] [Google Scholar]
- 16.Einstein AJ, Henzlova MJ, Rajagopalan S. Estimating risk of cancer associated with radiation exposure from 64-slice computed tomography cornoary angiography. JAMA. 2007;298:317–323. doi: 10.1001/jama.298.3.317. [DOI] [PubMed] [Google Scholar]
- 17.The Diagnostic Imaging Council CT Committee: The measurement, reporting, and management of radiation dose in CT, Report No. 96, AAPM, 2008
- 18.Hu M, Pavlicek W, Liu P, Zhang M, Langer S, Wang S, Place V, Miranda R, Wu T: “Efficiency Metrics for Imaging Device Productivity”, revised and resubmitted to RadioGraphics at 07/16/2010 [DOI] [PubMed]
- 19.WORKPACKAGE 4 -Efficacy and safety in high individual dose examination, the European SENTINEL(Safety and Efficacy for New Techniques and Imaging using New Equipment to Support European Legislation) project, http://www.dimond3.org/
- 20.Vano E, Padovani R, Neofotistou V, Tsapaki V, Kottou S, Ten JI, Fernandez JM, Faulkner K: Improving patient dose management using DICOM header information. The European SENTINEL experience. Proceedings of the International Special Topic Conference on Information Technology in Biomedicine. Available at http://medlab.cs.uoi.gr/itab2006/proceedings/Medical%20Imaging/149.pdf, Accessed 22 January 2010
- 21.Langer S, Charboneau N, French T: DCMTB: A virtual appliance DICOM toolbox. J Digit Imaging. http://www.springerlink.com/content/34l2635303wg57l5, 2009 [DOI] [PMC free article] [PubMed]
- 22.Prieto C, Vano E, Ten JI, Fernandez JM, Iniguez AI, Arevalo N, Litcheva A, Crespo E, Floriano A, Martinez D. Image retake analysis in digital radiography using DICOM header information. J Digit Imaging. 2009;22(4):393–399. doi: 10.1007/s10278-008-9135-y. [DOI] [PMC free article] [PubMed] [Google Scholar]
- 23.Laprise NK, Hanusik R, FitzGerald TJ, Rosen N, White KS. Developing a multi-institutional PACS archive and designing processes to manage the shift from a film to a digital-based archive. J Digit Imaging. 2009;22(1):15–24. doi: 10.1007/s10278-007-9080-1. [DOI] [PMC free article] [PubMed] [Google Scholar]
- 24.Khodadadegan Y, Zhang M, Pavlicek W, Paden RG, Chong B, Schueler BA, Fetterly KA, Langer SG, Wu T: Automatic monitoring of localized skin dose with fluoroscopic and interventional procedures. revised and resubmitted to J Digit Imaging at 7/9/2010 [DOI] [PMC free article] [PubMed]


