Abstract
Modern fluoroscopic systems used for invasive cardiology typically acquire digital images in a 1,024 × 1,024 × 12 bits. These images are maintained in the original format while they remain on the imaging system itself. However, images are usually stored using a reduced 512 × 512 × 8-bits format. This paper presents a method for digital analysis of test objects images. The results obtained using image-intensifier and flat-detector systems are given for the original and reduced matrices. Images were acquired using a test object (TO) and a range of polymethyl methacrylate (PMMA) thicknesses from 4 to 28 cm. Adult patient protocols were evaluated for 16–28 cm of PMMA using the image-intensifier system. Pediatric protocols were evaluated for 4–16 cm of PMMA using the flat-detector system. The TO contains disks of various thicknesses to evaluate low contrast sensitivity and a bar pattern to evaluate high-contrast spatial resolution (HCSR). All available fluoroscopic and cine modes were evaluated. Entrance surface air kerma was also measured. Signal-to-noise ratio (SNR) was evaluated using regions of interest (ROI). HCSR was evaluated by comparing the statistical analysis of a ROI placed over the image of the bar pattern against a reference ROI. For both systems, an improvement of approximately 20% was observed for the SNR on the reduced matrices. However, the HCSR parameter was substantially lower in the reduced metrics. Cardiologists should consider the clinical influence of reduced spatial resolution when using the archived images.
Key words: Image quality, test object, matrix size, catheterization, cardiology
Introduction
Most modern X-ray systems used for diagnostic and interventional cardiology acquire images using a 1,024 × 1,024-pixel matrix with a bit depth of 12 bits (1,024 × 1,024 × 12). However, images are typically stored in picture and archiving communication system (PACS) or on CDs or DVDs using a 512 × 512 × 8-bits format.
PACS in cardiology have sometimes been difficult to implement due to the storage and transfer requirements of the large-sized cine files of medical images. Reduced matrix sizes and image compression have been explored as a mean of reducing the costs of managing large image data sets. Lossless data compression methods maintaining the matrix size allow transmitting image information more efficiently while allowing perfect reconstruction. Lossless compression typically reduces the dataset size by a factor of 2 to 4. However, images are typically reviewed at remote workstations using reduced matrix images instead of the original acquired images. Irreversible or “lossy” compression techniques can reduce images by arbitrarily large ratios but do not perfectly reproduce the original images.1
There are several reports dealing with the effect of compression on clinical cardiac images,2–5 but few papers (if any) exist on the effect of different metrics of the images, mainly the reduction from 1,024 × 1,024 and 12 bits matrix (as acquired in the new cardiac systems) to 512 × 512 and 8 bits (as archived in most laboratories).
This paper presents the results of several numerical parameters related to the image quality of a test object (TO) measured during the commissioning and some constancy checks of cardiac X-ray systems. Analysis was performed on images in 1,024 × 1,024 and 12 bits (as acquired) and in the standard reduced format of 512 × 512 and 8 bits.
The word “commissioning” as used in this paper is the process of measurement and evaluation made before clinical use of a new or repaired X-ray imaging system. Commissioning includes setting and verifying automatic configurations to meet the intended uses of that particular piece of equipment. For example, acceptable configurations for a system intended for cardiac use are likely to be different than the same system intended for neuroradiology use. Commissioning extends the evaluation of equipment beyond formal acceptance testing (conformance with specifications). Differences in the results for both formats of the images are discussed for different phantom thicknesses and imaging acquisition modes for a cardiac system equipped with image intensifier (II) and used for adult patients and a system equipped with flat detector (FD) and used for pediatric patients.
Materials and Methods
Two X-ray systems, Siemens model Axiom Artis (Siemens AG, Medical Solutions Erlangen, Germany) used for cardiac catheterization have been employed for this work. The first one is a FC (floor-mounted) equipped with II used for procedures in adult patients, and the second one is a biplane dBC equipped with two FDs dedicated to cardiac procedures in pediatrics. The dose settings for the II system (adult patients) were 32, 36, 45, 170, and 240 nGy/pulse at the entrance of the detector for low, medium, and high fluoroscopy modes and cine low and normal, respectively. The nominal focal size for cine was 0.8 mm. The dose settings for the FD system (pediatrics) were 15, 33, 46, and 174 nGy/pulse for low, medium, and high fluoroscopy and for cine. In this case, the nominal focus size for cine was 0.4 mm.
Experimental details and dosimetric results of these experiments have already been described in the authors’ previous papers6,7 including some analysis of image quality versus entrance surface air kerma (ESAK)8 for adult and pediatric configurations. Polymethyl methacrylate (PMMA) plates were used to build thicknesses of 16, 20, 24, and 28 cm for simulation of adult patients and thicknesses of 4, 8, 12, and 16 cm for simulation of pediatric patients. The ratio between the PMMA and the patient chest thickness can be considered to be approximately 1.5.9 A TO (Leeds TOR 18-FG; http://www.leedstestobjects.com/index.php?module_name=products/product_setup&product_name=TOR18FG&group_name=Fluoroscopy) was positioned at the isocenter and at the middle of the PMMA thickness during all the image acquisitions, thus providing the best geometry to simulate real clinical conditions.
For the adult system and for a PMMA thickness of 20 cm and with the test object at the isocenter, the floor to tabletop distance was 92.5 cm. The table-detector distance was 2.5 cm. The tabletop-to-isocenter distance was 13.5 cm, and the focus-to-detector distance was 64.5 cm. For 24 and 28 cm PMMA, this distance was decreased to 62.5 and 60.5 cm, respectively, to maintain the test object at the isocenter (the table was moved down 2 cm when 4 cm of PMMA was added). The image intensifier was always kept 5 cm from the top side of the PMMA slab (also to simulate clinical working conditions).
For the pediatric system, the table-to-detector distance was 1 cm. The tabletop-to-isocenter distance was 3 cm, and the focus-to-detector distance was 74 cm for 4 cm phantom thickness. For 8, 12, 16, and 20 cm of PMMA, this distance was decreased to 72, 70, 68, and 66, respectively, to maintain the test object at the isocenter (the table was moved down 2 cm when 4 cm of PMMA was added). The FD was always kept 5 cm from the top side of the PMMA slab (also to simulate typical clinical working conditions).
The TO contains a set of 14 line pairs groups for high-contrast spatial resolution (HCSR; with a limit of 5 lp/mm−1) and 18 circles (8 mm diameter, contrast range 0.009 to 0.167 at 70 kVp 1 mm Cu) for low-contrast threshold evaluation. Image quality can be evaluated simply by counting the number of low-contrast details detected and the number of bar patterns resolved or using some numerical calculations selecting the appropriate region of interest (ROI) from the digital imaging and communications in medicine (DICOM) archived images during the experiments.
Images were acquired (in the system equipped with II) for the three fluoroscopy modes: low dose (FLD), normal dose (FND), and high dose (FHD), all with pulsed rate of 15 frames s−1 and two cine modes: low dose (CLD) and normal dose (CND), also set at 15 frames s−1, and 23 cm field of view (FOV). For the system equipped with FD (set for pediatric cardiology), results are presented for only one cine mode (CI) set at the moment of the evaluation in the facility: CI at 30 frames s−1, FOV of 25 cm (diagonal dimension of the field at the entrance of the FD). The pixel size was 184 μm. A flat ionization chamber (model 20 × 6–60) with a 2026C radiation meter from RadCal (http://www.radcal.com) in contact with the PMMA plates was used to measure ESAK with backscatter (BS). The ionization chamber is present in the recorded images together with the TO because the ESAK measurements were made simultaneously to the acquisition of the images.
The acquisition was made in 1,024 × 1,024 matrix size and 12-bits format. Subsequently, it was possible to record and to store the images in two different DICOM formats, 1,024 × 1,024 pixels and 12 bits, or in the (still) most common format for cardiology, 512 × 512 pixels and 8 bits.
Osiris software, version 4.18 (http://www.dim.hcuge.ch/osiris/01_Osiris_Presentation_EN.htm), was used to evaluate the archived DICOM images (cine and fluoroscopy frames). The numerical evaluation of image quality was always done on three different images of the series (numbers 10, 12, and 15), and mean values and standard deviations (SD) of the results are reported. We used the three images to calculate the mean values of the pixel content with their corresponding standard deviations. Later, we used the mean values of the three means and the mean value of the 3 standard deviations to assign the uncertainty. The first images in each series were not used for the analysis because image quality varies until the automatic exposure control (AEC) stabilized the radiographic technique of the generator.
Image quality was evaluated analyzing the low-contrast circles and the HCSR bar groups as the most relevant targets in the test object to characterize image quality in cardiology. A numerical analysis of the signal-to-noise ratio (SNR) was also made for the images archived in both metrics—512 and 1,024.10,11
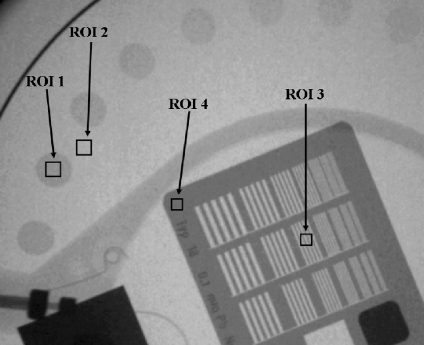
These numerical parameters are defined as (Fig. 1):
 |
1 |
where
BG is the background value, in our case the mean value of the pixel content in a rectangular region of interest (ROI 2) near the low contrast circle number 2 and of the same size as the ROI selected from inside the circle
ROI is the mean value of the pixel content in a rectangular region of interest (ROI 1) inside the circle number 2
SD is the corresponding standard deviation for the pixel content in the selected ROIs, inside and outside circle number 2
Fig 1.
Example of one of the obtained images and how the numerical evaluation was performed. Image corresponds to “cine normal” acquisition mode at the II system, FOV 23 cm, PMMA thickness 16 cm. ROI 1 used for the “signal” and ROI 2 for the background; ROIs 3 to 4 used to evaluate HCSR parameter.
The parameter adopted to evaluate changes in the HCSR was:
 |
2 |
where
SD1 is the standard deviation for the pixel content in the ROI 3 (Fig. 1), inside the eighth group (arbitrary election to facilitate the numerical evaluation) in the central grid of the TO
SD2 is the standard deviation for the pixel content in the ROI 4 (Fig. 1), selected in the periphery of the high contrast groups and representative of the noise in this area
A higher value of HCSR corresponds to a larger SD in ROI 3 (inside the bar pattern) corrected using the SD noise measured in the area with highest attenuation (ROI 4). This parameter has a good correspondence with the visual inspection of the HCSR using magnification in a good computer screen or in a work station monitor, having the advantage that the parameter is evaluated numerically and without the subjective variations of the observers.
Results
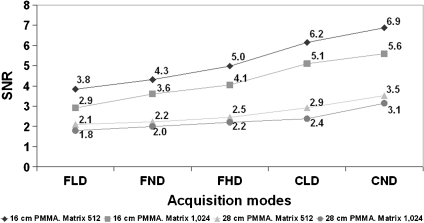
Tables 1 and 2 show the numerical values of the image quality parameters for the images recorded in 512 × 512 and 1,024 × 1,024 metrics, respectively. Figure 2 shows the values of SNR for the thicknesses of 16 and 28 cm of PMMA and for the two matrix metrics measured for the low contrast circle 2 in all the operation modes during the experiment (II system set for adult patients). Mean values and standard deviations are indicated in Table 1.
Table 1.
ESAK with BS, Tube Potential (Peak Kilovoltage), and Added Filtration (Millimeter Cu), SNR, and HCSR Parameter for All the Acquisition Modes and All PMMA Thicknesses Used in the II X-ray System (Adult Patients Protocol)
| PMMA (cm) | Acquisition mode | ESAK (µGy/fr) | Tube potential (kVp) | Filter (mm Cu) | SNR for matrix 512 (for circle 2) | SNR for matrix 1,024 (for circle 2) | HCSR for matrix 512 (for 8th group of the central grid) | HCSR for matrix 1,024 (for 8th group of the central grid) |
|---|---|---|---|---|---|---|---|---|
| 16 | FLD | 5.2 | 66 | 0.6 | 3.8 ± 0.3 | 2.9 ± 0.2 | 3.3 ± 0.4 | 56.8 ± 3.1 |
| 16 | FND | 5.9 | 66 | 0.6 | 4.3 ± 0.1 | 3.6 ± 0.1 | 3.4 ± 0.1 | 60.7 ± 3.4 |
| 16 | FHD | 7.3 | 66 | 0.6 | 5.0 ± 0.6 | 4.1 ± 0.4 | 3.1 ± 0.6 | 56.5 ± 9.3 |
| 16 | CLD | 39.4 | 64 | 0.6 | 6.2 ± 0.5 | 5.1 ± 0.3 | 3.2 ± 0.3 | 60.0 ± 1.5 |
| 16 | CND | 56.0 | 64 | 0.6 | 6.9 ± 0.5 | 5.6 ± 0.6 | 3.7 ± 0.1 | 66.9 ± 1.5 |
| 20 | FLD | 13.1 | 72 | 0.3 | 3.3 ± 0.1 | 2.6 ± 0.2 | 1.8 ± 0.7 | 34.6 ± 6.3 |
| 20 | FND | 16.5 | 68 | 0.3 | 4.4 ± 0.2 | 3.3 ± 0.4 | 2.7 ± 0.3 | 46.6 ± 3.2 |
| 20 | FHD | 19.6 | 68 | 0.3 | 4.2 ± 0.2 | 3.4 ± 0.1 | 3.3 ± 0.3 | 54.1 ± 3.5 |
| 20 | CLD | 112.0 | 66 | 0.3 | 6.0 ± 0.8 | 4.9 ± 0.3 | 2.6 ± 0.1 | 50.0 ± 5.2 |
| 20 | CND | 177.0 | 68 | 0.3 | 5.9 ± 0.5 | 5.4 ± 0.6 | 2.9 ± 0.1 | 54.6 ± 0.7 |
| 24 | FLD | 18.9 | 74 | 0.3 | 3.0 ± 0.5 | 2.5 ± 0.5 | 1.9 ± 0.2 | 31.7 ± 1.1 |
| 24 | FND | 23.4 | 68 | 0.3 | 3.4 ± 0.1 | 2.9 ± 0.1 | 2.4 ± 0.7 | 44.4 ± 7.6 |
| 24 | FHD | 27.7 | 68 | 0.3 | 3.6 ± 0.1 | 3.0 ± 0.1 | 2.8 ± 0.3 | 50.6 ± 1.4 |
| 24 | CLD | 201.0 | 68 | 0.3 | 5.5 ± 0.2 | 4.5 ± 0.2 | 2.8 ± 0.2 | 49.0 ± 2.1 |
| 24 | CND | 291.0 | 70 | 0.3 | 5.3 ± 0.2 | 4.7 ± 0.3 | 2.6 ± 0.4 | 47.0 ± 1.6 |
| 28 | FLD | 49.9 | 81 | 0.2 | 2.1 ± 0.1 | 1.8 ± 0.1 | 1.2 ± 0.3 | 18.6 ± 3.8 |
| 28 | FND | 79.6 | 78 | 0.2 | 2.2 ± 0.1 | 2.0 ± 0.1 | 1.9 ± 0.3 | 32.1 ± 2.3 |
| 28 | FHD | 85.5 | 82 | 0.2 | 2.5 ± 0.1 | 2.2 ± 0.2 | 1.3 ± 0.3 | 23.4 ± 0.7 |
| 28 | CLD | 385.0 | 83 | 0.2 | 2.9 ± 0.4 | 2.4 ± 0.2 | 1.1 ± 0.2 | 19.0 ± 1.5 |
| 28 | CND | 672.0 | 86 | 0.2 | 3.5 ± 0.2 | 3.1 ± 0.3 | 1.3 ± 0.1 | 21.1 ± 1.6 |
FOV 23 cm
Table 2.
ESAK with BS, Tube Potential (Peak Kilovoltage), and Added Filtration (Millimeter Cu), SNR, and HCSR Parameter for Cine Mode and All PMMA Thicknesses Used in the FD X-ray System (Pediatric Patients Protocol)
| PMMA (cm) | Acquisition mode | ESAK (µGy/fr) | Tube potential (kVp) | Filter (mm Cu) | SNR for matrix 512 (for circle 2) | SNR for matrix 1,024 (for circle 2) | HCSR for matrix 512 (for 8th group of the central grid) | HCSR for matrix 1,024 (for 8th group of the central grid) |
|---|---|---|---|---|---|---|---|---|
| 4 | CI | 2.1 | 62 | 0.9 | 8.9 ± 0.1 | 7.0 ± 0.2 | 6.9 ± 0.1 | 128.0 ± 1.4 |
| 8 | CI | 5.8 | 63 | 0.6 | 8.2 ± 0.9 | 6.7 ± 0.2 | 6.6 ± 0.1 | 118.5 ± 3.0 |
| 12 | CI | 24.9 | 67 | 0.3 | 6.9 ± 0.2 | 5.5 ± 0.4 | 5.7 ± 0.1 | 102.2 ± 1.4 |
| 16 | CI | 44.8 | 68 | 0.2 | 6.6 ± 0.1 | 5.4 ± 0.2 | 5.3 ± 0.2 | 95.7 ± 1.2 |
FOV 25 cm
Fig 2.
SNR for all the operation modes and for 16 and 28 cm PMMA thickness. II system, FOV 23 cm, and matrix sizes of 512 and 1,024.
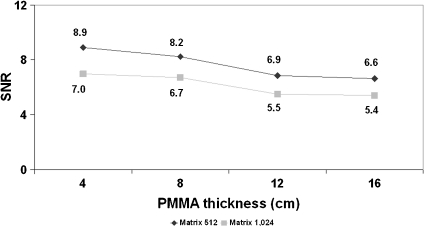
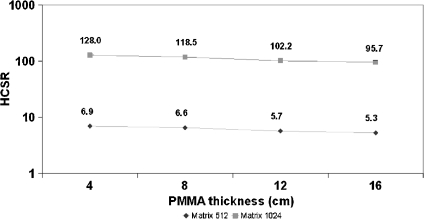
Figure 3 shows the values of SNR measured in the images of the FD system for circle 2 in the cine mode and for the thicknesses of 4, 8, 12, and 16 cm of PMMA, used with the pediatric protocol. Mean values and standard deviations are indicated in Table 2.
Fig 3.
SNR for cine mode and for 4 to 16 cm PMMA thickness. FD system, FOV 25 cm, and matrix sizes of 512 and 1,024.
The ratios between SNR values for 512 and 1,024 resulted between 1.09 and 1.32 for all the thicknesses and operation modes evaluated for the II system (mean value of 1.20 with SD of 0.06). As for the cine images acquired with the FD, the ratios for the different pediatric thicknesses resulted similar with a mean value of 1.24 and SD of 0.02.
A statistical analysis was performed using both the adult images (N = 60) and pediatric images (N = 12) using the Student t test (SPSS 11 software; www.spss.com) This analysis demonstrated p values <0.05 in all cases for both parameters SNR and HCSR, concluding that differences in image quality can be considered statistically significant.
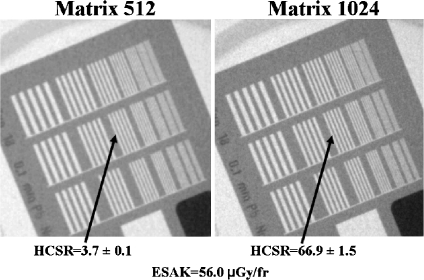
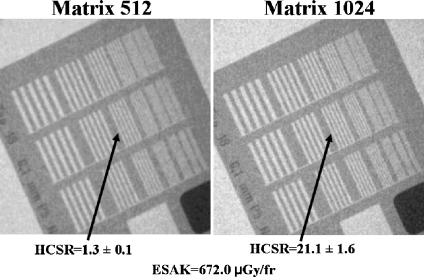
Figures 4 and 5 show examples of the high-contrast bar groups obtained with the II system for cine (“normal” dose operation mode) and thicknesses of 16 and 28 cm PMMA (simulating adult patients), respectively. The values of the numerical parameter used to measure the HCSR in the group 8 and the ESAK are shown in the figures. Note that the highest noise in the image was obtained with 28 cm (instead the ESAK increase) and the lowest value of the HCSR parameter.
Fig 4.
HCSR. Cine acquisition in “normal dose” mode and 16 cm PMMA thickness. II system, FOV 23 cm. Visual HCSR limit 11 groups (1.6 lp/mm) on the left and 13 (2.0 lp/mm) on the right.
Fig 5.
HCSR. Cine acquisition in the “normal dose” mode and 28 cm PMMA thickness. II system, FOV 23 cm. Visual HCSR limit ten groups (1.4 lp/mm) on the left and 12 (1.8 lp/mm) on the right.
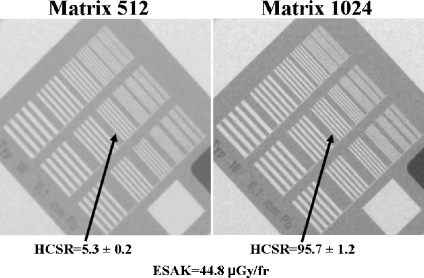
Figure 6 shows the values of the numerical parameter used to measure the HCSR in the group 8 for cine operation mode and 16 cm PMMA thickness (pediatric protocol) in the FD system. The visual HCSR limit is determined by the observer as the group of bars where it is still possible to clearly differentiate the black and white lines. The values of the numerical parameter used to measure the HCSR and the ESAK are also shown in the figures.
Fig 6.
HCSR. Cine acquisition (single mode) and 16 cm PMMA. FD system, FOV 25 cm. Visual HCSR limit 11 groups (1.6 lp/mm) on the left and 13 (2.0 lp/mm) on the right.
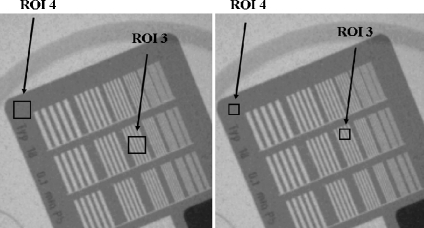
For the evaluation of the HCSR parameter, the selection of the ROI size and its position is quite critical. Table 3 presents the results obtained with three attempts (see Fig. 7) to evaluate the modification in the obtained results with these changes.
Table 3.
Example of the Variation of the HCSR Parameter with ROI Size and Position for Three Acquisition Modes
| PMMA (cm) | Acquisition mode | HCSR for 8th group of the central grid. ROI size 100 pixels | HCSR for 8th group of the central grid. ROI size 256 pixels | HCSR for 8th group of the central grid. ROI size 100 pixels, after changing the position of the ROI |
|---|---|---|---|---|
| 16 | FLD | 3.3 ± 0.4 | 3.5 ± 0.1 | 2.9 ± 0.3 |
| 16 | FND | 3.4 ± 0.1 | 3.6 ± 0.2 | 3.3 ± 0.3 |
| 16 | CND | 3.7 ± 0.1 | 4.4 ± 0.2 | 3.5 ± 0.2 |
All images obtained with thickness 16 cm PMMA, FOV 23 cm, and matrix size 512 in the II system, using the adult patient protocol
Fig 7.
HCSR. Image corresponds to cine “normal mode”, FOV 23 cm, PMMA thickness 16 cm. Example for two different ROIs sizes and different positions.
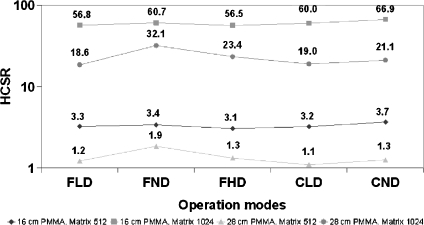
Figure 8 shows the values of the HCSR (1,024 and 512 metrics) parameter for the different operation modes and thicknesses of 16 and 28 cm PMMA for the II system. Figure 9 shows the results for the different thicknesses used to evaluate the pediatric protocol in the FD system.
Fig 8.
HCSR parameter for all the operation modes; 16 and 28 cm PMMA. II system, FOV 23 cm.
Fig 9.
HCSR parameter for cine mode; 4 to 16 cm of PMMA. FD system and FOV 25 cm.
Discussion
According to the numerical parameters calculated from the images of the Leeds TO, there are no important differences between FD and II systems for the common PMMA thickness evaluated in both systems (16 cm). The ESAK values per cine frame (see Tables 1 and 2) are also similar, 39–56 µGy for the two cine modes measured with the II system using the adult protocol and 45 µGy for the single cine mode set at the FD system for the pediatric protocol. Both X-ray systems, independent of matrix size used, show the same trend in their values of SNR.
In any case, results for the FD system (set for pediatric cardiac procedures) are not comparable to the II system (set for adult cardiac examinations) because the systems are using different automatic exposure control curves. For example, at 16 cm of PMMA, the pediatric system (FP) automatically selected 0.2 mm of Cu while the adult system (II) selected 0.6 mm Cu. The operating kVs also differed.
SNR results, as expected, were better for the 512 matrix size (and 8 bits) in comparison to the 1,024 matrix size (and 12 bits). SNR increased for different acquisition modes (Fig. 2; higher ESAK per frame involves an improvement in both image quality parameters) and decreased with increasing PMMA thickness (Fig. 3).
Tables 1 and 2 permit adjustments of scale factors for different modes of operation and different PMMA thicknesses. Using a mean value for SNR of 1.20 with a SD of 0.06 for the II system and 1.24 with a SD of 0.02 for the FD system roughly demonstrates a 22% improvement in SNR when reducing the matrix size from 1,024 × 1,024 to 512 × 512.
The critical issue with the metrics of 512 × 512 (8 bits) in comparison to the acquisition matrix size of 1,024 × 1,024 (and 12 bits) is the degradation in the spatial resolution. Figures 4, 5, and 6 demonstrate (also visually) this degradation. A factor around 20 in the defined numerical parameter is shown in Tables 1 and 2 for cine modes and for the different measured thicknesses of PMMA. Of course the size and the position of the ROI could be quite critical for the evaluation of the defined parameter, but Table 3 and Figure 7 show reasonable SD in the obtained values after several evaluations with slight changes in the ROI size and position. If the evaluation of the HCSR parameter is done in other bar group (number ninth instead of eighth), this ratio around 20 is maintained.
Using the HCSR parameter defined in this paper, Figure 8 confirms that spatial resolution does not depend very much on the acquisition mode (and increase of ESAK values). The dependence of HCSR on PMMA thicknesses is not dramatic because of the good performance of the AEC systems; nevertheless, a slight decrease in HCSR is evident (Fig. 9) when increasing the PMMA thickness. The SNR (low contrast sensitivity) is more sensitive to the acquisition mode (noise in the images) than the HCSR. The mechanism to decrease resolution when increasing the PMMA thickness is the increase of scatter radiation.
The numerical evaluation of the HCSR is not easy in digital imaging. It depends on several factors: monitor used, time consumed by cardiologists (or radiologists or medical physicists) using magnification and the best window and level, distance to the monitor, ambient light in the room, experience of the observer, etc. Except for very big changes in the image quality, the high-contrast resolution in line pairs per millimeter is quite constant for the different modes of image acquisition, and changes are only perceptible (with the test object used in the experiment) when electronic magnification (changing the field of view) is applied or with the two matrix sizes are compared. The numerical parameter selected to evaluate the HCSR enables correlation of the differences between the SD of the content of pixels in the selected ROI (more difference in pixel content, more spatial resolution and higher SD) and the SD existing in the “background” ROI. The latter one decreases with more dose per frame or for lower phantom thicknesses. Thus, still if not visually appreciated by the observer, if this numerical parameter is higher, the HCSR will be better. Small observable differences in HCSR can be quantified using the proposed numerical parameter.
Conclusions
Based on our analysis, compressed image files in 512 × 512 and 8 bits (the present standard archiving for cardiac images) can be used during the commissioning and quality control of cardiac systems, by taking into account the scaling factors needed to compare these images with the standard acquisition size of 1,024 × 1,024 and 12 bits. SNR will be improved in the compressed image (in around 22% in our experiment), whereas the HCSR parameter (as defined in this paper) will be decreased in a factor around 20.
Cardiologists should consider this degradation in image quality (loss in spatial resolution) when reviewing in a 512 × 512 and 8-bits format. If visualization of small arteries is required, images should be archived in the original acquisition format of 1,024 × 1,024 and 12 bits. In any case, further studies on patients should confirm the differences in image quality considering the limitations of this study made on a test object without taking into account the anatomic structure of the arteries and their movement during clinical procedures.
Acknowledgments
One of the authors (EV) acknowledges the support of the Spanish grant FIS2006-08186 (Ministry of Science and Innovation).
References
- 1.Erickson BJ: Irreversible Compression of Medical Images. White Paper-Irreversible Compression of Medical Images. 2000. Available at: www.scarnet.org/WorkArea/showcontent.aspx?id=1208. Accessed 29 August 2009
- 2.Silber S, Dörr R, Zindler G, Mühling H, Diebel T. Impact of various compression rates on interpretation of digital coronary angiograms. Int J Cardiol. 1997;60:195–200. doi: 10.1016/S0167-5273(97)00105-8. [DOI] [PubMed] [Google Scholar]
- 3.Brennecke R, Bürgel U, Simon R, Rippin G, Fritsch HP, Becker T, Nissen SE. American College of Cardiology European Society of Cardiology/International Study of Angiographic Data Compression Phase III: measurement of image quality differences at varying levels of data compression. J Am Coll Cardiol. 2000;35:1388–1397. doi: 10.1016/S0735-1097(99)00655-5. [DOI] [PubMed] [Google Scholar]
- 4.Kerensky RA, Cusma JT, Kubilis P, Simon R, Bashore TM, Hirshfeld JW, Jr, Holmes DR, Jr, Pepine CJ, Nissen SE. American College of Cardiology/European Society of Cardiology International Study of Angiographic Data Compression Phase I: the effect of lossy data compression on recognition of diagnostic features in digital coronary angiography. J Am Coll Cardiol. 2000;35:1370–1379. doi: 10.1016/S0735-1097(99)00610-5. [DOI] [PubMed] [Google Scholar]
- 5.Nissen SE, Hirshfeld JW, Jr, Simon R. Introduction and background: the International Angiographic Compression Study. J Am Coll Cardiol. 2000;35:1367–1369. doi: 10.1016/S0735-1097(00)00544-1. [DOI] [PubMed] [Google Scholar]
- 6.Vano E, Geiger B, Schreiner A, Back C, Beissel J. Dynamic flat panel detector versus image intensifier in cardiac imaging: dose and image quality. Phys Med Biol. 2005;50:5731–5742. doi: 10.1088/0031-9155/50/23/022. [DOI] [PubMed] [Google Scholar]
- 7.Martinez LC, Vano E, Gutierrez F, Rodriguez C, Gilarranz R, Manzanas MJ. Patient doses from fluoroscopically guided cardiac procedures in pediatrics. Phys Med Biol. 2007;52:4749–4759. doi: 10.1088/0031-9155/52/16/003. [DOI] [PubMed] [Google Scholar]
- 8.ICRU International Commission on Radiological Units and Measurements: Patient dosimetry for x rays used in medical imaging ICRU Report 74 (J. ICRU 5 (2)), 2005
- 9.Rassow J, Schmaltz AA, Hentrich F, Streffer C. Effective doses to patients from paediatric cardiac catheterization. Br J Radiol. 2000;73:172–183. doi: 10.1259/bjr.73.866.10884731. [DOI] [PubMed] [Google Scholar]
- 10.Gagne RM, Boswell JS, Myers KJ. Signal detectability in digital radiography. spatial domain figures of merit. Med Phys. 2003;30:2180–2189. doi: 10.1118/1.1578485. [DOI] [PubMed] [Google Scholar]
- 11.Muhogora WE, Devetti A, Padovani R, Msaki P, Bonutti F. Application of European protocol in the evaluation of contrast-to-noise ratio and mean glandular dose for two digital mammography systems. Radiat Prot Dosim. 2008;129:231–236. doi: 10.1093/rpd/ncn023. [DOI] [PubMed] [Google Scholar]


