

Abstract
Ligand–protein docking is increasingly used in Drug Discovery. The initial limitations imposed by a reduced availability of target protein structures have been overcome by the use of theoretical models, especially those derived by homology modeling techniques. While this greatly extended the use of docking simulations, it also introduced the need for general and robust criteria to estimate the reliability of docking results given the model quality. To this end, a large-scale experiment was performed on a diverse set including experimental structures and homology models for a group of representative ligand–protein complexes. A wide spectrum of model quality was sampled using templates at different evolutionary distances and different strategies for target–template alignment and modeling. The obtained models were scored by a selection of the most used model quality indices. The binding geometries were generated using AutoDock, one of the most common docking programs. An important result of this study is that indeed quantitative and robust correlations exist between the accuracy of docking results and the model quality, especially in the binding site. Moreover, state-of-the-art indices for model quality assessment are already an effective tool for an a priori prediction of the accuracy of docking experiments in the context of groups of proteins with conserved structural characteristics.
Keywords: molecular docking, drug discovery, homology modeling, model quality assessment, model quality indices
Introduction
Computational simulations of ligand–protein docking are an important component of drug discovery. They are extensively used in virtual screening of large databases of compounds for hit identification and in the evaluation of the effects of chemical modifications during lead optimization.1,2 Their use is often limited by the availability of target protein structures. In fact, although in the last years structural genomics projects have greatly contributed to a rapid growth of representative structures in the PDB,3 a huge gap still exists between known annotated sequences and 3D structures.4 Indeed, for the majority of disease-related proteins, there is no experimental structure and ligand docking can only be performed on theoretical models.
Only recently, advances in sequence comparison, fold recognition, and protein-modeling algorithms have increased greatly the performance of protein structure prediction and, consequently, nowadays experimental structure determination and modeling complement each other in the exploration of the protein structure space.5,6 Additionally, an increasing number of fully automated servers and model databases are offering modeling services to the biomedical research community.6–8
Among the different proposals for structure prediction, homology (or comparative) modeling is still the most widely used. As it is based on template-driven modeling, it benefits extensively from structural genomics projects and the increasing availability of representative structures.
As shown in recent reviews, homology modeling techniques have already made significant contributions at different stages of the drug discovery process, including ligand docking.9–11 On the other hand, owing to the strong dependence of docking results on the accuracy of protein structure, the use of good quality models is crucial for such studies. With this in mind, the problem of identifying the relationship between model quality and docking performance was investigated in some specific cases of high throughput screening.11–15 In these studies, the accuracy of the models was indirectly estimated only by the sequence identity with the template, whereas the docking performance was quantified in terms of enrichment of known active compounds against a background. A wide range of trends was obtained and a clear relationship between sequence identity and enrichment factor was not observed. However, a generally accepted “rule” emerged: models built with more than 50% sequence identity with the template are accurate enough for docking studies,9,10,14 as they are usually able to globally reproduce the reference structure with high accuracy.
Although overall model quality is indeed related to the expected structural divergence between template and target,16 the above rule is not always valid when applied to docking experiments, because additional factors play a role in determining the actual accuracy of a modeled structure. In particular, the accuracy is mainly affected by two steps of the modeling procedure: the selection of the most informative template(s)17,18 and the generation of an optimal alignment of template(s) and target.19,20 Moreover, several studies were based on the hypothesis that the global root mean square deviation (RMSD) of the model from the experimental structure can be directly related to the ability of docking methods to reproduce the ligand pose in a specific binding site. This hypothesis has never been rigorously demonstrated. A globally correct model can indeed include a bad description of the active site.
From these observations it clearly emerges that deriving general relationships between model quality and docking accuracy is central to an effective use of docking simulations. In the most desirable scenario, docking accuracy would be predicted directly from the quality of the protein model. To the knowledge of the authors, no study has already solved this problem.
Standard indices to measure the quality of models with reference to the experimental structures5 could be used for identifying an existing correlation between model quality and docking accuracy, whereas indices of quality assessment, without knowledge of the native structure, could provide knowledge-based rules for directly predicting the quality of docking results. Indeed, due to the importance and potential of such indices for structure prediction, new methods have been recently developed and a new prediction category, “model quality assessment,” was introduced since the seventh edition of the Critical Assessment of Techniques for Protein Structure Prediction (CASP) experiment,21 but their potential in ligand–protein docking has still to be tested and exploited.
The aim of this article was to investigate the relationships between the accuracy of ligand docking into homology models and the quality of the models, and to verify if state-of-the-art indices for model quality assessment can be regarded as reliable tools also for direct and a priori prediction of the accuracy of docking simulations.
To this end, a large test set derived from a representative group of protein–ligand complexes with known experimental structures was selected and, for each protein, a series of homology models was developed and evaluated. To obtain a wide spectrum of model quality, models were generated by sampling different evolutionary distances in the template space and by using different strategies for both target-template alignment and modeling. Finally, the ligand-binding poses obtained by molecular docking calculations on the whole test set were evaluated.
Methods
Reference Set of Protein–Ligand Complexes
The test set is composed of a reference group of X-ray protein structures and of a corresponding dataset of theoretical models (see Homology modeling and model quality indices section). The reference group was chosen from structures included in the CCDC/Astex Test Set,22 a large and diverse set of known protein–ligand complexes developed for validating docking methods. A subset with resolution of 2.0 Å or better was extracted and it was further pruned by excluding: structures containing cofactor molecules, more than one ligand, or metal ions in the binding site; proteins whose binding site is defined by more than one chain; and multiple entries of the same protein. Moreover, complexes containing ligands with more than 10 rotatable bonds were excluded to reduce the CPU time needed for docking. The resulting reference set includes 21 structures (see Table 1).
Table 1.
Test Set Composition.
| Complex PDB ID (chain ID) | Protein name | No. of residues | CATH ID | Ligand ID | Template PDB ID | Seq_Id (%) |
|---|---|---|---|---|---|---|
| 1A28 (A) | Progesterone receptor | 256 | 1.10.565.10 | STR | 1NQ7 1YUC 2AM9 |
17 21 55 |
| 1A4Q(A) | Neuraminidase | 390 | 2.120.10.10 | DPC | 1V0Z 2BAT 2HT5 2HTV |
31 32 35 37 |
| 1ABF | L-arabinose binding protein | 306 | 3.40.50.2300 | FCA | 1TLF 2DRI 2GBP |
18 21 22 |
| 1C83 (A) | Protein-tyrosine Phosphatase 1B | 298 | 3.90.190.10 | OAI | 1RPM 2GJT |
34 37 |
| 1CBS | Cellular retinoic-acid-binding protein type II | 137 | 2.40.128.20 | REA | 1MDC 2FT9 3IFB 1FTP 1CBI |
24 27 30 38 77 |
| 1EJN (A) | Urokinase-type plasminogen activator | 253 | 2.40.10.10 | AGB | 1OP8 1PPF 1ELT 1YBW |
23 26 33 38 |
| 1ETA (1) | Transthyretin (prealbumin) | 127 | 2.60.40.180 | T44 | 1OO2 1TFP 1IE4 |
56 79 84 |
| 1FEN | Retinol binding protein | 183 | 2.40.128.20 | AZE | 1EXS 1IIU |
21 82 |
| 1LST | Lysine-, arginine-, ornithine-binding protein | 239 | 3.40.109.10 | LYS | 1XT8 1GGG 1HSL |
25 30 71 |
| 1MLD (A) | Malate dehydrogenase | 314 | 3.40.50.720 | CIT | 1I0Z 2LDX 6LDH 1HYG 1SMK 1EMD |
19 23 24 27 56 59 |
| 1MRG | α-Momorcharin | 263 | 3.40.420.10 | ADN | 1QI7 1WUC 1ABR 1HWM 1CF5 1MRJ 1BRY 1NIO |
24 29 33 36 53 64 66 70 |
| 1MRK | α-Trichosanthin | 247 | 3.40.420.10 | FMC | 1R4P 1RL0 1APA 2MLL 1RTC 1NIO 1CF5 1MRG |
17 22 29 33 37 60 62 64 |
| 1ROB | Ribonuclease A | 124 | 3.10.130.10 | C2P | 1OJ1 1DYT 1ONC 1B1I 1AGI 1RNF 1Z7X |
27 28 30 32 36 42 70 |
| 1SRJ (A) | Streptavidin | 121 | 2.40.128.30 | NAB | 1WBI 1Y52 |
27 30 |
| 1TNG | Trypsin | 229 | 2.40.10.10 | AMC | 1QY6 1A7S 1FIW 1YBW 2F91 1HJ8 1H4W 1A0J 1TRN 2A31 |
15 30 34 38 43 66 73 74 75 82 |
| 1UKZ | Uridylate kinase | 203 | 3.40.50.300 | AMP | 1G3U 1GKY 1AKE 1Z83 1TEV 1UKE |
17 23 28 44 48 52 |
| 2AK3 (A) | Adenylate kinase isoenzyme-3 | 226 | 3.40.50.300 | AMP | 1MV5 1VHL 1TEV 1Z83 1UKE 2AK2 2AKY 2AR7 |
18 19 25 26 27 40 41 58 |
| 3CLA | Chloramphenicol Acetyltransferase | 213 | 3.30.559.10 | CLM | 1NOC | 47 |
| 3ERT (A) | Estrogen receptor alpha | 261 | 1.10.565.10 | OHT | 1NQ7 1PK5 |
21 24 |
| 6RNT | Ribonuclease T1 | 104 | 3.10.450.30 | 2AM | 1RMS | 65 |
| 7TIM (A) | Triosephosphate isomerase | 247 | 3.20.20.70 | PGH | 1B9B 1R2R 1WYI 1MO0 |
43 53 53 54 |
The first five columns report the characteristics of the ligand-protein complexes in the reference set of X-ray structures; the last two columns refer to the templates selected for homology modeling and their sequence identities with the target.
Some of the proteins in the selected reference set are relevant drug targets: the neuraminidase from influenza virus (1A4Q), the protein-tyrosine phosphatase 1B (1C83), that is a therapeutic target in several diseases, including diabetes, cancer, and inflammation, the urokinase-type plasminogen activator (1EJN), whose inhibition represents a promising target for antimetastatic therapy, the acetyltransferase that catalyzes the O-acetylation of the antibiotic chloramphenicol (3CLA), and the progesterone and estrogen receptors (1A28 and 3ERT).
Homology Modeling and Model Quality Indices
Two different strategies were employed to generate the modeling dataset: a fully automated modeling method, which employs a prediction server, and a traditional homology modeling procedure. This consists of three major steps: identification of candidate template structures, alignment of target to the template, and structural modeling of the target on the template structure.
The choice of the programs for each step and the details of the protocol for the traditional homology modeling procedure were based on recent assessments of homology model strategies20 and template selection strategies,17 to reproduce standard homology modeling experiments as well as to obtain a large range of model quality.
Identification of candidate templates was performed by sequence similarity search using PSI-BLAST23 with default parameters until convergence was reached. Each target was searched against a database of all proteins of known structure from the NCBI database. The resulting candidate lists were reduced by elimination of all hits having low statistical significance (BLAST E-value greater than 0.01) or alignment length shorter than 85% of the target sequence. A statistical analysis on the distribution of sequence identities between target and template was performed and the final subset of template candidates was selected in order to provide a reliable sampling of different evolutionary distances. In order to avoid backbone modeling errors in the binding site, all the selected templates do not contain gaps in the alignment of the active site region, this being defined as the list of residues with at least one atom within 4 Å of any of the ligand atoms. This step clearly reduced the candidate template lists (e.g., 6RNT where only one template remained), but it did not result in the complete exclusion of any of the original targets.
Alignments of target and template sequences were performed with three independent tools. T-Coffee24 was used for obtaining both single and multiple sequence alignments; this method carries out a progressive alignment driven by all the pairwise local and global sequence alignments. PRALINE, a dynamic programming-based method that employs a profile-based progressive sequence alignment protocol,25 was employed for multiple-template alignments. Finally, TM-align, a method to identify the best structural alignment between protein pairs that combines the TM-score rotation matrix and dynamic programming,26 was used for generating single-template structural alignments.
As a result, for each target sequence two single-template models for each template as well as two multiple-template models were generated, for a total of 224 models.
Model construction was performed by using MODELLER 9v1,27 which implements an approach to comparative modeling by satisfying spatial restraints derived from the alignment of the target sequence with the template structure. The restraints, which are obtained empirically from a database of protein structure alignments and CHARMM energy terms,28 are combined into an objective function. The resulting model was obtained by optimizing the objective function, employing methods of conjugate gradients and molecular dynamics with simulated annealing, as implemented in the standard MODELLER protocol.
For each target, an additional model was generated by using the automated server I-TASSER, that was ranked as the best method in the server section of the latest CASP experiments.29 I-TASSER is a hierarchical protein structure modeling approach based on the secondary structure–enhanced profile–profile threading alignment (PPA) and the iterative implementation of the threading assembly refinement (TASSER) program.30,31
The final dataset included 245 theoretical models covering a wide range of quality. The quality of a theoretical model can be measured by the degree of structural similarity to the native structure, but this implies the availability of the “answer” to the modeling problem. When this is not the case, the quality is estimated by comparison to the template structure and by conformity to average properties of known protein structures. Recently, new approaches based on machine learning have been proposed to predict model quality, especially in the field of protein structure prediction.
In this study, models were assessed both by direct comparison to the known native structures (we will refer to this class of indices as “calculated” indices) and by using indices for model quality estimation and prediction (“predicted” indices).
Direct comparison to the native structure was obtained by structural alignment using two programs: DALILite32 and LGA.33 The former generates a global alignment by optimization of both the number of structurally aligned residues and the overall RMSD of their corresponding C-α atoms. The latter generates many different local superimpositions to detect regions where proteins are similar, providing a combination of two sets of scores for local/global alignment (LGA).
According to the structural alignment results, the global quality of the models was measured by six indices: the RMSD on C-α atoms included in the final DALI structural alignments; the statistical significance of these alignment (DALI_Zscore) compared to a set of unrelated proteins32; the two LGA Global Distance Test (GDT) scores (GDT_TS, with C-α distance cut-off values of 1, 2, 4, and 8 Å for the deviation from the target, and GDT_HA, with cut-off values of 0.5, 1, 2, and 4 Å)5; the LGA_S combined score (see ref. 33 for a detailed description); and the RMSD of the residues superimposed under the distance cut-off of 4 Å by LGA (LGA_RMSD).
The local quality was measured by three indices: the site RMSD based on DALI alignments (RMSD-s), the residues in the active site being defined as the ones with at least one atom within 4 Å of any of the ligand atoms; the dRMSD (distance RMSD) among the heavy atoms of the sidechains in the active site (dRMSD-s); and the atomic contact score (ACS), which evaluates the number of reproduced contacts between the heavy atoms of protein and ligand, after a local superimposition of the model onto the target structure.5 The dRMSD is generally defined as the RMSD between the corresponding atomic distances in two structures:
where a and b are the labels of the two structures, d the distance vectors, i and j the indices of the atoms, and N is the number of comparisons performed; for the dRMSD-s the sum is only performed over the heavy atoms of the sidechains in the active site. Therefore, this index only records the deviation in the relative positions of the sidechains and it is a suitable complement to the RMSD-s that conversely describes the absolute deviation from the crystallographic geometry.
The ACS evaluates the fraction of the correctly modeled atomic contacts and penalizes the clashes between the modeled binding site atoms and the ligand atoms:
where Cont is the number of contacts and Clash is the number of clashes in the crystallographic (X-ray) and model (m) structures. The units are in Å.
Additionally the model DALI_Zscore was normalized by the Z-score of structural alignment between model and template (DALI_Zratio). This measure reflects the degree of modeling success as the efficiency to reproduce the native better than the structure template.20
Since the choice of the template greatly affects the modeling results,17 indices that evaluate the model–template similarities were considered in the class of “predicted” indices. On the basis of the T-Coffee alignments, the percentage of sequence identity and similarity for the whole length (Seq_Id, Seq_Sim) and for the active site (Seq_Id-s, Seq_Sim-s) were calculated for each target–template alignment. By employing DALILite and LGA the following indices were also calculated for the model–template structural alignments: RMSD(t), RMSD-s(t), LGA_RMSD(t), LGA_S(t).
Complementary to these indices is the set of “predicted” indices derived by geometrical analysis of the models performed by submission to the protein structure validation software (PSVS) web server.34 This server integrates analyses from several widely-used structure quality evaluation tools, including among the others: PROCHECK,35 Verify3D,36 ProsaII,37 MolProbity.38 From the extensive output of the server, the following indices were chosen for our analysis: Z-scores from ProsaII, Verify3D, MolProbity, and the Procheck(phi, psi) index (Procheck). A detailed description of the single indices can be found in the original papers.
Among the recent proposals for model quality assessment, two successful methods were included in our analysis as representative of this class of indices: ProQ and ModFOLD. The model quality assessment program ProQ39 is a neural network–based method that predicts the final quality of a single model as the expected LGscore40 and MaxSub,41 therefore providing an attempted estimation of two direct measures of structural similarity between model and native structure. The recent ModFOLD server42 was used to calculate the MQscore index. This server provides a unified resource that combines scores obtained from different methods using a neural network trained with the TM-score.
Molecular Docking and Quality Index for Binding Geometries
AutoDock 443,44 and its graphical front-end AutoDockTools (ADT) were used to set up and perform docking calculations.
Experimental structures were downloaded from the Protein Data Bank while theoretical models were constructed as described in Homology modeling and model quality indices section; for the former all water molecules, ions, and ligands were removed from the original files. Polar hydrogen atoms were added to each protein structure (both crystallographic structures and models). The structures of the ligands were directly extracted from the CCDC/Astex Test Set,22 therefore their bond lengths and angles were already optimized; AutoDock tool AutoTors was employed to identify ligands’ rotatable bonds. The proteins were treated as rigid bodies during docking simulations.
Grid maps with 0.375 Å spacing were defined for each collection of experimental structures and corresponding models to include the protein binding site (as defined in Homology modeling and model quality indices section). Lamarckian Genetic Algorithms, as implemented in AutoDock, were employed to perform docking calculations. The maximum number of energy evaluations and of generations were set to 25 million and to 27,000, respectively, and 100 runs, each with a population of 150 individuals, were performed for each calculation. Random starting positions, orientations, and torsions were used for the ligands; their translational step was set to 0.2 Å, the quaternion step to 5.0°, and the torsion step to 5.0°. Cluster analysis was performed by AutoDock with a RMSD cut-off of 2 Å. All other parameters were default settings.
To evaluate docking results, the dRMSD (see Homology modeling and model quality indices section) was calculated between the model ligand–site distances and the X-ray ligand–site corresponding distances. Using this index, the distance calculation takes into account only the deviation on the relative position of the ligand to the residues belonging to the binding site and not, as it is for the RMSD calculation, of the deviation on the absolute position of the ligand in the pose from the crystallographic one. Therefore the structural differences between the model and the experimental structure are excluded from the evaluation of the quality of docking results.
For each of the docking cases, this index was evaluated both for the lowest energy pose, according to the AutoDock scoring function (dRMSD), and for the lowest dRMSD pose (mindRMSD), in order to investigate the correlation between the quality of the models and the accuracy of docking results.
Data Analysis and Visualization
Format conversion of sequence and structural data was performed using python (http://www.python.org) scripts based on the biopython modules (http://www.biopython.org).45,46 Graphs were generated using R 2.7.0.47 Statistical analysis was performed with R. The molecular model visualizations were generated using PyMOL.48
Results
Test Set Variety
The reference group of 21 X-ray structures of ligand–protein complexes (Table 1) is composed by proteins having different chain lengths (100–400 residues) and a large spectrum of structural characteristics. Three different classes of the CATH classification (mainly α, mainly β, α-β)49 and a wide range of architectures and topologies are represented. The set is also characterized by ligands with broadly different chemical characteristics.
For each protein in the reference set, several theoretical models were developed by homology modeling. The template structures were selected to cover a wide range of evolutionary distances with the target. A preliminary analysis of the distribution of the sequence identities of the candidate templates highlighted a bimodal trend for each similarity search result, with the highest peak at 20–30% identity and second one at high values (50–80%). To reproduce this kind of distribution in our test case, templates were selected in a range of identity from 15 to 85% accurately enriching the number of representatives for low percentages. The 92 selected templates (Table 1) include both apo and holo structures, the latter characterized by ligands which are usually different from the ones bound in reference structures.
Homology Modeling and Assessment
As described in the Methods section, for each target sequence two single-template models for each selected template as well as two multiple-template models were generated by using Modeller, and an additional model was obtained by the automated server I-TASSER. The resulting set includes 245 models.
The quality of each model was evaluated by direct comparison with the native structure, by employing “calculated” indices (see Methods section). The global quality of the structure was assessed by using the RMSD, DALI_Zscore, DALI_Zratio, LGA_RMSD, GDT_TS, GDT_HA, and LGA_S indices; the binding site quality by the RMSD-s, the dRMSD-s, and the ACS indices.
The set provides a wide spectrum of quality as seen in the distribution of four informative indices (RMSD, GDT_HA, RMSD-s, and ACS) shown in Figure 1a–1d. The collection of modeled structures includes a significant number of good prediction and medium–low resolution models: the majority of RMSD values (Fig. 1a) are below 2 Å, while only 30% of the models show a lower conformity to the target, with RMSD values in the range 2–4 Å, and a few exceptions have very low quality. Accordingly, with a small exception of four models, the DALI_Zscore values are always higher than 10 (data not shown), demonstrating that the models have the correct folds with statistical significance.32 Interestingly, all the DALI_Zratio values are lower than 1, indicating a better agreement of the model to the template than to the native structure. The trends of the three global indices based on LGA alignment are similar to those shown for DALI indices: the histogram of the GDT_HA values (Fig. 1b) shows that the majority of models have scores over 50, while 30% are in the range 20–50, and few models show poor conformity to the native structure. This picture is slightly different for the active site where the distribution of site RMSD values (RMSD-s, Fig. 1c) is slightly skewed compared with the one for global RMSD and the group of models with a poorly reproduced binding site (about 10%, with values greater than 4 Å) does not include all the models with the worst RMSD. On the other hand, the ACS index of binding site quality shows a more uniform distribution (Fig. 1d), with about 40% of cases having binding sites modelled with high accuracy (ACS > 0.6), about 40% with intermediate quality and the remaining cases with incorrectly modeled binding sites (ACS <0.2).
Figure 1.

Distributions of some calculated indices of model quality for the modeling set: a) RMSD, b) GDT_HA, c) RMSD-s, and d) ACS.
The degree of correlation for the “calculated” indices was measured by Spearman’s rank coefficient, ρ, and the absolute values are reported in Table 2. This coefficient is generally more appropriate than Pearson’s for handling non-normal distributions, as those we obtained for some indices (for example, the RMSD-s in Fig. 1c). Values in Table 2 show that the indices calculated on the basis of the LGA structural alignment are highly correlated to each others (ρ absolute values from 0.97 to 1.00) as the elements of this group provide a very similar ranking of global model quality. Interestingly, DALI_Zratio is also highly correlated to both the GDT_TS and the GDT_HA scores (ρ = 0.90). On the basis of this correlation analysis, only the results for a representative index of this group, GDT_HA, will be reported and discussed in the following (see Relationships between model quality and docking results’ accuracy section). On the contrary, all three indices related to the binding site quality will be considered, since each of them seems to provide an information partially different from the others. Lower ρ absolute values are observed when comparing indices of global quality with those of site quality. This confirms that there is no general trend for models with accurate backbone geometry to have accurately modeled binding sites.5
Table 2.
Absolute Values of the Pairwise Spearman Correlation Coefficients Between Model Quality Indices.
| Calculated indices |
Predicted indices |
|||||||||||||||||||||||||
|---|---|---|---|---|---|---|---|---|---|---|---|---|---|---|---|---|---|---|---|---|---|---|---|---|---|---|
| RMSD | DALI_ Zscore |
DALI_ Zratio |
LGA_ RMSD |
GDT_ TS |
GDT_ HA |
LGA_ S |
RMSD-s | dRMSD-s | ACS | Seq_ Id |
Seq_ Sim |
RMSD (t) | LGA_ RMSD(t) |
LGA_ S(t) |
Seq_ Id-s |
Seq_ Sim-s |
RMSD-s(t) | Mol probity |
Pro check |
Prosa II |
Verify 3D |
LG score |
Max Sub |
MQ score |
||
| RMSD | 1.00 | |||||||||||||||||||||||||
| DALI_Zscore | 0.63 | 1.00 | ||||||||||||||||||||||||
| DALI_Zratio | 0.88 | 0.63 | 1.00 | |||||||||||||||||||||||
| LGA_RMSD | 0.87 | 0.64 | 0.86 | 1.00 | ||||||||||||||||||||||
| GDT_TS | 0.89 | 0.67 | 0.90 | 0.98 | 1.00 | |||||||||||||||||||||
| GDT_HA | 0.89 | 0.66 | 0.90 | 0.98 | 1.00 | 1.00 | ||||||||||||||||||||
| LGA_S | 0.88 | 0.67 | 0.89 | 0.97 | 0.99 | 0.99 | 1.00 | |||||||||||||||||||
| RMSD-s | 0.87 | 0.59 | 0.76 | 0.81 | 0.82 | 0.83 | 0.81 | 1.00 | ||||||||||||||||||
| dRMSD-s | 0.73 | 0.40 | 0.57 | 0.66 | 0.66 | 0.67 | 0.65 | 0.84 | 1.00 | |||||||||||||||||
| ACS | 0.75 | 0.51 | 0.67 | 0.68 | 0.69 | 0.71 | 0.68 | 0.83 | 0.78 | 1.00 | ||||||||||||||||
| Seq_Id | 0.85 | 0.54 | 0.69 | 0.86 | 0.86 | 0.88 | 0.85 | 0.73 | 0.68 | 0.69 | 1.00 | |||||||||||||||
| Seq_Sim | 0.84 | 0.51 | 0.65 | 0.84 | 0.85 | 0.86 | 0.84 | 0.70 | 0.65 | 0.66 | 0.98 | 1.00 | ||||||||||||||
| RMSD(t) | 0.76 | 0.63 | 0.60 | 0.76 | 0.78 | 0.78 | 0.76 | 0.61 | 0.51 | 0.52 | 0.86 | 0.86 | 1.00 | |||||||||||||
| LGA_RMSD(t) | 0.77 | 0.65 | 0.62 | 0.78 | 0.79 | 0.79 | 0.78 | 0.61 | 0.53 | 0.54 | 0.87 | 0.88 | 0.97 | 1.00 | ||||||||||||
| LGA_S(t) | 0.26 | 0.12 | 0.20 | 0.29 | 0.30 | 0.32 | 0.28 | 0.24 | 0.20 | 0.24 | 0.41 | 0.41 | 0.42 | 0.41 | 1.00 | |||||||||||
| Seq_Id-s | 0.76 | 0.59 | 0.65 | 0.77 | 0.78 | 0.79 | 0.76 | 0.69 | 0.71 | 0.71 | 0.85 | 0.81 | 0.71 | 0.73 | 0.20 | 1.00 | ||||||||||
| Seq_Sim-s | 0.69 | 0.59 | 0.57 | 0.72 | 0.72 | 0.72 | 0.71 | 0.65 | 0.66 | 0.67 | 0.81 | 0.79 | 0.70 | 0.71 | 0.19 | 0.90 | 1.00 | |||||||||
| RMSD-s(t) | 0.72 | 0.57 | 0.60 | 0.69 | 0.71 | 0.72 | 0.70 | 0.69 | 0.66 | 0.65 | 0.74 | 0.73 | 0.82 | 0.82 | 0.31 | 0.70 | 0.67 | 1.00 | ||||||||
| MolProbity | 0.81 | 0.29 | 0.70 | 0.75 | 0.76 | 0.78 | 0.76 | 0.71 | 0.63 | 0.64 | 0.84 | 0.84 | 0.62 | 0.63 | 0.33 | 0.69 | 0.62 | 0.59 | 1.00 | |||||||
| Procheck | 0.06 | 0.13 | 0.03 | 0.12 | 0.11 | 0.10 | 0.13 | 0.04 | 0.04 | 0.08 | 0.09 | 0.14 | 0.14 | 0.15 | 0.05 | 0.01 | 0.10 | 0.13 | 0.14 | 1.00 | ||||||
| ProsaII | 0.55 | 0.28 | 0.53 | 0.60 | 0.60 | 0.60 | 0.60 | 0.55 | 0.53 | 0.37 | 0.57 | 0.58 | 0.53 | 0.53 | 0.22 | 0.52 | 0.49 | 0.50 | 0.58 | 0.45 | 1.00 | |||||
| Verify3D | 0.76 | 0.67 | 0.72 | 0.72 | 0.74 | 0.74 | 0.73 | 0.64 | 0.55 | 0.55 | 0.76 | 0.74 | 0.74 | 0.76 | 0.23 | 0.68 | 0.61 | 0.63 | 0.63 | 0.05 | 0.52 | 1.00 | ||||
| LGscore | 0.54 | 0.84 | 0.54 | 0.57 | 0.59 | 0.58 | 0.60 | 0.50 | 0.35 | 0.40 | 0.51 | 0.52 | 0.61 | 0.64 | 0.13 | 0.48 | 0.51 | 0.55 | 0.36 | 0.42 | 0.49 | 0.66 | 1.00 | |||
| MaxSub | 0.59 | 0.70 | 0.59 | 0.63 | 0.66 | 0.64 | 0.67 | 0.53 | 0.38 | 0.43 | 0.59 | 0.60 | 0.61 | 0.63 | 0.19 | 0.51 | 0.55 | 0.55 | 0.46 | 0.48 | 0.58 | 0.63 | 0.89 | 1.00 | ||
| MQscore | 0.56 | 0.52 | 0.58 | 0.56 | 0.60 | 0.59 | 0.61 | 0.48 | 0.45 | 0.34 | 0.60 | 0.62 | 0.68 | 0.70 | 0.29 | 0.53 | 0.53 | 0.61 | 0.52 | 0.39 | 0.70 | 0.64 | 0.65 | 0.67 | 1.00 | |
In addition to the calculated indices, a set of indices aimed at predicting model quality without any knowledge of the native structure was also derived (“predicted” indices). These includes measures of similarity between the generated model and its template [Seq_Id, Seq_Sim, RMSD(t), LGA_RMSD(t), LGA_S(t), Seq_Id-s, Seq_Sim-s, and RMSD-s(t)], as well as scores employed to estimate the conformity of experimental structures to the average proteins of similar resolution (MolProbity, Procheck, ProsaII, Verify3D, LGscore, MaxSub, and MQscore) (see the Methods section for more details). Also in this case, some indices are not normally distributed (data not shown).
The analysis of the pairwise correlations between predicted indices (Table 2) shows high correlation (|ρ| > 0.90) between Seq_Id and Seq_Sim, Seq_Id-s and Seq_Sim-s, as well as between model–template RMSD calculated by using DALI [RMSD(t)] and the one obtained from the LGA alignment [LGA_RMSD(t)]. The two indices calculated with the model quality assessment program ProQ (LGscore and MaxSub) were also highly correlated.
The identification of the most effective indices for quality prediction was based on the Spearman correlation coefficients for pairwise comparisons of predicted and calculated indices (Table 2): the indices with the highest correlation with a calculated one are expected to be more powerful in prediction. In particular, the indices having |ρ| > 0.70 with respect to both the RMSD and the GDT_HA calculated indices (here taken as a reference) are: Seq_Id (and the correlated Seq_Sim), RMSD(t) [and LGA_RMSD(t)], the corresponding indices evaluated in the binding site, the MolProbity and Verify3D Z-scores. The expected relationship between the target-template sequence identity and the RMSD16 is observed (Fig. 2a), and the plot confirms that models with Seq_Id greater than 50% have RMSD values lower than 2 Å. On the other hand, Seq_Id shows lower correlation coefficients with respect to the calculated site quality indices, RMSD-s, dRMSD-s, and ACS (Table 2). The plot in Figure 2b highlights that models with Seq_Id values both greater and lower than 50% can give accurately modeled binding sites.
Figure 2.

Correlation between some calculated model quality indices (a) RMSD, b) RMSD-s) and the model-template sequence identity (Seq_Id). Four cases with RMSD-s values higher than 12 Å were excluded from the plot b) for a clearer representation.
On the basis of this correlation analysis, only the following predicted indices of model quality will be included in the following discussion (see Relationships between model quality and docking results’ accuracy section): Seq_Id, RMSD(t), Seq_Id-s, RMSD-s(t), MolProbity, and Verify3D.
Molecular Docking
The docking experiments were aimed at reproducing the binding geometries corresponding to all the protein–ligand complexes in the reference set. To this end, molecular docking calculations were performed on both the protein experimental structures and the associated group of structural models, for a total of 266 simulations. In docking, the protein was treated as a rigid body and only the ligand flexibility was considered, by including the torsional degrees of freedom of all the rotatable bonds.
Cluster analysis of the poses was performed for each docking simulation independently by AutoDock. In the majority of the cases, results indicated an efficient sampling of the intermolecular and intramolecular conformational space, associated with a reduced number of highly populated clusters of poses. In some cases (about 20% of the total docking runs), the first cluster was scarcely populated, thus indicating a poor sampling convergence (data not shown).
The accuracy of the obtained geometries was evaluated by calculating the dRMSD between the model ligand–site distances and the X-ray ligand–site corresponding distances (see Methods section). The distribution of the dRMSD values for the best-scored docking poses is reported in Figure 3. In more than 50% of the experiments, the top ranked docking pose reproduces the experimental geometry with good accuracy (dRMSD < 3 Å). About 25% of the dRMSD values are in the range 3–5 Å, whereas in the remaining cases high values (dRMSD >5 Å) are observed. As expected, this last group includes the entries for which a poor convergence of the sampling was observed. As an example of the values of dRMSD associated to different outcomes of docking calculations, the binding geometries obtained in four docking simulations of the same complex (PDB ID: 1UKZ), are shown in Figure 4. As can be seen in the picture, a satisfactory reproduction of the experimental geometry is associated with dRMSD < 3 Å (Figs. 4a and 4b), dRMSD values in the intermediate range 3–5 Å (Fig. 4c) indicate a slightly misplaced location of the ligand in the binding site, associated with translational and/or rotational displacements from the experimental binding geometry; for dRMSD > 5 Å (Fig. 4d) docking failed to reproduce the binding geometry.
Figure 3.

Distribution of the dRMSD index of docking results for the whole test set.
Figure 4.

Uridylate kinase - adenosine monophosphate complex (PDB ID: 1UKZ). Binding geometries obtained by docking calculations compared to the experimental geometry (red sticks): a) ligand docking pose (green sticks) for the protein experimental structure (green cartoons); b) ligand docking pose (light blue sticks) for a protein model of high quality (cyan cartoons); c) ligand docking pose (yellow sticks) for a protein model of medium quality (yellow cartoons); d) ligand docking pose (blue sticks) for a protein model of low quality (blue cartoons).
It is conceivable that some observed inefficiencies of docking calculations are associated with the well-known general limitation of the scoring functions implemented in docking programs: while the sampling procedure is able to generate good results, the scoring scheme is often incorrect in ranking the binding poses and, consequently, in discriminating the “true” one from the others.2,50 The hypothesis that this limitation could affect our results was investigated by the analysis of the relation between dRMSD values for the best-scored pose (dRMSD) and the absolute minimum dRMSD to the crystallographic geometry that was obtained in our docking runs (mindRMSD). The plot in Figure 5a confirms that, in many cases, the best-scored pose does not correspond to the best geometrical pose and highlights that this trend is observed in the whole range of values. On the other hand, Figure 5b shows that the deviation between the scores of the first ranked poses and those of the best geometrical poses is generally limited.
Figure 5.

Docking results: a) relation between dRMSD values for the best scored poses (dRMSD) and the minimum dRMSD values obtained (mindRMSD); b) relation between the AutoDock scores for the best scored poses (best score) and AutoDock scores for poses with the minimum dRMSD values (score mindRMSD).
For three complexes (PDB ID: 1C83, 3CLA, 6RNT), binding geometries far from the experimental ones were obtained even when docking ligands into the protein X-ray structure, with RMSD > 2 Å for both the best-scored pose and the one most consistent with the experimental binding geometry (data not shown). Accordingly, the poses obtained for the associated modeled structures were incorrect, too. The results obtained for these three complexes (18 cases) were excluded from the analysis on the relationships between model quality and docking results’ accuracy because performance associated with these results would be unrelated to the quality of the modeled structure.
Relationships Between Model Quality and Docking Results’ Accuracy
In addition to the test set, three structurally homogeneous subsets of complexes were analyzed independently to provide insight on the role of fold specificity. Each subset was assembled selecting complexes whose proteins share the same fold and are evolutionary related, as indicated by the CATH classification in the same Homologous Superfamily (see Table 1):
2AK3 + 1UKZ: the Adenylate kinase isoenzyme-3—Adenosine monophosphate complex + the Uridylate kinase—Adenosine monophosphate complex [CATH ID 3.40.50.300];
1CBS + 1FEN: the Cellular retinoic-acid-binding protein type II—Retinoic acid complex + the Retinol binding protein—All-trans axerophthene complex [CATH ID 2.40.128.20];
1EJN + 1TNG: Urokinase-type plasminogen activator—N-(1-adamantyl)-N′-(4-guanidinobenzyl) urea complex + the Trypsin—Aminomethylcyclohexane complex [CATH ID 2.40.10.10].
On the basis of the correlation analysis between calculated indices (see Homology modeling and assessment section), only the results for the five representative ones (RMSD, GDT_HA, RMSD-s, dRMSD-s, ACS) are reported in Table 3. Correlations were calculated with the dRMSD of the best-scored docking pose. In addition, due to the observed limits of the scoring function in ranking the binding poses (see Molecular docking section), the poses that better reproduced the experimental binding geometry were also included in a parallel analysis. Accordingly, the correlations with the mindRMSD were also evaluated and the results reported in Table 3 for comparison.
Table 3.
Spearman Correlation Coefficients Between Docking dRMSD (in parenthesis, between mindRMSD) and Each Calculated Quality Index, for the Whole Test Set and for Some Subsets (see Text).
| Whole test set (248 cases) | 2AK3 + 1UKZ (36 cases) | 1CBS + 1FEN (22 cases) | 1EJN + 1TNG (36 cases) | |
|---|---|---|---|---|
| RMSD | 0.66 (0.74) | 0.56 (0.61) | 0.87 (0.91) | 0.78 (0.78) |
| GDT_HA | −0.67 (−0.74) | −0.71 (−0.78) | −0.85 (−0.92) | −0.79 (−0.80) |
| RMSD-s | 0.75 (0.83) | 0.88 (0.92) | 0.77 (0.81) | 0.65 (0.71) |
| dRMSD-s | 0.68 (0.80) | 0.87 (0.93) | 0.80 (0.83) | 0.72 (0.83) |
| ACS | −0.70 (−0.75) | −0.90 (−0.88) | −0.76 (−0.87) | −0.82 (−0.80) |
In the analysis of the whole test set, satisfactory correlations were obtained between dRMSD and all the calculated indices of model quality, with the highest values for the site quality indices. The plots of the docking dRMSD vs. the GDT_HA, RMSD-s and dRMSD-s indices are shown as examples in Figure 6; points related to the three subsets of complexes are highlighted. As it is shown from data in Table 3 and Figure 6, correlations are higher for the subsets than for the entire test set, both for the site and the global quality indices.
Figure 6.
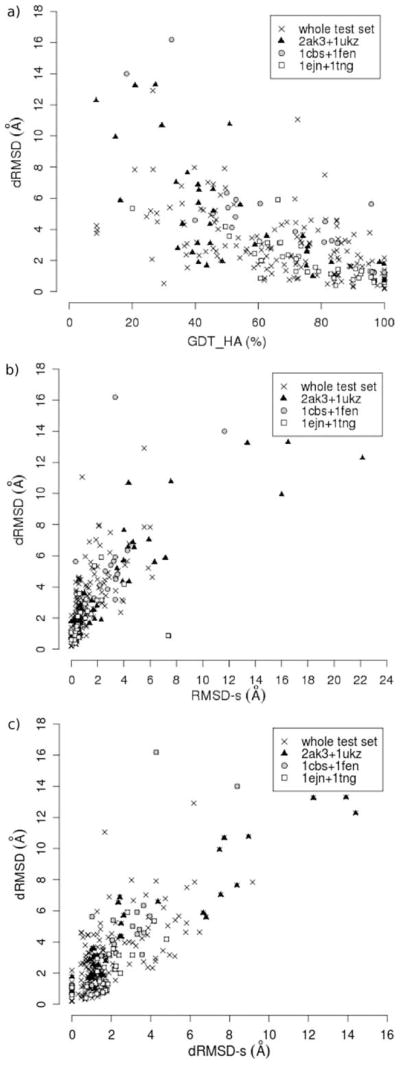
Plots of docking dRMSD vs. three calculated quality indices: GDT_HA, RMSD-s and dRMSD-s. Different symbols represent the three subsets of ligand-protein complexes reported in Table 3 (see text). The Spearman correlation coefficients for the whole test set and for each subset are reported in Table 3.
Similar trends were obtained for the mindRMSD (Table 3), and in this case, where the errors associated to the incorrect ranking of the best pose were eliminated, the resulting correlation coefficients are higher both for the test set and the subsets. All the resulting |ρ| values for the whole set are greater than 0.7, and |ρ| = 0.83 and 0.80 were found for the RMSD-s and the dRMSD-s, respectively. This indicates a high correlation between docking accuracy and both the global adherence of the modeled binding site to the experimental structure and the accuracy of the sidechain conformations in the site.
We investigated the possibility of developing multivariate models by regression analyses of dRMSD and mindRMSD versus all the calculated model quality indices. R2 coefficients of 0.63 and 0.73 were obtained. Interestingly, the three site quality indices were the most statistically significant ones in the obtained models (with p-values less than 0.001), thus confirming that indices of conformity to the native binding site are the most informative in the evaluation of docking results accuracy.
The relationships between docking dRMSD (and mindRMSD) and each predicted quality index were also investigated. The results of the pair-wise correlation analysis for the most representative indices (see Homology modeling and assessment section) are reported in Table 4, both for the test set and for the three subsets of complexes. The best correlations for the whole test set are those obtained for the global sequence identity with the template, Seq_Id, as well as for the indices of conformity of the modeled binding site with the template site, Seq_Id-s and RMSD-s(t). The resulting ρ absolute values are higher than 0.6 in both the relationships with docking dRMSD and mindRMSD, with slightly higher values for the latter index. These values indicate the presence of trends but preclude the possibility of building predictive models of general use. In particular, the plot of dRMSD vs. Seq_Id (see Fig. 7) indicates that the commonly accepted rule that only models with over 50% sequence identity with the template are suitable for docking studies is not reliable. In fact, in many cases with Seq_Id > 50% docking results with dRMSD values from 2 to 8 Å were obtained and, conversely, in some cases acceptable results (dRMSD < 2 Å) were obtained by using models with Seq_Id <50%.
Table 4.
Spearman Correlation Coefficients between Docking dRMSD (in parenthesis, between mindRMSD) and Each Predicted Quality Index, for the Whole Test Set and for Some Subsets (see Text).
| Whole test set (248 cases) | 2AK3 + 1UKZ (36 cases) | 1CBS + 1FEN (22 cases) | 1EJN + 1TNG (36 cases) | |
|---|---|---|---|---|
| Seq_Id | −0.62 (−0.66) | −0.64 (−0.63) | −0.87 (−0.86) | −0.71 (−0.76) |
| RMSD(t) | 0.53 (0.53) | 0.67 (0.65) | 0.75 (0.82) | 0.38 (0.38) |
| Seq_Id-s | −0.63 (−0.66) | −0.58 (−0.61) | −0.93 (−0.80) | −0.76 (−0.79) |
| RMSD-s(t) | 0.67 (0.65) | 0.88 (0.86) | 0.86 (0.76) | 0.67 (0.55) |
| MolProbity | −0.55 (−0.62) | −0.51 (−0.54) | −0.86 (−0.90) | −0.83 (−0.77) |
| Verify3D | −0.57 (−0.63) | −0.65 (−0.72) | −0.67 (−0.76) | −0.63 (−0.72) |
Figure 7.

Plot of docking dRMSD vs. model-template sequence identity (Seq_Id).
Noticeably, for the three quality indices that are better correlated with the docking dRMSD (and mindRMSD) the correlation coefficients are higher in the three homogeneous subsets (0.6 <|ρ| <0.9) than in the whole test set (Table 4), as are the correlations with the calculated quality indices. Moreover, in some subsets the correlations with an index of global structural conformity to the template, RMSD(t), and the statistical Z-scores MolProbity and Verify3D emerge with comparable ρ values. It can be concluded that in the subsets all the six most effective indices for model quality prediction (Seq_Id, RMSD(t), Seq_Id-s, RMSD-s(t), MolProbity, and Verify3D) correlate well with docking accuracy.
It has been observed that the predicted model quality indices that showed low correlation with the calculated indices (Table 2), do not correlate with the indices of docking accuracy (data not shown). Therefore, the ability to predict the quality of a structural model appears to be a necessary prerequisite, even if not sufficient for predicting the accuracy of the docking results on that model.
Finally, as for the calculated indices, a regression analysis of dRMSD and mindRMSD vs. all the predicted quality indices was performed to investigate the possibility of developing multivariate models for the relationship between docking and homology modeling accuracy. The RMSD-s(t) and Verify3D indices were the most statistically significant in the global models (with p-values less than 0.01). The R2 coefficients resulting from the bivariate models of dRMSD and mindRMSD vs. these two indices are indeed higher than the ones obtained for the monovariate models (R2 = 0.49 and R2 = 0.48, respectively). However, these models are still only suitable in regression, as they explain about 50% of the variance of the data.
Examples of Prediction of Docking Results’ Accuracy
Based on the significantly high correlations between docking results’ accuracy and predicted model quality indices in the subsets of evolutionary related proteins (see Relationships between model quality and docking results’ accuracy section), a multiple linear regression model was built for one subset of the original test set (1CBS + 1FEN). The variables included in the multivariate model were the predicted indices with highest correlation (|ρ| > 0.65) with docking results’ accuracy for the subset: Seq_Id, Seq_Id-s, RMSD(t), RMSD-s(t), MolProbity, and Verify3D (see Table 4). As the obtained model was suitable not only for regression (R2 = 0.97) but also for prediction (Q2 = 0.84), it was used to predict the accuracy of docking results in a new case not included in the original test set, belonging to the same CATH homologous superfamily as 1CBS and 1FEN: the complex between the human cellular retinol-binding protein II and retinol (PDB ID: 2RCT). Two different homology models were generated for this structure, from two different templates, one at low sequence identity (31%: the rat intestinal fatty acid binding protein—PDB ID: 1ICN), and the other one at high sequence identity (90%: the rat cellular retinol-binding protein II—PDB ID: 1OPA). The two models were generated by using T-Coffee and Modeller and the docking of the retinol with both models was performed by using AutoDock, following the procedure already described in the Methods section. The results for modeling and docking are shown in Figures 8a and 8b, for comparison with the known experimental complex.
Figure 8.

Modeling, docking, and docking accuracy prediction results for the complex between the human cellular retinol-binding protein II and retinol (PDB ID: 2RCT). a) and b) Experimental structure of the complex (gray), superimposed to the models obtained by using 1ICN (red) and 1OPA (blue) as templates; c) plot of predicted docking dRMSD (dRMSD-predicted) vs. calculated dRMSD (dRMSD); in black, values for the models in the subset 1CBS + 1FEN, in red and in blue, values for the models of 2RCT obtained by using 1ICN and 1OPA as templates, respectively.
The results of this prediction are quite interesting: a very small difference (0.37 and 0.65 Å for the model built by using 1ICN and 1OPA) is found between the dRMSD calculated by comparison with the known experimental structure and the dRMSD obtained applying the prediction model, as shown in Figure 8c.
Discussion
Homology models have been increasingly used in ligand–protein docking,9–11 extending significantly the list of targets available for drug design. Consequently, there is now great interest in both assessing the effects of inaccuracies in the protein models on the prediction of protein–ligand interactions and finding general criteria to estimate in advance the accuracy of docking results given the model quality. Only very recently, a large-scale benchmarking study51 addressed these questions and suggested some techniques to best exploit comparative models in molecular docking screens. However, none of the model quality indices tested in this study appeared suitable to reliably predict the accuracy of ligand docking.
Through a large-scale theoretical experiment on a diverse set of ligand–protein complexes we identified the model features that mostly affect docking accuracy, and we proposed a general strategy to predict the accuracy of docking results from appropriate model quality indices.
The relationships between docking accuracy and quality indices derived by direct comparison to the native structure were evaluated and, as expected, good correlations were found in groups of models of the same protein–ligand complex. For example, for the 16 docking runs performed on different models of 1UKZ (see Fig. 4) the docking dRMSD correlates with all the calculated quality indices with |ρ| > 0.85. An unexpected result was that good correlations emerged also within groups of different complexes whose proteins are structurally similar (see Table 3). As an example, some docking poses for the 1EJN + 1TNG subset are reported in Figure 9. The structural superimposition of the two experimental complexes (Fig. 9a) confirms a high similarity at the fold level and structurally very well conserved binding sites. The increase of dRMSD of the binding poses correlates well with the decrease of model quality reported in Figures 9b–9e. Considering the whole subset (36 docking cases), the dRMSD correlates well with all the calculated quality indices (see Table 3). This agreement was observed in all the three selected subsets of complexes. To this extent, it is remarkable that this result is independent of the similarity of the ligands: in the first case, the proteins bind the same ligand (adenosine monophosphate for 2AK3 and 1UKZ); in the second case, the ligands have similar structures but different functional groups (the all-trans axerophthene in 1FEN differs from the retinoic acid in 1CBS for the presence of a methyl group instead of a carboxyl group); while in the 1EJN + 1TNG set, the ligands have different structures (see caption in Fig. 9 for details).
Figure 9.

Some docking results for the 1EJN + 1TNG subset of protein–ligand complexes: Urokinase-type plasminogen activator - N-(1-adamantyl)-N′-(4-guanidinobenzyl) urea complex + Trypsin - Aminomethylcyclohexane complex. a) The two experimental structures of the complexes upon structural superimposition of the proteins: 1EJN, protein and ligand are colored in green; 1TNG, protein in cyan, ligand in blue; b), d) 1TNG: two binding geometries obtained by docking calculations for protein models of different qualities (models are colored in purple and ligands in pink), compared to the experimental geometry (cyan and blue); c), e) 1EJN: two binding geometries obtained by docking calculations for protein models of different qualities (yellow and orange), compared to the experimental geometry (green).
When the correlation analysis was extended to the whole test set, where proteins span a large spectrum of structural characteristics (see Table 1), lower correlation coefficients were found for indices of global model quality (Table 3). This suggests that errors in modeling different folds affect the correlation with docking accuracy in different ways. On the contrary, the correlations of dRMSD with indices of binding site quality are similarly high when considering either the complete set or the single subsets. Also a multivariate regression analysis confirmed that the conformity to the native binding site is the most relevant feature to provide accurate docking results.
In particular, the accuracy in modeling the conformations of the active siteside chains plays an important role in docking into homology models, as shown by the dRMSD-s index. To this extent, the ability to include dynamic changes occurring in protein binding sites upon ligand binding is becoming a central issue in molecular docking and many efforts have been made over the past years in developing new docking methods that allow fitting and scoring of flexible ligands in flexible binding sites. These approaches include simulation of the sidechain flexibility during docking, constrained geometrical simulations, ensemble docking to structure sets (from Molecular Dynamics or Monte Carlo methods, rotamer libraries, experimental determinations), or optimization of docked solutions obtained from rigid receptor docking.52–55 Our results confirm the importance of the development of such strategies also for extending the use of docking methods to homology models.
A wide choice of docking methods is currently available. To make our research more useful for the scientific community, we selected the most widely used and tested method for ligand–protein docking,50 AutoDock.43,44 Because of limitations imposed by the program when a large conformational space has to be searched,44 we decided not to employ a recently added option that allows inclusion of protein sidechain flexibility. While this is a more simplified approach to the docking problem, it allows a direct interpretation of the errors associated with the inaccuracies in modeling the active site.
Additionally a difficulty in the evaluation of the relationships between docking results and model accuracy can arise from the known difficulties of many available docking methods in correctly ranking the calculated poses.2,50 We verified that indeed, in some of our test cases, the top ranked poses identified by AutoDock poorly reproduced the experimental geometry (Fig. 5a). When the poses that absolutely better reproduced the experimental binding geometry (mindRMSD) were evaluated (Table 3), as expected, better correlations were found. On the other hand, we observed that the ranking errors were always associated to very limited differences in score (Fig. 5b). Accordingly, similar conclusions regarding the relationships with the model quality indices were derived for the best geometrical poses as for the best scored poses: there is a higher correlation in homogeneous subsets for global quality indices and a better overall performance of site quality indices.
The analysis of the relationships between docking accuracy and model quality indices derived without any knowledge of the protein experimental structure was performed to verify if an a priori prediction of the quality of docking experiments on homology models would be possible. The analysis was performed by employing a set of widely used measures, but we are aware of a larger number that have been proposed and are in development.21,34 Our goal was not to provide a comprehensive review of these indices but to make an assessment of their use in predicting the quality of docking results.
Among the predicted indices, the ones showing the best correlations with the calculated quality indices (Table 2) were considered the most promising. These include indices that evaluate both the global (Seq_Id, RMSD(t)) and local (Seq_Id-s, RMSD-s(t)) conformity of the model to the template as well as the MolProbity38 and Verify3D36 Z-scores derived by comparison with average properties of known protein structures. However, while good in predicting the overall quality of the structures, none of these indices comparably correlates with the calculated quality of the binding site. In particular, the target-template sequence identity, that is a widely employed predictive index, gave interesting results. For our test set, in many cases the accuracy of the modeled binding site is not directly related to high sequence identity values (Fig. 2b) and, consistently, a poor predictability of the docking accuracy was found when the correlations between docking dRMSD and Seq_Id were analyzed (see Fig. 7 and Table 4).
Correlation analysis of the dRMSD for the best scored docking pose with all the selected predicted indices confirmed these findings (Table 4). Acceptable correlations were found only between the dRMSD and the indices of conformity to the template that are mostly related to the calculated model quality, in particular the two indices of binding site quality (Seq_Id-s, RMSD-s(t)). However, for all the predicted indices, the monovariate and the multivariate regression analyses report weaker correlations than for the calculated indices and, due to a lower percentage of explained variance, these models could not be reliable in prediction.
Interestingly, coherently to what was observed for calculated indices, in the three homogeneous subsets of proteins the correlations of some predicted indices with dRMDS (and mindRMSD) were stronger and all the most effective indices for model quality prediction [Seq_Id, RMSD(t), Seq_Id-s, RMSD-s(t), MolProbity, and Verify3D] appeared more suitable for docking accuracy prediction (Table 4).
On the basis of this observation, we inferred that these indices may be suitable for predicting docking results accuracy for structurally related proteins. Accordingly, we proposed a prediction strategy and tested it on a case not included in the original test set, the complex of the retinol binding protein and retinol, 2RCT (see Examples of prediction of docking results’ accuracy section). Two proteins belonging to the same CATH superfamily and with known experimental structure of a ligand–protein complex (1CBS and 1FEN) were used to build a predictive model. The results of this test did confirm our hypothesis. In fact, the regression model between the dRMSD of the docking poses obtained on the homology models previously developed for these systems and the corresponding six model quality indices (Table 4) gave a reliable prediction of the docking accuracy for two models developed for the study case (see Fig. 8). This opens a way to the prediction of the accuracy of docking into homology models.
In the same framework, another promising avenue is the use of recently developed knowledge-based potentials for model quality assessment derived from specific information of homologous proteins.56
Conclusions
From the thorough analysis performed on the proposed test set it can be concluded that general relationships do exist between docking results accuracy and model quality, when evaluated by conformity to the experimental structure, and that these emerge more clearly within groups of structurally similar proteins. Moreover, the correlations with binding site quality indices are stronger and, consequently, evident even in heterogeneous groups of proteins.
These results confirm that successful docking simulations require an accurate modeling of the binding site, and suggest that, conversely, the development of docking approaches that allow flexibility in the binding site may have a great impact on the effective use of docking into homology models.
The analysis of indices aimed to predict model quality without any knowledge of the native structure indicated that, while these indices are highly related to the overall quality of the models, they are usually poorly related to the quality of the binding sites. Therefore, they were not suitable to derive general rules for predicting docking accuracy. In particular, relying only on the percentage of sequence identity with the template to assess the feasibility of a docking study can be misleading; especially the use of a general criterion of sequence identity greater than 50% to ensure reliability of the docking results appears to be questionable.
On the contrary, from our analysis it can be argued that the state-of-the-art model quality assessment indices are effective tools to predict the accuracy of docking experiments when used in the context of group of proteins with similar structural characteristics. On these bases, we suggested a strategy for employing information on homologous proteins to predict the accuracy of docking results for a study case. In such a way, the errors deriving from modeling different systems and their effects on the prediction of docking accuracy are minimized.
Acknowledgments
Contract/grant sponsor: National Institutes of Health; contract/grant numbers: ES007685
References
- 1.Kitchen DB, Decornez H, Furr JR, Bajorath J. Nat Rev Drug Discov. 2004;3:935. doi: 10.1038/nrd1549. [DOI] [PubMed] [Google Scholar]
- 2.Warren GL, Andrews CW, Capelli A, Clarke B, LaLonde J, Lambert MH, Lindvall M, Nevins N, Semus SF, Senger S, Tedesco G, Wall ID, Woolven JM, Peishoff CE, Head MS. J Med Chem. 2006;49:5912. doi: 10.1021/jm050362n. [DOI] [PubMed] [Google Scholar]
- 3.Berman HM, Westbrook J, Feng Z, Gilliland G, Bhat TN, Weissig H, Shindyalov IN, Bourne PE. Nucleic Acids Res. 2000;28:235. doi: 10.1093/nar/28.1.235. [DOI] [PMC free article] [PubMed] [Google Scholar]
- 4.Levitt M. Proc Natl Acad Sci USA. 2007;104:3183. doi: 10.1073/pnas.0611678104. [DOI] [PMC free article] [PubMed] [Google Scholar]
- 5.Kopp J, Bordoli L, Battey JND, Kiefer F, Schwede T. Proteins. 2007;69(Suppl 8):38. doi: 10.1002/prot.21753. [DOI] [PubMed] [Google Scholar]
- 6.Arnold K, Kiefer F, Kopp J, Battey JND, Podvinec M, Westbrook JD, Berman HM, Bordoli L, Schwede TJ. Struct Funct Genomics. 2009;10:1. doi: 10.1007/s10969-008-9048-5. [DOI] [PMC free article] [PubMed] [Google Scholar]
- 7.Battey JN, Kopp J, Bordoli L, Read RJ, Clarke ND, Schwede T. Proteins. 2007;69(Suppl 8):68. doi: 10.1002/prot.21761. [DOI] [PubMed] [Google Scholar]
- 8.Pieper U, Eswar N, Webb BM, Eramian D, Kelly L, Barkan DT, Carter H, Mankoo P, Karchin R, Marti-Renom MA, Davis FP, Sali A. Nucleic Acids Res. 2009;37(Database issue):D347. doi: 10.1093/nar/gkn791. [DOI] [PMC free article] [PubMed] [Google Scholar]
- 9.Hillisch A, Pineda LF, Hilgenfeld R. Drug Discov Today. 2004;9:659. doi: 10.1016/S1359-6446(04)03196-4. [DOI] [PMC free article] [PubMed] [Google Scholar]
- 10.Cavasotto CN, Phatak SS. Drug Discov Today. 2009;14:676. doi: 10.1016/j.drudis.2009.04.006. [DOI] [PubMed] [Google Scholar]
- 11.Ferrara P, Jacoby E. J Mol Model. 2007;8:897. doi: 10.1007/s00894-007-0207-6. [DOI] [PubMed] [Google Scholar]
- 12.Diller DJ, Li R. J Med Chem. 2003;46:4638. doi: 10.1021/jm020503a. [DOI] [PubMed] [Google Scholar]
- 13.McGovern SL, Shoichet BK. J Med Chem. 2003;46:2895. doi: 10.1021/jm0300330. [DOI] [PubMed] [Google Scholar]
- 14.Oshiro C, Bradley EK, Eksterowitcz J, Evensen E, Lamb ML, Lancot JK, Putta S, Stanton R, Grootenhus PD. J Med Chem. 2004;47:764. doi: 10.1021/jm0300781. [DOI] [PubMed] [Google Scholar]
- 15.Kairys V, Gilson MK, Fernandes MX. Sci World J. 2006;6:1542. doi: 10.1100/tsw.2006.250. [DOI] [PMC free article] [PubMed] [Google Scholar]
- 16.Chothia C, Lesk AM. EMBO J. 1986;5:823. doi: 10.1002/j.1460-2075.1986.tb04288.x. [DOI] [PMC free article] [PubMed] [Google Scholar]
- 17.Sadowski MI, Jones DT. Proteins. 2007;69:476. doi: 10.1002/prot.21531. [DOI] [PubMed] [Google Scholar]
- 18.Larsson P, Wallner B, Lindahl E, Elofsson A. Protein Sci. 2008;17:990. doi: 10.1110/ps.073344908. [DOI] [PMC free article] [PubMed] [Google Scholar]
- 19.Cozzetto D, Tramontano A. Proteins. 2005;58:151. doi: 10.1002/prot.20284. [DOI] [PubMed] [Google Scholar]
- 20.Dalton JA, Jackson RM. Bioinformatics. 2007;23:1901. doi: 10.1093/bioinformatics/btm262. [DOI] [PubMed] [Google Scholar]
- 21.Cozzetto D, Kryshtafovych A, Ceriani M, Tramontano A. Proteins. 2007;69:175. doi: 10.1002/prot.21669. [DOI] [PubMed] [Google Scholar]
- 22.Nissink JW, Murray C, Hartshorn M, Verdonk ML, Cole JC, Taylor R. Proteins. 2002;49:457. doi: 10.1002/prot.10232. [DOI] [PubMed] [Google Scholar]
- 23.Altschul SF, Madden TL, Schäffer AA, Zhang J, Zhang Z, Miller W, Lipman DJ. Nucleic Acids Res. 1997;25:3389. doi: 10.1093/nar/25.17.3389. [DOI] [PMC free article] [PubMed] [Google Scholar]
- 24.Notredame C, Higgins DG, Heringa J. J Mol Biol. 2000;302:205. doi: 10.1006/jmbi.2000.4042. [DOI] [PubMed] [Google Scholar]
- 25.Heringa J. J Comput Chem. 1999;23:341. doi: 10.1016/s0097-8485(99)00012-1. [DOI] [PubMed] [Google Scholar]
- 26.Zhang Y, Skolnick J. Nucleic Acids Res. 2005;33:2302. doi: 10.1093/nar/gki524. [DOI] [PMC free article] [PubMed] [Google Scholar]
- 27.Sali A, Blundell TL. J Mol Biol. 1993;234:779. doi: 10.1006/jmbi.1993.1626. [DOI] [PubMed] [Google Scholar]
- 28.MacKerell AD, Jr, Bashford D, Bellott M, Dunbrack RL, Jr, Evanseck JD, Field MJ, Fischer S, Gao J, Guo H, Ha S, Joseph-McCarthy D, Kuchnir L, Kuczera K, Lau FTK, Mattos C, Michnick S, Ngo T, Nguyen DT, Prodhom B, Reiher WE, III, Roux B, Schlenkrich M, Smith JC, Stote R, Straub J, Watanabe M, Wiorkiewicz-Kuczera J, Yin D, Karplus M. J Phys Chem B. 1998;102:3586. doi: 10.1021/jp973084f. [DOI] [PubMed] [Google Scholar]
- 29.Cozzetto D, Kryshtafovych A, Fidelis K, Moult J, Rost B. Tramontano, A Proteins. 2009;77(Suppl 9):18. doi: 10.1002/prot.22561. [DOI] [PMC free article] [PubMed] [Google Scholar]
- 30.Wu S, Skolnick J, Zhang Y. BMC Biology. 2007;5:17. doi: 10.1186/1741-7007-5-17. [DOI] [PMC free article] [PubMed] [Google Scholar]
- 31.Zhang Y. BMC Bioinformatics. 2008;9:40. doi: 10.1186/1471-2105-9-40. [DOI] [PMC free article] [PubMed] [Google Scholar]
- 32.Holm L, Sander C. J Mol Biol. 1993;233:123. doi: 10.1006/jmbi.1993.1489. [DOI] [PubMed] [Google Scholar]
- 33.Zemla A. Nucleic Acids Res. 2003;31:3370. doi: 10.1093/nar/gkg571. [DOI] [PMC free article] [PubMed] [Google Scholar]
- 34.Bhattacharya A, Tejero R, Montelione GT. Proteins. 2007;66:778. doi: 10.1002/prot.21165. [DOI] [PubMed] [Google Scholar]
- 35.Laskowski RA, MacArthur MW, Moss DS, Thornton JM. J Appl Cryst. 1993;26:283. [Google Scholar]
- 36.Lüthy R, Bowie JU, Eisenberg D. Nature. 1992;356:83. doi: 10.1038/356083a0. [DOI] [PubMed] [Google Scholar]
- 37.Sippl MJ. Proteins. 1993;4:355. doi: 10.1002/prot.340170404. [DOI] [PubMed] [Google Scholar]
- 38.Lovell SC, Davis IW, Arendall WB, III, de Bakker PI, Word JM, Prisant MG, Richardson JS, Richardson DC. Proteins. 2003;50:437. doi: 10.1002/prot.10286. [DOI] [PubMed] [Google Scholar]
- 39.Wallner B, Elofsson A. Protein Sci. 2003;12:1073. doi: 10.1110/ps.0236803. [DOI] [PMC free article] [PubMed] [Google Scholar]
- 40.Cristobal S, Zemla A, Fischer D, Rychlewski L, Elofsson A. BMC Bioinformatics. 2001;2:5. doi: 10.1186/1471-2105-2-5. [DOI] [PMC free article] [PubMed] [Google Scholar]
- 41.Siew N, Elofsson A, Rychlewski L, Fischer D. Bioinformatics. 2000;16:776. doi: 10.1093/bioinformatics/16.9.776. [DOI] [PubMed] [Google Scholar]
- 42.McGuffin LJ. Bioinformatics. 2008;24:586. doi: 10.1093/bioinformatics/btn014. [DOI] [PubMed] [Google Scholar]
- 43.Huey R, Morris GM, Olson AJ, Goodsell DS. J Comput Chem. 2007;28:1145. doi: 10.1002/jcc.20634. [DOI] [PubMed] [Google Scholar]
- 44.Morris GM, Huey R, Lindstrom W, Sanner MF, Belew RK, Goodsell DS, Olson AJ. J Comput Chem. 2009;30:2785. doi: 10.1002/jcc.21256. [DOI] [PMC free article] [PubMed] [Google Scholar]
- 45.Chapman B, Chang J. ACM SIGBIO Newslett. 2000;20:15. [Google Scholar]
- 46.Hamelryck T, Manderick B. Bioinformatics. 2003;19:2308. doi: 10.1093/bioinformatics/btg299. [DOI] [PubMed] [Google Scholar]
- 47.R Development Core Team. R. A language and environment for statistical computing. R Foundation for Statistical Computing; Vienna, Austria: 2008. [Google Scholar]
- 48.DeLano WL. DeLano Scientific. San Carlos, CA: 2002. [Google Scholar]
- 49.Orengo CA, Michie AD, Jones DT, Swindells MB, Thornton JM. Structure. 1997;5:1093. doi: 10.1016/s0969-2126(97)00260-8. [DOI] [PubMed] [Google Scholar]
- 50.Sousa SF, Fernandes PA, Ramos MJ. Proteins. 2006;65:15. doi: 10.1002/prot.21082. [DOI] [PubMed] [Google Scholar]
- 51.Fan H, Irwin JJ, Webb BM, Klebe G, Shoichet BK, Sali A. J Chem Inf Model. 2009;49:2512. doi: 10.1021/ci9003706. [DOI] [PMC free article] [PubMed] [Google Scholar]
- 52.Cozzini P, Kellogg GE, Spyrakis F, Abraham DJ, Costantino G, Emerson A, Fanelli F, Gohlke H, Kuhn LA, Morris GM, Orozco M, Pertinhez TA, Rizzi M, Sotriffer CA. J Med Chem. 2008;51:6237. doi: 10.1021/jm800562d. [DOI] [PMC free article] [PubMed] [Google Scholar]
- 53.Wong CF. Biochim Biophys Acta. 2008;1784:244. doi: 10.1016/j.bbapap.2007.10.005. [DOI] [PubMed] [Google Scholar]
- 54.Totrov M, Abagyan R. Curr Opin Struct Biol. 2008;18:178. doi: 10.1016/j.sbi.2008.01.004. [DOI] [PMC free article] [PubMed] [Google Scholar]
- 55.B-Rao C, Subramanian J, Sharma SD. Drug Discov Today. 2009;14:394. doi: 10.1016/j.drudis.2009.01.003. [DOI] [PubMed] [Google Scholar]
- 56.Panjkovich A, Melo F, Marti-Renom MA. Genome Biol. 2008;9:R68. doi: 10.1186/gb-2008-9-4-r68. [DOI] [PMC free article] [PubMed] [Google Scholar]