Abstract
Magnetic drug delivery refers to the physical confinement of therapeutic magnetic nanoparticles to regions of disease, tumors, infections and blood clots. Predicting the effectiveness of magnetic focusing in vivo is critical for the design and use of magnetic drug delivery systems. However, current simple back-of-the-envelope estimates have proven insufficient for this task. In this article, we present an analysis of nanoparticle distribution, in and around a single blood vessel (a Krogh tissue cylinder), located at any depth in the body, with any physiologically relevant blood flow velocity, diffusion and extravasation properties, and with any applied magnetic force on the particles. For any such blood vessel our analysis predicts one of three distinct types of particle behavior (velocity dominated, magnetic dominated or boundary-layer formation), which can be uniquely determined by looking up the values of three nondimensional numbers we define. We compare our predictions to previously published magnetic-focusing in vitro and in vivo studies. Not only do we find agreement between our predictions and prior observations, but we are also able to quantitatively explain behavior that was not understood previously.
Keywords: blood vessels, ferromagnetic nanoparticles, in vivo experiments, magnetic drug targeting, nondimensional parameters, simulations, tissue, treatment depth
In magnetic drug targeting, magnetic particles containing or coated with therapeutics are concentrated to sites of disease by applied magnetic fields. This has allowed focusing of chemotherapy to solid tumors in Phase I human clinical trials [1], and in animal experiments [2-5], and is being used to target drugs to other types of disease locations (e.g., to regions of thrombosis [6]). During such treatments, magnetic particles are usually injected into the bloodstream, and magnets are then used to concentrate them to target locations. There is a need to know which locations can or cannot be effectively reached by magnetic drug targeting. Key issues include whether the applied magnetic forces can hold particles against blood flow, at which body depth, in which blood vessels, and how far particles subsequently travel from the vessels into surrounding tissue.
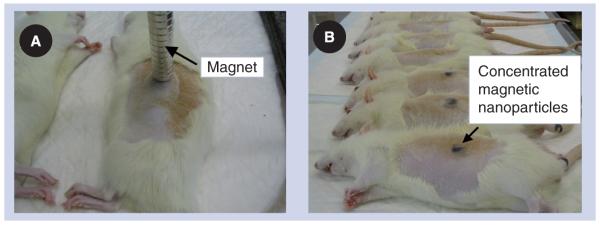
Physical parameters, such as particle size and materials, as well as magnet placement, size, shape and strength, are crucial for the success of magnetic drug focusing. However, there is little ability to predict how these parameters will affect particle behavior in vivo. This has forced critical magnetic drug delivery design choices to be made based on intuition, empirical data and simple engineering estimates – and these rough tools are proving insufficient. For example, the question of whether magnets can or cannot hold nanoparticles against blood flow is often addressed when designing experiments by comparing the maximum force that the blood flow exerts on a particle against the applied magnetic force. This analysis underpredicts the ability of a magnetic field to hold particles against blood flow, and does not match behavior observed in animal experiments. In rats, the slowest blood flow velocity, in capillaries, has been measured to be approxiately 0.1 mm/s [7], a velocity that will create a (Stokes) drag force [8] of Fblood ≈ 7 × 10⁻¹³ Newtons on a 250 nm diameter particle at the vessel center. For the rat experiments shown in Figure 1, a 0.5 Tesla, 5 cm long, 5 mm wide permanent magnet was used to concentrate 250 nm diameter iron oxide nanoparticles underneath the skin against blood flow. The magnetic field created by this magnet, and the resulting magnetic force [8], works out to be only Fmag ≈ 1 × 10⁻¹³ Newtons, a factor of a seventh smaller. This calculation suggests that blood flow forces will overcome the applied magnetic forces; yet, magnetic drug focusing was clearly observed, as shown in Figure 1. This experiment was repeated for 100 nm particles, in which case the magnetic force is 109 times smaller than the vessel centerline blood drag force, yet focusing remained successful.
Figure 1. Rat experiments.
(A) The 0.5 T magnet and (B) concentrated ferrofluid is visible under the skin after treatment [15].
Figure adapted with permission from C Bergemann (Chemicell, Berlin, Germany) and A Lübbe (Medical Center for Health, Bad Lippspringe, Germany).
Methods
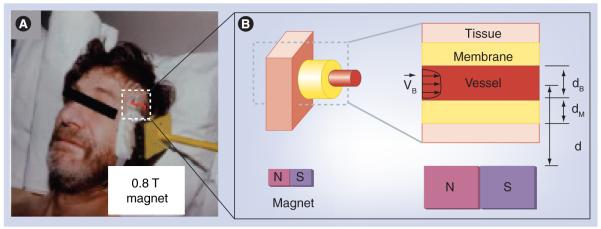
As shown in Figure 2B, we focus our attention on nanoparticle behavior in and around a single blood vessel (a Krogh tissue cylinder geometry [9]). This blood vessel can be of any type, from a major artery or a vein, to a minor capillary, fenestrated or not, at any depth, and any applied magnetic force can be considered. Instead of using simple engineering estimates, starting from physical first principles, we state and then solve the equations governing the diffusion, convection and magnetic transport of nanoparticles in the blood and into surrounding tissue. These equations describe the time progression of the nanoparticle concentration at every spatial location in the blood and surrounding tissue. The first equation captures particle transport due to convection by blood flow, particle diffusion (including particle scattering by collisions with blood cells [10]), and particle motion due to magnetic forces (see [11] for details).
| (1) |
Here, CB is the concentration of particles at each location in the blood, is the blood velocity, t is time, ▽ is the gradient operator, and Pe and Ψ are the Péclet and magnetic-Richardson numbers. The next two equations include diffusion and transport in the endothelial membrane and surrounding tissue. This type of formulation is standard, and, as in [9], extravasation (or lack thereof) is modeled by adjusting the diffusion coefficient in the endothelium, D, to a nonzero (or zero) value. Additional tissue-specific properties, for example, decreased resistance to nanoparticle motion owing to a compromised extracellular matrix with larger interstitial spaces in a tumor region, can be accounted for by decreasing the magnetic drift coefficient (the magnetic-Richardson number), Ψ, in that region. Increased interstitial tumor pressure can decrease blood flow velocity into a tumor and, therefore, is reflected by choosing an appropriately lower VBmax velocity in affected blood vessels.
| (2) |
CM and CT are the concentrations of particles at every location in the endothelial membrane and tissue, and D and DT are the endothelium and tissue Renkin-reduced diffusion coefficients. As shown in Figure 2B, it is assumed that the blood vessel is aligned perpendicularly to the applied magnetic force. If the vessel is at an angle to the magnetic force, then only the perpendicular part of the force should be used for FM below, and the tangential part can be added to the drag forces along the blood vessel, to FS. These equations are stated in nondimensional variables, meaning the variables used have been chosen to highlight the competition between phenomena: between blood drag and magnetic forces, and between diffusion in the blood and surrounding tissue. This nondimensional scaling reveals the key numbers Ψ, D, DT and Pe, which uniquely determine particle behavior [11].
Figure 2. Simulation domain.
(A) Magnetic drug focusing in Phase I human clinical trials [1].
(B) We consider a single blood vessel (of any size, depth and blood velocity) and surrounding tissue and analyze the spatial distribution of magnetic particles.
(A) Adapted with permission from A Lübbe (Medical Center for Health, Bad Lippspringe, Germany).
Specifically, the magnetic-Richardson number, Ψ, quantifies the ratio between the applied magnetic forces and the maximum drag forces that the blood in that vessel can exert on the nanoparticles. We define it as the ratio:
| (3) |
The magnetic force depends both on the magnetic field (units: A/m) created by the magnet and its spatial gradient [] (A/m2), and both must be known at the vessel location to compute the magnetic force (see [11] and Supplementary Figure 1 [www.futuremedicine.com/doi/suppl/10.2217/nnm.10.104]). In Equation 3, is the equilibrium velocity (m/s) of the nanoparticle created by the applied magnetic force. To compute Ψ, as well as D, DT and Pe, all variables should be stated in SI units (e.g., as a = 10−7 m for a 100 nm radius particle, then all units will exactly cancel, yielding the four nondimensional numbers; see the detailed instructions in the supplementary material and in [11]). As the magnetic-Richardson number increases beyond 1, the magnetic force exceeds the blood drag force at the vessel centerline. Thus, the Richardson number is a key indicator of the success of magnetic drug focusing, but, as noted previously, magnetic focusing can occur even if this number is substantially below 1 (as in the rat example).
The second key number that determines the success of magnetic drug delivery is the mass Péclet number [12]. It quantifies the competition between particle movement (convection) by blood flow versus particle diffusion in the blood, and is defined as:
| (4) |
Here, DTot (in m2/s) takes into account the scattering of nanoparticles by collisions with blood cells, an effect that can be modeled as additional diffusion [10]. For 250 nm diameter particles in rat capillaries, Pe ≈ 1000, meaning nanoparticles are convected much faster than they diffuse.
Finally, the Renkin-reduced diffusion coefficients [9], for the endothelium membrane and the surrounding tissue, are defined as:
| (5) |
| (6) |
where DB is the particle diffusion in blood caused by thermal fluctuations, DS is the additional diffusion caused by collision with blood cells, DM is the diffusion in the endothelial membrane (it is set to zero if there is no extravasation), and DT is the particle diffusion in surrounding tissue (all in units m2/s). As an example, for 250 nm diameter particles, leaky tumor rat capillaries with fenestrations on the order of 600 nm have a membrane Renkin coefficient of D ≈ 0.36; for a tumor extracellular spacing of 1 μm, the tissue Renkin coefficient is DT ≈ 0.56 [9].
Under physiological conditions, for vessel diameters and blood velocities ranging from dB= 6 μm and VBmax= 0.1 mm/s (rat capillaries) to dB = 3 cm and VBmax = 40 cm/s (human aorta), and for achievable physical parameters, particle diameters ranging from 1 nm to 5 μm, and magnet field strengths no greater than 4 Tesla (MRI strengths), the four nondimensional parameters can range between 4 × 10⁻¹⁸ ≤ Ψ ≤ 6 × 10³, 1 ≤ Pe ≤ 1 × 10¹², and 0 ≤ min(D, DT) ≤ 1 (it suffices to consider the minimum of the two Renkin coefficients, as the smaller coefficient determines the behavior). To map nanoparticle behaviors across this entire parameter space, we first divided our nondimensional number space (i.e., Richardson, Péclet and Renkin) into a coarse 7 × 7 × 5 grid, and carried out a simulation of particle behavior at each number triplet (a total of 245 simulations). This revealed the three types of behaviors shown in Figure 3 and discussed next. To identify more precisely the boundaries between these three behavior types, we carried out 475 further simulations on a finer grid, which spanned the transitions from one type of behavior to another.
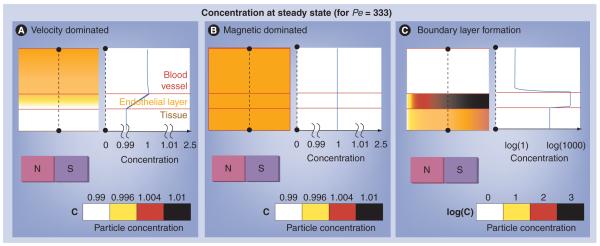
Figure 3. The three behaviors.
(A) Velocity dominated, (B) magnetic dominated and (C) a boundary layer formation. In each of the three panels, the top, middle and bottom layers show a cross-section through the blood vessel, endothelial layer and surrounding tissue, respectively; the equilibrium distribution of nanoparticles is shown by the coloring (white = low; black = high; but case (C) is shown in a log scale); and the blue curve on the right shows the concentration of nanoparticles at the dotted black line location. Both the velocity and magnetic dominated case have a nearly uniform nanoparticle concentration (note the zoomed in 0.99 to 1.01 concentration scale for cases [A & B] versus the log scale for case [C]). The focusing magnet is located at the bottom and pulls nanoparticles towards it. Only in the boundary layer case does a distinct concentration build-up occur and the concentration within the tissue exceeds that of the blood vessel. The velocity dominated case does not easily allow particles to enter the tissue due to the constant movement of particles out of the blood vessel. The magnetic dominated case allows particles to enter the vessel membrane and tissue space but does not concentrate them within the vessel membrane or tissue. Only the boundary layer case enables particles to significantly concentrate within the vessel membrane and tissue space.
See [11] for more details.
For each Richardson–Péclet–Renkin triplet, we evaluated the transient and final concentration of nanoparticles, in the blood, endothelial membrane and surrounding tissue, according to Equations 1 & 2. Initially, this was done using the commercial multiphysics package COMSOL [101], a package that has been used fairly commonly in the magnetic drug delivery literature for its ability to couple partial differential equations. In the numerical methods community, it is well known that high Péclet number cases are extremely difficult to solve; COMSOL failed to solve cases for Pe values greater than 1300. To achieve the solutions for Pe numbers as high as 1012, we developed and implemented a sophisticated inhouse numerical method. Our resulting vessel–membrane–tissue (VMT) solver for the partial differential Equations 1 & 2 is based on a combination of the following four techniques:
▪ Factorization of the differential operator as a product of 1D differential operators and efficient solution of the corresponding ordinary differential equations at every time step (the ADI method [13]);
▪ Use of a graded mesh in the vessel domain;
▪ Use of changes of unknowns that transform the spatial operators in the membrane and tissue domains into operators of Helmholtz type, which enables the use of highly optimized steady-state solvers;
▪ An on-and-off fluid-freezing methodology designed to effectively resolve the large time-scale separation between the dynamics in the blood domain and the much slower diffusion processes in the membrane and tissue.
The details underlying the VMT solver can be found in [11], and a future contribution in [Beni et al., Manuscript in Preparation]. The VMT solver was both more accurate and 500 times faster than COMSOL, and it was able to solve cases that COMSOL could not. Our recent work shows that significant further improvements of the algorithm are feasible [Beni et al., Manuscript in Preparation].
The VMT simulations predicted nanoparticle behavior for any scenario within the considered range of physiological/feasible circumstances. For any blood vessel, at any body depth, with any diameter, and blood flow velocity, for nanoparticles of any size and material properties under any applied magnetic field, there is a corresponding nondimensional number triplet (Richardson–Péclet–Renkin), given by Equations 3-6, which uniquely determines nanoparticle behavior in and around that blood vessel. By looking up the behavior of that triplet on our grid of 720 conducted simulations, we predicted the type of behavior (Figures 3 & 4), and compared it against available in vitro and in vivo magnetic drug delivery experiments. We found excellent agreement (Figure 5) and were able to explain observed behavior that was not previously understood.
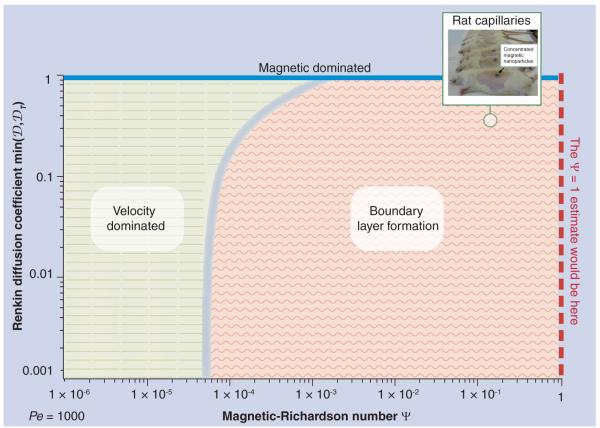
Figure 4. The behavior of nanoparticles for varying richardson and renkin numbers at a fixed Péclet number (corresponding to the rat capillary example).
The three behavior domains are shown: velocity dominated on the left, boundary layer on the right (with a continuous transition region between them) and a strip of magnetic dominated cases at the top for Renkin numbers near unity. For any Richardson and Renkin pair, the predicted nanoparticle behavior is determined by looking up that (Richardson, Renkin) point on the graph and seeing which region it falls into. Note that the minimum of the endothelium and tissue Renkin numbers determines the type of behavior and so it is this quantity that is used on the vertical axis. The rat capillary example is marked by the green circle.
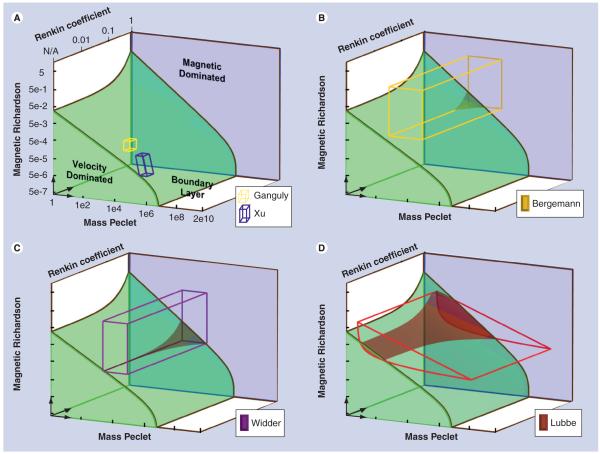
Figure 5. The experimental domains of prior studies plotted on a 3d representation of the nondimensional number space versus our predictions.
The shaded regions show the three behavior types: magnetic dominated against the back in blue; velocity dominated at the bottom left (the curved green ramp shape); and boundary layer formation everywhere else (in white). The in vitro experiments are shown as small boxes [14,16]; the in vivo experiments are shown as large colored wireframes (the two boxes and the extruded curved triangle) [1,5,15]. Regions where the experiments leave the boundary layer formation region and enter the velocity dominated region are denoted by translucent shading (seen in the Lübbe, Widder and Bergemann cases, Ganguly and Xu remain wholly in the boundary layer domain). The outlined shapes cover the range of cases expected in the experiments. In all cases, the observed absence or presence of magnetic drug focusing matched our theoretical predictions. All of these experiments were designed to be successful and they all largely lie in the boundary build-up domain, although for Lübbe [1] there are deeper vessels with faster blood flows which fall into the velocity dominated case. Our analysis correctly predicted when those situations occurred.
See [11] for a more detailed version of this figure.
Results & discussion
Magnetic nanoparticles travel through the blood and into the surrounding tissue under three competing effects: under blood convection, diffusion (including both extravasation and scattering by blood cells [9,10]), and from the pull of the applied magnetic fields. The Richardson, Péclet, and Renkin numbers quantify the competition between these three effects (Equations 3-6).
Our simulations revealed the three types of behavior shown in Figure 3. In the velocity-dominated case, the created magnetic forces are weak compared with the blood flow forces, so they cannot capture the particles and, therefore, the nanoparticles are washed out the back of the blood vessel. In the magnetic-dominated case, the magnetic forces far exceed the ability of the vessel membrane and tissue to resist particle motion, to the point where the particles are pulled by the magnet out of the vessel and, eventually, also out of the region of tissue being considered. This case either requires exceedingly strong magnetic forces, or a blood vessel membrane that does not substantially inhibit particle movement (e.g., a sufficiently ‘leaky’ tumor vessel). In the boundary-layer case, nanoparticles accumulate in a layer at the vessel wall and, if extravasation is possible, are then in the correct location to enter the surrounding tissue. It is this last case that is most interesting and effective for drug delivery, as the applied magnetic field serves to concentrate the therapeutic.
To understand which behaviors occur, and when, we first show a case for a fixed Péclet number of Pe = 1000 (Figure 4), as corresponds to our previous rat capillary example. For each (Richardson–Renkin) pair, it shows which behavior is occurring. The behavior switches from velocity-dominated to boundary-layer cases as the Richardson number increases, but, as seen from the plot, and described earlier, this transition can happen well before the magnetic forces attain the value of blood drag forces at the vessel centerline. For Pe = 1000, the boundary-layer behavior begins when Ψ exceeds 5 × 10⁻⁵ (i.e., when the magnetic forces have reached just 0.005% of the centerline drag forces). The transition from the velocity to boundary-layer behavior is gradual, so we show the delineation between them as a ‘fuzzy’ border. This transition is delayed as the Renkin number increases (the angled border at the top of the plot) because, if diffusion in the endothelium and tissue is high, any build-up of particles in the tissue can diffuse more easily back out into the vessel, and then be swept away by blood flow. For the rat capillary example, Figure 4 allows us to read how much magnetic force is necessary to achieve magnetic focusing – from the log scale, the magnetic force applied should be greater than 0.005% of the centerline blood drag force.
The work flow for utilizing the predictive capabilities of this method is outlined in Supplementary Figure 1 (www.futuremedicine.com/doi/suppl/10.2217/nnm.10.104). Initially, the researcher should determine the variables involved in the experiment. Then they should calculate the parameters necessary for determining the nondimensional numbers using the equations provided. Finally, knowing the nondimensional numbers associated with the experiment enables the researcher to predict the nanoparticle behavior within the specific experimental set-up.
Figure 5 provides the dependence on all three nondimensional numbers, as well as a comparison against the five available prior in vitro and in vivo experimental studies of magnetic focusing. Each study had a range of nondimensional numbers associated with it. In vitro studies typically had a small range, owing to tightly controlled experimental conditions. In vivo studies had a larger spread, since a range of organism parameters must be considered, encompassing small and large, shallow and deep blood vessels with a wide physiological range of blood flow velocities. Based on this, shapes could be drawn that outline the range of parameters in each animal or human experiment (details in [11]). Figure 5 shows the ranges for each study against our predicted behaviors. In all cases, we found that, when magnetic focusing was observed (or not), in the in vitro cases, or to certain depths for slow or fast blood flows in the human and animal experiments, it matched our predictions. We were able to correctly predict both the occurrence and amount of magnetic capture in in vitro experiments (even in a case where the standard force comparison failed, thus resolving an open question noted by the authors [14]). For in vivo experiments we correctly predicted observed particle accumulation in rats [5,15], as well as the depth of focusing (~5 cm) in a human head-and-neck tumor (as was measured by MRI after the treatment) [1]. Thus, our analysis provides an accurate way of predicting behavior across the range of physiological and expected engineering parameters and, as such, it should be a valuable tool for the design of next-generation magnetic drug delivery systems.
Future perspective
Magnetic drug delivery is emerging as a powerful drug-targeting option, with the ability to physically direct therapeutics to sites of disease [1,4,6]. The design of effective magnetic drug delivery systems is an endeavor that must match engineering to physiology and, as such, it requires an ability to understand and predict how engineering choices (e.g., particle size and composition, magnet placement, shape and strength) affect drug distribution in vivo. This cannot be achieved through animal experiments alone – the number of animals that would be required to exhaustively search the design space is staggering – and current simple back-of-the-envelope analyses have proved insufficient. Thus, there is a broad need for the type of modeling conducted by our group. Although physiological behavior is complex, and predicting it is a great challenge, our current analysis is a sensible next step – it uses physical first principles and available physiological information, and is effective. Weak points of the modeling must now be identified, such as our simple treatment of extravasation as diffusion [9], and should be rank ordered (to assess which weaknesses should be addressed first to improve the predictions and enable better design of next-generation magnetic drug delivery systems) and, then, in vitro and animal experiments must be devised to isolate, understand, measure and fix the weaknesses. For example, we are currently creating experiments to precisely measure particle transport through excised tissue and blood vessel walls under carefully applied magnetic forces to quantify diffusion and extravasation. The suite of tools that we will build will teach us a great deal about the behavior of nano-particles in vivo, and will enable better design and optimization of next-generation magnetic drug delivery systems.
Supplementary Material
Acknowledgments
This research was supported in part by NIBIB/NIH grant number R21EB009265. We would like to thank the support provided by a NPSC graduate fellowship in addition to support from the Air Force Office of Scientific Research and the National Science Foundation.
Footnotes
Financial & completing interests disclosure The authors have no other relevant affiliations or financial involvement with any organization or entity with a financial interest in or financial conflict with the subject matter or materials discussed in the manuscript apart from those disclosed.
No writing assistance was utilized in the production of this manuscript.
Ethical conduct of research The authors state that they have obtained appropriate insti tutional review board approval or have followed the principles outlined in the Declaration of Helsinki for all human or animal experimental investigations. In addition, for investi gations involving human subjects, informed consent has been obtained from the participants involved.
Bibliography
Papers of special note have been highlighted as:
▪ of interest
▪▪ of considerable interest
- 1.Lübbe AS, Bergemann C, Riess H, et al. Clinical experiences with magnetic drug targeting: a Phase I study with 4′-epidoxorubicin in 14 patients with advanced solid tumors. Cancer Res. 1996;56(20):4686–4693. ▪▪ Published study of Phase 1 human clinical trials of magnetic drug targeting with an emphasis on toxicity.
- 2.Häfeli UO, Pauer GJ. In vitro and in vivo toxicity of magnetic microspheres. J. Magn. Magn. Mater. 1999;194(1–3):76–82. [Google Scholar]
- 3.Schulze K, Koch A, Schöpf B, et al. Intraarticular application of superparamagnetic nanoparticles and their uptake by synovial membrane – an experimental study in sheep. J. Magn. Magn. Mater. 2005;293(1):419–432. [Google Scholar]
- 4.Tang T, Zheng JW, Chen B, et al. Effects of targeting magnetic drug nanoparticles on human cholangiocarcinoma xenografts in nude mice. Hepatobiliary Pancreat. Dist. 2007;6(3):303–307. [PubMed] [Google Scholar]
- 5.Widder KJ, Morris RM, Poore G, Howard DP, Senyei AE. Tumor remission in yoshida sarcoma-bearing rats by selective targeting of magnetic albumin microspheres containing doxorubicin. Proc. Natl Acad. Sci. USA. 1981;78:579–581. doi: 10.1073/pnas.78.1.579. [DOI] [PMC free article] [PubMed] [Google Scholar]
- 6.Orekhova NM, Akchurin RS, Belyaev AA, Smirnov MD, Ragimov SE, Orekhov AE. Local prevention of thrombosis in animal arteries by means of magnetic targeting of aspirin-loaded red cells. Thromb. Res. 1990;57(4):611. doi: 10.1016/0049-3848(90)90078-q. [DOI] [PubMed] [Google Scholar]
- 7.Braun RD, Abbas A, OBukhart SO, Willson W., 3rd Hemodynamic parameters in blood vessels in choroidal melanoma xenografts and rat choroid. Invest. Ophthalmol. Vis. Sci. 2002;43(9):3045–3052. [PMC free article] [PubMed] [Google Scholar]
- 8.Pankhurst QA, Connolly J, Jones SK, Dobson J. Applications of magnetic nanoparticles in biomedicine. J. Phys. D. Appl. Phys. 2003;36:R167–R181. [Google Scholar]
- 9.Fournier RL. Basic Transport Phenomena in Biomedical Engineering. Taylor & Francis; NY, USA: 2007. ▪▪ Engineering approach to biological transport systems, with detailed information on incorporating the biology into an engineering framework.
- 10.Grief AD, Richardson G. Mathematical modeling of magnetically targeted drug delivery. J. Magn. Magn. Mater. 2005;293(1):455–463. ▪ Overview of the subtle biological impact on parameters involved in magnetic drug targeting in vivo.
- 11.Nacev AN, Beni CE, Bruno OP, Shapiro B. The behaviors of ferro-magnetic nano-particles in and around blood vessels under applied magnetic fields. J. Magn. Magn. Mater. 2010 doi: 10.1016/j.jmmm.2010.09.008. (In press) ▪▪ States the governing equations, carries out the nondimensionalization, and derives the three key nondimensional parameters (the Richardson, Peclet and Renkin numbers), exhaustively examines further cases (e.g., nonuniform magnetic forces and curved blood vessels), has a comprehensive literature review, and a detailed comparison to prior published experimental studies.
- 12.Incropera FP. Fundamentals of Heat and Mass Transfer. John Wiley; NJ, USA: 2007. [Google Scholar]
- 13.Peaceman DW, Rachford HH., Jr The numerical solution of parabolic and elliptic differential equations. J. Soc. Ind. Appl. Math. 1955;8(1):28–41. [Google Scholar]
- 14.Xu H, Song T, Bao X, Hu L. Site-directed research of magnetic nanoparticles in magnetic drug targeting. J. Magn. Magn. Mater. 2005;293:514–519. [Google Scholar]
- 15.Alexiou C, Arnold W, Klein RJ, et al. Locoregional cancer treatment with magnetic drug targeting 1. Cancer Res. 2000;60:6641–6648. [PubMed] [Google Scholar]
- 16.Ganguly R, Gaind AP, Sen S, Puri IK. Analyzing ferrofluid transport for magnetic drug targeting. J. Magn. Magn. Mater. 2005;289:331–334. [Google Scholar]
▪ Website
- 101.COMSOL www.comsol.com.
Associated Data
This section collects any data citations, data availability statements, or supplementary materials included in this article.


