

Abstract
Negative feedback from horizontal cells to cone photoreceptors is regarded as the critical pathway for the formation of the antagonistic surround of retinal neurons, yet the mechanism by which horizontal cells accomplish negative feedback has been difficult to determine. Recent evidence suggests that feedback uses a novel, non-GABAergic pathway that directly modulates the calcium current in cones. In non-mammalian vertebrates, enrichment of retinal pH buffering capacity attenuates horizontal cell feedback, supporting one model in which feedback occurs by horizontal cell modulation of the extracellular pH in the cone synaptic cleft. Here we test the effect of exogenous pH buffering on the response dynamics of H1 horizontal cells and the center-surround receptive field structure of parasol ganglion cells in the macaque monkey retina. Enrichment of the extracellular buffering capacity with HEPES selectively attenuates surround antagonism in parasol ganglion cells. The H1 horizontal cell light response includes a slow, depolarizing component that is attributed to negative feedback to cones. This part of the response is attenuated by HEPES and other pH buffers in a dose-dependent manner that is correlated with predicted buffering capacity. The selective effects of pH buffering on the parasol cell surround and H1 cell light response suggests that, in primate retina, horizontal cell feedback to cones is mediated via a pH-dependent mechanism and is a major determinant of the ganglion cell receptive field surround.
Keywords: retina, horizontal cell, ganglion cell, feedback, surround, proton
Introduction
A basic characteristic of many neurons in the early visual system is a center-surround receptive field, whereby cells respond strongly to small stimuli but weakly to large stimuli (Kuffler, 1953). The center-surround receptive field first appears in cone photoreceptors and is thought to be generated by an inhibitory feedback signal from second-order interneurons, the horizontal cells (for review, see Wu, 1992; Burkhardt, 1993; Piccolino, 1995; Kamermans and Spekreijse, 1999; Schwartz, 2002). Despite considerable study, the synaptic mechanism that mediates this feedback has been difficult to identify and remains controversial. Early experiments in non-mammalian retina suggested that horizontal cell feedback to cones was mediated by a GABAergic synapse, but more recent experiments show that feedback is not affected by pharmacological manipulation of GABAergic neurotransmission (Thoreson and Burkhardt, 1990; Verweij et al., 1996; Vessey et al., 2005) and that horizontal cell feedback operates via a nonvesicular mechanism that shifts the voltage activation curve of calcium channels on cone axon terminals to more negative potentials (Verweij et al., 1996; Kraaij et al., 1999; Hirasawa and Kaneko, 2003; Cadetti and Thoreson, 2006). This shift opens calcium channels, causing a depolarization that opposes the light-induced photoreceptor hyperpolarization.
Pharmacological results in goldfish have supported two different models of horizontal cell modulation of cone calcium channels. Sensitivity to carbenoxolone, which blocks gap junctions, has been used as evidence for an ephaptic mechanism of horizontal cell feedback. This proposal postulates that the gating of voltage-dependent cone calcium channels is modulated by extracellular voltage gradients that result from current through gap junction hemichannels on horizontal cell dendrites in response to horizontal cell voltage changes (Byzov and Shura-Bura, 1986; Kamermans et al., 2001; Kamermans and Fahrenfort, 2004). Sensitivity to pH buffers, such as HEPES, support an alternative proton-dependent mechanism. According to this proposal, light-driven hyperpolarization of the horizontal cell alkalinizes the cone synaptic cleft. The decrease in proton concentration shifts the voltage activation curve of cone Ca2+ channels in the negative direction, and the resulting increase in Ca2+ influx counteracts the cone light response by depolarizing the cell and increasing transmitter release (Barnes and Bui, 1991; Barnes et al., 1993; DeVries, 2001; Barnes, 2003; Hirasawa and Kaneko, 2003; Vessey et al., 2005; Cadetti and Thoreson, 2006).
In primate retina, the receptive field surrounds of both cones and ganglion cells also appear to be primarily mediated by a non-GABAergic mechanism (Verweij et al., 2003; McMahon et al., 2004). As in goldfish, carbenoxolone attenuates a feedback-associated slow depolarization in macaque monkey H1 horizontal cells (Packer and Dacey, 2005) and in addition blocks the antagonistic surrounds of parasol ganglion cells (McMahon et al., 2004) and long- and middle-wavelength-sensitive cones (Verweij et al., 2003). However, the specificity of carbonoxolone for gap junctions has been questioned recently (Vessey et al., 2004), and the effect of exogenous pH buffers have not been tested on any measures of the receptive field surround in primate. Here we provide evidence that enrichment of retinal pH buffering selectively attenuates the surrounds of parasol ganglion cells and also blocks a slow, depolarizing component of the H1 horizontal cell light response believed to reflect inhibitory feedback to cones. The results support, in a mammalian retinal model, the hypothesis that horizontal cell to cone negative feedback is dependent on the modulation of proton concentration at the synaptic cleft and that this novel feedback mechanism is critical for the formation of ganglion cell surrounds.
Materials and Methods
Tissue preparation.
Tissue was prepared as described previously (Dacey et al., 2000b). In brief, under deep barbiturate anesthesia, Macaca nemestrina or fascicularis retinas were enucleated and hemisected to remove the anterior pole, including the lens and vitreous humor. The retina, choroid, and pigment epithelium were dissected as a unit from the sclera. Radial cuts were made to flatten the retina, and it was fixed to a recording chamber with poly-l-lysine, vitreal side up. The chamber was mounted in an upright microscope. The retina was superfused with oxygenated Ames medium (Sigma, St. Louis, MO) and maintained at 36°C.
pH buffering.
The pH of control Ames medium, containing 22 mm NaHCO3, was adjusted to 7.4 at room temperature (∼21°C), after equilibration with 95% O2/5% CO2. Ames medium was supplemented with the additional pH buffers HEPES (pKa 7.4), MES (pKa 6.03), 3-(N-morpholino)-propanesulfonic acid (MOPS) (pKa 7.06), PIPES (pKa 6.7), and Tris (pKa 7.8), at concentrations from 1 to 20 mm and adjusted to pH 7.4 after equilibration with 95% O2/5% CO2 at room temperature. All buffers were obtained from Sigma. Buffering capacity was calculated as
 |
where B is the buffer concentration, K a is the buffer equilibrium constant, and H+ is the proton concentration at our experimental pH of 7.4 (3.98 × 10⁻⁸ m) (Chesler, 1998). The addition of 20 mm HEPES to Ames solution increased the osmolality from ∼280 to ∼310 mOsm. As a control for this increase, the effect of a similar increase in osmolality, achieved by adding ∼20 mm sucrose, was tested in several cells.
Electrical recording.
Glass microelectrodes (R = 250–500 MΩ) were filled with 2% Neurobiotin and 2% pyranine in 1 m K-acetate. Retinas were stained with the vital dye acridine orange (several drops of 50 μm solution were added to the bath) or 10 μm of the nuclear dye 4′,6′-diamidino-2-phenylindole (DAPI) (perfused over the retina for 30–60 min) and visualized with fluorescence episcopic illumination simultaneously with the microelectrode. Parasol ganglion cell bodies were targeted based on acridine orange staining of their large somas located in the ganglion cell layer (Watanabe and Rodieck, 1989; Dacey and Brace, 1992). Horizontal cells were identified by DAPI staining of their nuclei, located at the outer edge of the outer nuclear layer, and their distinctive spatial arrangement (Dacey et al., 1996). Identity of cell types was confirmed after iontophoresis of pyranine allowed the examination of dendritic morphology in vitro. The electrode tip was positioned next to the soma, and penetration was achieved by administering brief, high-frequency current oscillations via the buzz feature of the amplifier. Intracellular voltage was amplified (Axoprobe 2B; Molecular Devices, Sunnyvale, CA) and digitized at 10 kHz. Data acquisition was controlled by custom software.
Visual stimuli.
Visual stimuli were generated by a three-channel digital projector (VistaGRAPHX 2500; Christie Digital, Cypress, CA) controlled by custom software through a VSG3 stimulus generator (Cambridge Research Systems, Cambridge, UK) (Packer et al., 2001). The light stimulus was delivered to the camera port of the microscope via relay optics and brought into focus with a 4× objective producing a stimulus area of 2.96 × 2.22 mm on the retinal surface. Photoisomerization rates for the L, M, and S cones were calculated from the spectra of the red, green, and blue channels of the stimulator and the spectral sensitivities measured for macaque cones in vitro (Baylor et al., 1987). For the present experiments, all three channels were turned ON and attenuated by a 4 log unit neutral density filter to produce a white stimulus field at a midphotopic background intensity (L, M, and S cone photoisomerization rates of 2.5 × 10⁷, 1.9 × 10⁷, and 4.1 × 10⁶ photons/s/μm2, respectively). Three classes of spatial stimuli were used to determine the spatial structure of the parasol ganglion cell receptive field: flickering spots of varying diameter, flickering annuli of varying inner diameter, and drifting sinusoidally modulated gratings of varying spatial frequency. Stimuli were centered over the receptive field of the cell by moving small spots over the field and locating the position that elicited the peak response. Spots and annuli were modulated either as square waves or sinusoidally above and below the background luminance at 50% contrast (contrast = L MAX − L BKG/L BKG) at 2.03 Hz. Sine gratings were also modulated at 50% contrast and drifted across the receptive field at 2 Hz. Multiple cycles of stimuli were presented to the cell, and the responses were averaged and quantified by taking the amplitude of the Fourier component of the voltage response at the stimulus frequency. Spatial tuning curves derived from spot, annular, or grating stimuli were fit using a difference of Gaussians model of the receptive field that incorporates both the amplitude and phase of the neural response (Enroth-Cugell et al., 1983). Details and application of this model have been described previously (Dacey et al., 2000a; McMahon et al., 2004). In brief, response amplitudes and phases were used to determine the parameters of the model. There are six free parameters: the amplitude, radius, and phase of the center and surround Gaussians. The strengths of the center and surround mechanisms are defined by the integrated volumes of their best-fitting Gaussians. A measure of the effect of HEPES buffering on surround strength was taken as the ratio of control surround Gaussian volume and HEPES-buffered surround Gaussian volume. Drugs did not significantly effect surround width, and this parameter was thus held constant at a single best-fit value for the control and HEPES condition. Center width did not change from control to experimental condition, although in some instances the amplitude of the center response increased slightly during HEPES application. Significance was determined by performing a Student's t test, with a p value of <0.05 indicating significance.
Results
Previous results argue that non-GABAergic horizontal cell feedback to L and M cones contributes significantly to both the antagonistic surround of parasol ganglion cells and the slow depolarization of the horizontal cell light response (McMahon et al., 2004; Packer and Dacey, 2005). Here we examine the effect of exogenous pH buffering on these two measures of outer retinal feedback to begin to test the proton feedback hypothesis in the primate.
Parasol cells
The center-surround receptive field properties for six ON center and four OFF center parasol ganglion cells were determined using spots, annuli, and drifting sinusoidally modulated gratings (each at 50% contrast) before, during, and in some cases after washout of HEPES buffer. Figure 1 A shows an example of a typical ON parasol cell response. In response to a 300-μm-diameter spot centered over the receptive field and modulated at 2 Hz, ON center parasol cells showed a transient spike discharge on a sustained depolarization during light ON and a transient hyperpolarization at light offset (Fig. 1 A, left). A larger 2000-μm-diameter spot, stimulating both the center and the surround, evoked diminished and more transient responses at light onset and transient hyperpolarizations at light offset, indicative of surround antagonism (Fig. 1 B, left). In the presence of 20 mm HEPES, a 300 μm spot evoked a robust and sustained response (Fig. 1 A, right) that was similar to control in amplitude (HEPES/control response amplitude, 1.32 ± 0.17; p = 0.13; n = 10) but with reduced hyperpolarization at light offset. A 2000 μm spot in the presence of HEPES, unlike control, evoked a strong and sustained response (Fig. 1 B, right) that was 0.72 ± 0.04 of maximum (p < 0.001 vs control; n = 10), similar to that of the center-dominated responses shown in Figure 1 A. The overall effect of HEPES buffering on surround strength was quantified by plotting response amplitude as a function of spot diameter for control and HEPES condition and fitting the data with a difference of Gaussians receptive field model (see Materials and Methods). Data for a single ON parasol cell is shown in Figure 1 C. In the predrug condition, the response peaks ∼400 μm and then rolls off at larger spot diameters as surround antagonism increases. The best fit to the data gave a center-surround strength ratio near 1 (1.2). In contrast, HEPES buffering strongly reduces the roll off in response with larger-diameter stimuli and increased the center-surround ratio to 5.1. The ratio of HEPES surround strength to control surround strength for this cell was 0.23, or a 77% reduction in surround strength. Using the spot protocol, surround strength was reduced 61 ± 17.5% relative to control values (mean ± SD; maximum of 91%; minimum of 41%; n = 9) (Fig. 1 C, inset).
Figure 1.

HEPES attenuates parasol ganglion cell surround. A, Responses of an ON parasol ganglion cell to a 300-μm-diameter spot (stimulus trace below) square wave stimulus modulated at 2 Hz in the absence (left) and presence (right) of 20 mm HEPES. The responses are similar in both conditions. B, Responses of a parasol ganglion cell to a 2000-μm-diameter spot (stimulus trace below) square wave stimulus modulated at 2 Hz in the absence (left) and presence (right) of HEPES. The control response is small and transient because of surround antagonism. The response in HEPES is larger and more sustained, indicating diminished surround antagonism. C, Response amplitude as a function of spot diameter in the absence (open circles) and presence (filled circles) of 20 mm HEPES. Stimuli were spots sinusoidally modulated at 2 Hz. Solid lines are difference of Gaussian receptive field model fits to the data; insets are two-dimensional profiles of the model fits. Responses at small spot diameters are similar, but responses at larger spot diameters are larger in the presence of HEPES, and the ratio of center to surround (cntr/surr) response strength increases. The inset on the right shows the mean response normalized to the maximum amplitude for nine cells in the absence (solid line) and presence (dotted line) of 20 mm HEPES. In the presence of HEPES, the surround response is reduce by 61%. CTR, Control.
HEPES buffering at 20 mm similarly attenuated surrounds using annuli or drifting gratings to measure receptive field structure, further strengthening the conclusion that HEPES buffering selectively attenuates surround antagonism. As in Figure 1 B, the response to a large spot is transient (Fig. 2 but an annulus, which minimally stimulates the center, excites the surround and generates a response of opposite polarity to the center with a strong, sustained depolarization at light offset and hyperpolarization at light onset (compare Figs. 2 B, 1 A). In the presence of HEPES, the shape of the response to a spot was significantly changed (Fig. 2 A, right), showing strong, sustained responses similar to the center-dominated responses to small spot stimuli (compare with Fig. 1 A, left). The response to an annulus was smaller in HEPES than control, with transient responses at light onset and offset. This is consistent with a weakened surround producing a smaller, more transient OFF response and the center, the edge of which is stimulated by the annulus and which is not antagonized as strongly by the weak surround, producing a small ON response (Fig. 2 B, right). Difference of Gaussians fits to both annular and drifting sine wave gratings also show a very clear surround attenuation (Fig. 2 C,D). For the annular stimuli (Fig. 2 C), pure surround response to surround-isolating annuli is lost, and, for sine wave modulation of increasing spatial frequency, the response shifts from the classical bandpass shape given by center-surround antagonism to a low-pass, center-dominated response (Fig. 2 D). Overall reduction in surround strength derived from annular stimuli, and difference of Gaussian fits was 72 ± 24.5% (mean ± SD; maximum of 100%; minimum of 37%; n = 10) (Fig. 2 C, inset plot). For sine wave stimuli surround were similarly attenuated by 75 ± 16% of control values (mean ± SD; maximum of 99%; minimum of 48%; n = 7) (Fig. 2 D, inset plot). Combining all control and HEPES surround strength measurements from the difference of Gaussians fit to each dataset for spot, annular, and sine modulated stimuli gives a reduction in surround strength of 69 ± 20% (mean ± SD; maximum of 100%; minimum of 37%; n = 26).
Figure 2.

HEPES attenuates parasol ganglion cell surround. A, Responses of the same ON parasol ganglion cell shown in Figure 1 to an annulus with a 2000-μm-outer diameter and 0-μm-inner diameter (stimulus trace below) square wave stimulus modulated at 2 Hz in the absence (left) and presence (right) of 20 mm HEPES. The response in the presence of HEPES is larger, indicating diminished surround antagonism. B, Responses of a parasol ganglion cell to an annulus with a 2000 μm outer diameter and 450 μm inner diameter (stimulus trace below) square wave modulated at 2 Hz in the absence (left) and presence (right) of 20 mm HEPES. The response in the presence of HEPES is diminished, indicating decreased surround strength. C, Response amplitude as a function of annulus inner diameter (outer diameter is fixed at 2000 μm) in the absence (open circles) and presence (filled circles) of 20 mm HEPES. Stimuli were sinusoidally modulated at 2 Hz. Solid lines are difference of Gaussian receptive field model fits to the data; insets are two-dimensional profiles of the model fits. Responses at small annulus inner diameters are larger and responses at larger annulus inner diameters are smaller in the presence of HEPES, and the ratio of center to surround (cntr/surr) response strength increases. The inset on the right shows the mean response normalized to the maximum amplitude for 10 cells in the absence (solid line) and presence (dotted line) of 20 mm HEPES. In the presence of HEPES, the surround response is reduce by 72%. CTR, Control. D, Response amplitude as a function of spatial frequency in the absence (open circles) and presence (filled circles) of 20 mm HEPES. Stimuli were sinusoidal gratings drifting at 2 Hz. Solid lines are difference of Gaussian receptive field model fits to the data; insets are two-dimensional profiles of the model fits. Responses at small spatial frequencies are larger and responses at larger spatial frequencies are smaller in the presence of HEPES, and the ratio of center to surround response strength increases. The inset on the right shows the mean response normalized to the maximum amplitude for seven cells in the absence (solid line) and presence (dotted line) of 20 mm HEPES. In the presence of HEPES, the surround response is reduced by 75%.
Horizontal cells
At the onset of a light step, horizontal cells hyperpolarize rapidly, followed by a slow depolarization to a new steady-state membrane potential. At the offset of a light step, they respond oppositely with a rapid depolarization that overshoots the dark resting membrane potential, followed by a slow hyperpolarization back to the dark potential (Fig. 3 A). The overshoot and slow hyperpolarization at light offset are not well understood, but the slow depolarization at light onset is commonly attributed to horizontal cell feedback to cones. This is based on the slow depolarization being stronger in response to large- than small-diameter stimuli, temporally correlated with measures of horizontal cell feedback in cones themselves (Baylor et al., 1971; Stone and Witkovsky, 1987) and blocked by pharmacological agents that also block feedback to cones and surround responses in cones (Kamermans et al., 2001; Verweij et al., 2003; Packer and Dacey, 2005).
Figure 3.

Horizontal cell light response. A, Response of a horizontal cell to a 2000 μm spot square wave stimulus modulated at 2 Hz (stimulus trace below). B, Ratio of depolarization amplitude to hyperpolarization amplitude as a function of spot diameter (from 72 to 2000 μm) for a single cell. The slow depolarization increases relative to the hyperpolarization as spot diameter increases. C, Ratio of depolarization to hyperpolarization amplitude (as shown in A) as a function of hyperpolarization amplitude in response to 2000 μm spots (n = 25). The ratio of depolarization to hyperpolarization (Depol./Hyperpol.) is constant across all response amplitudes.
The amplitude of the slow depolarization, relative to the peak of the hyperpolarizing light response, increased with stimulus size (Fig. 3 B) and was 1.5 ± 0.02 (mean ± SD; n = 2) times greater for a response evoked by a 2000 μm spot than for one evoked by a 144 μm spot. Although the amplitudes of the initial light evoked hyperpolarization and the following slow depolarization varied from cell to cell, the ratio of depolarization to hyperpolarization was constant for a given spot size and thus was used to quantify the strength of feedback. Thus, in all subsequent experiments, a constant spot diameter of 2000 μm was used, giving a depolarization/hyperpolarization ratio of 0.27 ± 0.01 (mean ± SD; n = 25) (Fig. 3 C).
We examined the effect of the pH buffer HEPES on the horizontal cell light response (Fig. 4 A–C). At concentrations below 5 mm, HEPES had no significant effect on the hyperpolarization or depolarization amplitudes (depolarization/hyperpolarization, 0.25 ± 0.01 in control; 0.26 ± 0.03 in 1 mm HEPES; n = 4). At higher concentrations (5 and 10 mm), HEPES significantly increased the hyperpolarization amplitude and decreased the depolarization amplitude. HEPES at 20 mm did not further increase hyperpolarization amplitude but eliminated the slow depolarization (depolarization/hyperpolarization, 0.01 ± 0.01 in 20 mm HEPES; n = 5) (Fig. 4 B,C). The effects of HEPES were reversible with continued perfusion with control solution (Fig. 4 A). HEPES did not significantly change the resting membrane potential of horizontal cells (control, −39.0 ± 3.3 mV; 20 mm HEPES, −45.6 ± 8.0 mV; p = 0.30; n = 5). The slow depolarization was not affected by using sucrose to produce an equivalent osmolality increase to 20 mm HEPES (depolarization/hyperpolarization, 0.29 ± 0.01 in control; 0.29 ± 0.01 in sucrose; p = 0.58; n = 3).
Figure 4.

HEPES dose response. A, Responses of a horizontal cell to a 2000 μm spot square wave stimulus modulated at 2 Hz (stimulus trace below) for increasing concentrations of HEPES, showing increased hyperpolarizing response amplitude and decreased slow depolarization amplitude. B, Hyperpolarization amplitude as a function of [HEPES]. HEPES increases the hyperpolarization amplitude in a dose-dependent manner (n = 3, 4, or 5) (see Results). C, Ratio of depolarization to hyperpolarization (Depol./Hyperpol.) as a function of [HEPES]. HEPES decreases the depolarization amplitude in a dose dependent manner (n = 3, 4, or 5) (see Results). CTR, Control.
To further quantify the effect of HEPES on the horizontal cell light response, we measured the slope of the voltage response in the absence and presence of HEPES. The negative slope corresponding to the onset of the hyperpolarizing response reaches a maximum and then becomes less negative as the hyperpolarization becomes less steep and returns to zero at the peak of the light response. The slope is positive during the depolarizing recovery of the horizontal light response and returns to zero when the voltage has reached its steady-state potential (Fig. 5 A). We quantified the slope by taking the time at which it crosses 50% of its peak negative value on its downward and upward phase (Fig. 5 B). The downward phase is not significantly affected by HEPES (20 mm HEPES shifts the 50% crossing time 1.9 ± 3 ms relative to control; p = 0.58; n = 5), indicating the initial light response, presumably before the effect of feedback, is unaffected by HEPES. The upward 50% crossing is affected by HEPES in a dose-dependent manner (Fig. 5 C), with 20 mm HEPES shifting this point by 15 ± 3 ms relative to control (p = 0.009; n = 5). This suggests that HEPES only has an effect on the later portions of the horizontal cell light response that are influenced by negative feedback.
Figure 5.
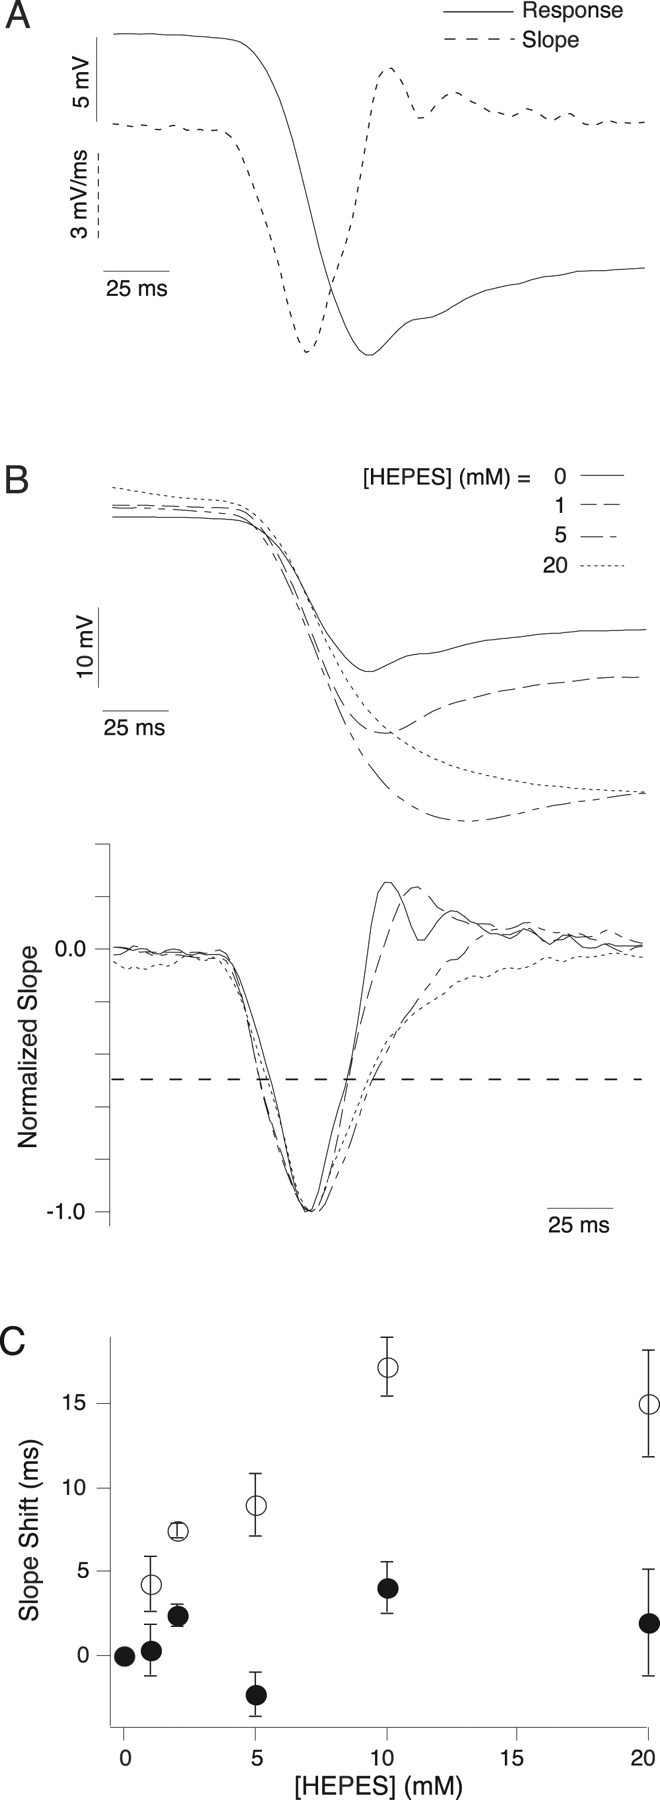
HEPES effect on the slope of the H1 response. A, Response of the same horizontal cell shown in Figure 4 to the onset of a 2000 μm spot modulated at 2 Hz. The solid line is the voltage response, and the dotted line is the slope of the response. B, Responses (above) and slope (below) of a horizontal cell to the onset of a 2000 μm spot at 0 (solid), 1 (dashed), 5 (dash and dot), and 20 (dotted) mm HEPES. C, Time of 50% slope crossing relative to control on the downward (filled circles) and upward (open circles) directions (see dotted line in B) as a function of [HEPES] (n = 3, 4, or 5) (see Results). HEPES shifts the upward crossing but not the downward crossing.
To test whether the effects of pH buffering were unique to HEPES, experiments were done to examine the influence of several other pH buffers on the horizontal cell light response. These included “Good” buffers (Good et al., 1966) MOPS, PIPES, and MES, which have an aminosulfonate moiety in common with HEPES but have different pKa values, as well as the structurally different buffer Tris. As shown in Figure 6 A, both MOPS and Tris diminished the horizontal cell slow depolarization in a concentration-dependent manner. The effect of each exogenous buffer on the slow depolarization was correlated with their calculated buffering capacity (Fig. 6 B). Additionally, we compared the effect of all buffers at 5 mm as a function of their pKa. The buffers with the strongest effect at 5 mm were those with pKa values closer to the pH of our experiments (7.4), MOPS and HEPES. Buffers with pKa values farther away, most notably MES, had weaker effects (Fig. 6 C). These experiments suggest that the effect of exogenous buffers is attributable to their pH buffering capacity rather than nonspecific effects.
Figure 6.
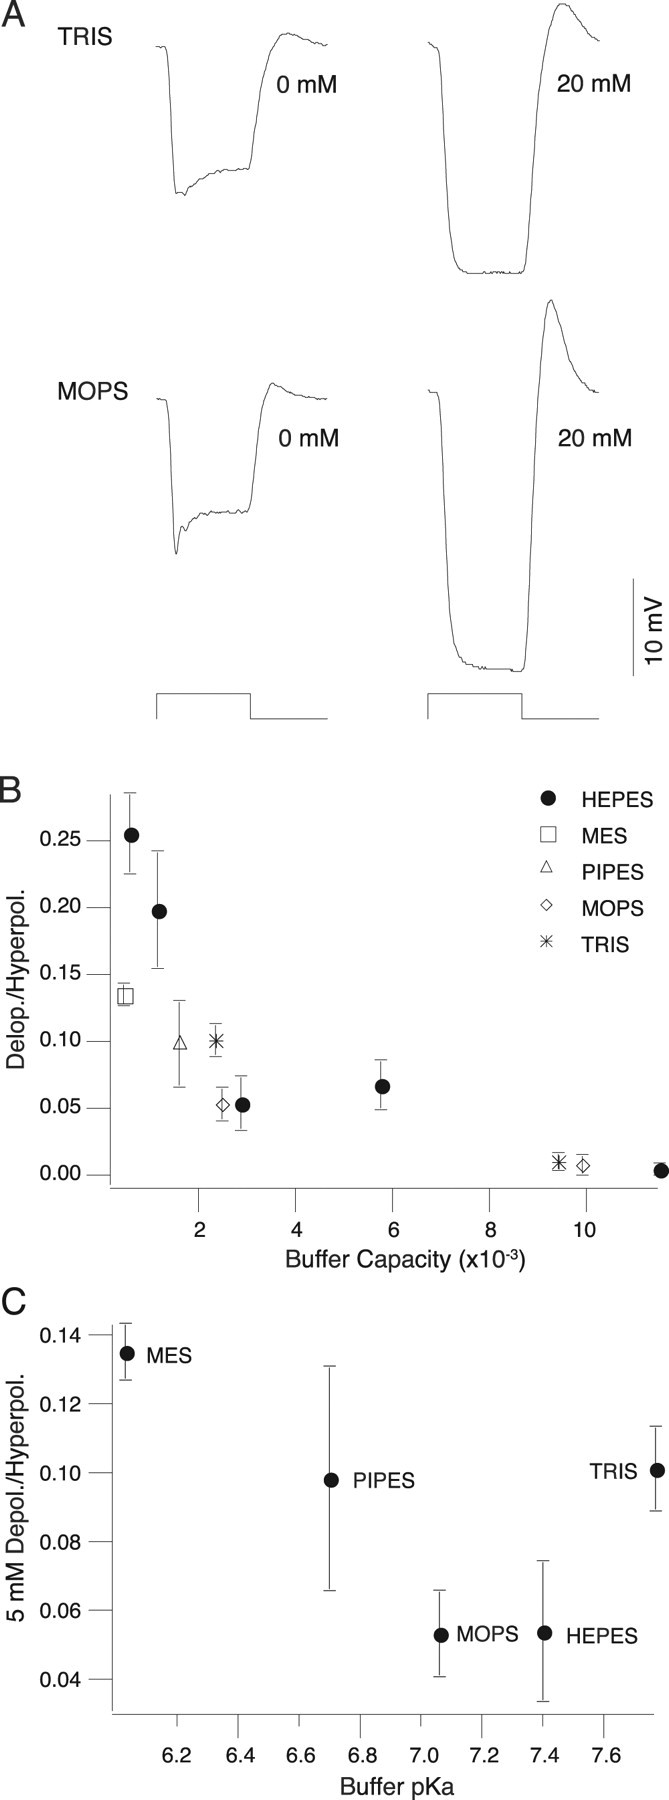
Other buffers attenuate the slow depolarization. A, Responses of horizontal cells to a 2000 μm spot square wave stimulus modulated at 2 Hz (stimulus trace below) at two concentrations of Tris (above) and MOPS (below). Both Tris and MOPS decrease the depolarization in a dose-dependent manner. B, Ratio of depolarization to hyperpolarization (Depol./Hyperpol.) as a function of buffer capacity for all buffers tested. The effect of all buffers on the depolarization is correlated with their buffering capacity (n = 3, 4, or 5) (see Results). C, Ratio of depolarization to hyperpolarization at 5 mm buffer as a function of buffer pKa. Buffers with pKa values closer to our experimental pH had a stronger effect on the depolarization (n = 3, 4, or 5) (see Results).
Pharmacological blockade of gap junctions has been shown to affect horizontal cell feedback and ganglion cell surrounds (Kamermans and Fahrenfort, 2004; McMahon et al., 2004). To test for any nonspecific effect of HEPES on gap junctions, we measured the spatial receptive fields of H1 horizontal cells. These cells are electrically coupled to each other and thus have receptive fields that are much larger than the dendritic field of a single H1 cell (Packer and Dacey, 2005). In response to sinusoidally modulated spots of increasing diameter, H1 cell responses increased and eventually plateaued at large spot sizes (Fig. 7 A). As an estimate of receptive field size, we measured the spot diameter at which the response reached 90% of its maximum (1144 ± 27 μm). In the presence of HEPES, the response plateaus at larger spot sizes than control, reaching 90% of its maximum at 1374 ± 91 μm, indicative of an increase in receptive field size (p = 0.037; n = 9). We also measured the response to sinusoidally modulated annuli with increasing inner diameters. The response decreases as the annulus inner diameter increases (Fig. 7 B). The point at which the annulus response function decreased to 10% of its maximum was 1043 ± 35 μm in control and 1321 ± 66 μm in the presence of HEPES (p = 0.001; n = 9). This provides additional evidence that HEPES increases H1 receptive field size, which indicates that it does not block gap junctional coupling between horizontal cells.
Figure 7.

H1 cell receptive field in the presence of HEPES. A, Horizontal cell response as a function of spot diameter in the absence (solid line) and presence (dashed line) of HEPES. Stimuli were spots sinusoidally modulated at 2 Hz. Response amplitude was measured as the strength of the Fourier component of the membrane voltage at the stimulus frequency, normalized to the maximum amplitude. HEPES causes responses to plateau at larger spot sizes, indicating larger receptive field size (n = 9). CTR, Control. B, Horizontal cell response as a function of annulus inner diameter (outer diameter was fixed at 2000 μm) in the absence (solid line) and presence (dashed line) of 20 mm HEPES. Stimuli and measurement parameters were the same as in A. Responses are stronger at larger annulus inner diameters in the presence of HEPES, indicating larger receptive field size (n = 9).
Discussion
Enrichment of the retinal buffering capacity with HEPES attenuates the surrounds of parasol ganglion cells and also blocks the horizontal cell slow depolarization in a dose-dependent manner. Other pH buffers attenuate the horizontal cell slow depolarization in correlation with their relative pH buffering capacities. HEPES slightly increases the receptive field size of H1 horizontal cells. These results suggest that HEPES and other pH buffers affect the horizontal cell light response via their pH buffering properties, that feedback requires pH changes in the outer retina, and that horizontal cell feedback to cones contributes significantly to surround formation in ganglion cells. Consistent with this interpretation, it has also been shown that increasing buffer capacity with HEPES blocks surround induced currents in OFF bipolar cells in newt retinal slices (Hirasawa and Kaneko, 2003), and it has been found recently that a surround-mediated inward current in macaque S cones can be reversibly blocked by 10 mm HEPES (Packer et al., 2007) (D. M. Dacey, unpublished observations).
Parasol cell surrounds
In the presence of HEPES, parasol cells respond to surround stimulation with weak, transient depolarizations at light onset and offset. In the ON parasol cell illustrated in Figure 2 B, for example, the weak OFF response is consistent with a weakened surround, and the weak ON response likely results from the annulus inner edge stimulating the outer edge of the receptive field center, which is not fully antagonized by the weak surround.
Previous work in the primate retina has shown that carbenoxolone and cobalt, which interfere with horizontal cell feedback, attenuate parasol ganglion cell surrounds, whereas the sodium channel blocker tetrodotoxin, the GABA receptor antagonist picrotoxin, and the glycine receptor blocker strychnine, which all interfere with amacrine cell circuits in the inner retina, do not alter the basic center-surround structure parasol cell receptive fields (McMahon et al., 2004). That HEPES, which also appears to interfere with horizontal cell feedback, selectively attenuates the surrounds of parasol cells strengthens the connection between horizontal cell feedback in the outer retina and ganglion cell surrounds. Based on measurements of surround amplitude from difference of Gaussian receptive field fits, cobalt and carbenoxolone attenuated parasol ganglion cell surrounds by ∼65%, which is approximately the same as the attenuation caused by 20 mm HEPES shown in the present results using the same measure of surround strength reduction. Surround attenuation is typically not complete with either HEPES buffering or cobalt application. Residual surround antagonism could be mediated by inner retinal amacrine circuitry (Taylor, 1999; Flores-Herr et al., 2001; Lukasiewicz, 2005) and/or incomplete block by these pharmacological manipulations.
H1 horizontal cells
HEPES increased the light response amplitude and receptive field size of horizontal cells, consistent with a previous study (Hare and Owen, 1998) in which the normal bicarbonate buffer was replaced with HEPES. It was hypothesized that, because HEPES cannot cross cell membranes, unlike bicarbonate, intracellular pH regulation was perturbed causing the observed changes in retinal physiology. In our experiments, the normal bicarbonate buffering system of the extracellular solution was augmented, not replaced, by HEPES. Bicarbonate is still present to cross cell membranes and participate in intracellular pH regulation, so the effects of HEPES must be caused by the increased extracellular buffering capacity it provides. The increased horizontal cell response amplitude is at least partly attributable to a lack of feedback that would normally attenuate the response. Consistent with this interpretation, our measurements show that the slope of the initial component of the response, presumably before the effect of feedback, is unaffected by HEPES. The slight increase in receptive field size could be attributable to better transmission of responses over the network of coupled horizontal cells as a result of the increased response amplitudes of all horizontal cells in the absence of feedback.
We used the slow depolarization of the horizontal cell light response as a measure of horizontal cell feedback to cones. The origin of the slow depolarization is not fully understood, but there is evidence that it is correlated with horizontal cell feedback to cones. It is much stronger in response to large spots than small spots (Baylor et al., 1971; Stone and Witkovsky, 1987), suggesting that it is mediated by lateral horizontal cell feedback over large retinal areas. In responses to large spots, cones have a depolarizing inflection in their light response that is not present in responses to small spots. This inflection is coincident with the horizontal cell slow depolarization, and the temporal relationship of the two is consistent with horizontal cell feedback (Baylor et al., 1971). Pharmacological agents that block feedback measured in cones also block the slow depolarization in horizontal cells (Kamermans et al., 2001; Verweij et al., 2003; Packer and Dacey, 2005). Models of outer retinal processing that include horizontal cell feedback reproduce the slow depolarization (Smith, 1995; van Hateren, 2005), although in one model, temporal filtering of the H1 cell light response could account for H1 cell dynamics without recourse to a negative feedback pathway (Smith et al., 2001). In the primate retina to date, surround pharmacology is consistent in that agents that block surrounds of ganglion cells also block the horizontal cell slow depolarization and the surrounds of cones (Verweij et al., 2003; McMahon et al., 2004; Packer and Dacey, 2005). The close correspondence with similar results in nonmammalian retina, including evidence that HEPES affects horizontal cell modulation of cone calcium channels (Hirasawa and Kaneko, 2003; Vessey et al., 2005; Cadetti and Thoreson, 2006), suggests that horizontal cell feedback modulation of proton concentration at the cone synapse is a fundamental signaling mechanism in the establishment of the retinal receptive field.
Although our results provide strong support for the proton hypothesis of surround inhibition (see Introduction), they do not prove it. The main difficulty is in not knowing how the proton concentration in the cone synaptic cleft is affected by light. A recent study (Kreitzer et al., 2007) using self-referencing H+-selective microelectrodes to measure extracellular proton fluxes in cultured fish horizontal cells reports that the increase in intracellular Ca2+ resulting from glutamate-evoked horizontal cell depolarization stimulates proton uptake by activating an ATP-driven plasma membrane Ca2+ pump that exports Ca2+ and imports H+. This would suggest that the cleft may be alkalized in dark and acidified in light. The proton hypothesis, however, is based on light having the opposite effect, i.e., causing cleft alkalization. The suggested mechanism responsible for the postulated increase in cleft pH is an amiloride-sensitive proton-permeable ion channel (Vessey et al., 2005), such as epithelial sodium channels (ENaCs), which are more permeable to protons than sodium ions (Hille, 2001). In this scenario, the light-evoked hyperpolarization of the horizontal cell increases ENaC-mediated inward H+ ion current and removes protons from the cleft. Amiloride and divalent cations block ENaCs as well as the depolarizing component of the horizontal cell light response (Sheng et al., 2002; Vessey et al., 2005). This suggests that the elimination of the H1 cell slow depolarization and the attenuation of ganglion cell surrounds by cobalt in the primate retina (McMahon et al., 2004; Packer and Dacey, 2005) are attributable to it blocking ENaC proton conductance. The discrepant predictions of the affect of light on cleft pH emphasizes the importance of developing methods for directly measuring synaptically related pH changes at high temporal and spatial resolution within this morphologically complex synapse (Haverkamp et al., 2000; Traynelis and Chesler, 2001).
The main alternative to the pH hypothesis of horizontal cell feedback is the ephaptic hypothesis, whereby connexin hemichannels at horizontal cell dendritic tips allow current from horizontal cell dendrites to change the extracellular voltage in the synapse and modulate cone calcium channels (Kamermans et al., 2001; Kamermans and Fahrenfort, 2004). Several Good buffers, including HEPES and MES, have been shown to inhibit connexin channel activity directly, specifically channels containing connexin-26 (Bevans and Harris, 1999), which is thought to be the type constituting hemichannels in fish retina (Janssen-Bienhold et al., 2001). We believe that these buffers are not acting by blocking hemichannels in our experiments for several reasons: Tris, which does not inhibit connexin channel activity, has a similar effect on the horizontal cell slow depolarization as HEPES, consistent with results from goldfish (Hirasawa and Kaneko, 2003). The action of all the buffers tested was correlated with their buffering capacity rather than their absolute concentration (Fig. 7). Finally, the gap junction-dependent receptive field of H1 horizontal cells was increased in size by HEPES, not decreased as would be expected if HEPES nonspecifically blocked gap junctions.
Footnotes
This work was supported by the Paul Kayser International Award in Retinal Research from the Retina Research Foundation (D.M.D.), Human Frontiers Science Program Grant RGP 00067/2004-C (P.B.D.), and National Institutes of Health Grants EY02048 (P.B.D.), EY06678 (D.M.D.), EY01730 (Vision Research Center), RR00166 (Tissue Distribution Program of the Washington National Primate Research Center), and GM07108 (C.M.D.). We thank Fred Rieke for constructive discussions and comments on this manuscript, as well as Orin Packer, Julian Vrieslander, Toni Haun, and Beth Peterson for programming and technical assistance.
References
- Barnes S. Center-surround antagonism mediated by proton Signaling at the cone photoreceptor synapse. J Gen Physiol. 2003;122:653–656. doi: 10.1085/jgp.200308947. [DOI] [PMC free article] [PubMed] [Google Scholar]
- Barnes S, Bui Q. Modulation of calcium-activated chloride current via pH-induced changes of calcium channel properties in cone photoreceptors. J Neurosci. 1991;11:4015–4023. doi: 10.1523/JNEUROSCI.11-12-04015.1991. [DOI] [PMC free article] [PubMed] [Google Scholar]
- Barnes S, Merchant V, Mahmud F. Modulation of transmission gain by protons at the photoreceptor output synapse. Proc Natl Acad Sci USA. 1993;90:10081–10085. doi: 10.1073/pnas.90.21.10081. [DOI] [PMC free article] [PubMed] [Google Scholar]
- Baylor DA, Fuortes MG, O'Bryan PM. Receptive fields of cones in the retina of the turtle. J Physiol (Lond) 1971;214:265–294. doi: 10.1113/jphysiol.1971.sp009432. [DOI] [PMC free article] [PubMed] [Google Scholar]
- Baylor D, Nunn BJ, Schnapf JL. Spectral sensitivity of cones of the monkey Macaca fascicularis . J Physiol (Lond) 1987;390:145–160. doi: 10.1113/jphysiol.1987.sp016691. [DOI] [PMC free article] [PubMed] [Google Scholar]
- Bevans CG, Harris AL. Regulation of connexin channels by pH. Direct action of the protonated form of taurine and other aminosulfonates. J Biol Chem. 1999;274:3711–3719. doi: 10.1074/jbc.274.6.3711. [DOI] [PubMed] [Google Scholar]
- Burkhardt DA. Synaptic feedback, depolarization, and color opponency in cone photoreceptors. Vis Neurosci. 1993;10:981–989. doi: 10.1017/s0952523800010087. [DOI] [PubMed] [Google Scholar]
- Byzov AL, Shura-Bura TM. Electrical feedback mechanism in the processing of signals in the outer plexiform layer of the retina. Vision Res. 1986;26:33–44. doi: 10.1016/0042-6989(86)90069-6. [DOI] [PubMed] [Google Scholar]
- Cadetti L, Thoreson WB. Feedback effects of horizontal cell membrane potential on cone calcium currents studied with simultaneous recordings. J Neurophysiol. 2006;95:1992–1995. doi: 10.1152/jn.01042.2005. [DOI] [PMC free article] [PubMed] [Google Scholar]
- Chesler M. Principles and practical aspects of pH buffering. In: Kaila K, Ranson BR, editors. pH and brain function. New York: Wiley; 1998. pp. 11–20. [Google Scholar]
- Dacey DM, Brace S. A coupled network for parasol but not midget ganglion cells in the primate retina. Vis Neurosci. 1992;9:279–290. doi: 10.1017/s0952523800010695. [DOI] [PubMed] [Google Scholar]
- Dacey DM, Lee BB, Stafford DK, Pokorny J, Smith VC. Horizontal cells of the primate retina: cone specificity without spectral opponency. Science. 1996;271:656–659. doi: 10.1126/science.271.5249.656. [DOI] [PubMed] [Google Scholar]
- Dacey DM, Packer OS, Diller L, Brainard D, Peterson B, Lee B. Center surround receptive field structure of cone bipolar cells in primate retina. Vision Res. 2000a;40:1801–1811. doi: 10.1016/s0042-6989(00)00039-0. [DOI] [PubMed] [Google Scholar]
- Dacey DM, Diller LC, Verweij J, Williams DR. Physiology of L- and M-cone inputs to H1 horizontal cells in the primate retina. J Opt Soc Am A Opt Image Sci Vis. 2000b;17:589–596. doi: 10.1364/josaa.17.000589. [DOI] [PubMed] [Google Scholar]
- DeVries SH. Exocytosed protons feedback to suppress the Ca2+ current in mammalian cone photoreceptors. Neuron. 2001;32:1107–1117. doi: 10.1016/s0896-6273(01)00535-9. [DOI] [PubMed] [Google Scholar]
- Enroth-Cugell C, Robson JG, Schweitzer-Tong DE, Watson AB. Saptio-temporal interactions in cat retinal ganglion cells showing linear spatial summation. J Physiol (Lond) 1983;341:279–307. doi: 10.1113/jphysiol.1983.sp014806. [DOI] [PMC free article] [PubMed] [Google Scholar]
- Flores-Herr N, Protti DA, Wassle H. Synaptic currents generating the inhibitory surround of ganglion cells in the mammalian retina. J Neurosci. 2001;21:4852–4863. doi: 10.1523/JNEUROSCI.21-13-04852.2001. [DOI] [PMC free article] [PubMed] [Google Scholar]
- Good NE, Winget GD, Winter W, Connolly TN, Izawa S, Singh RM. Hydrogen ion buffers for biological research. Biochemistry. 1966;5:467–477. doi: 10.1021/bi00866a011. [DOI] [PubMed] [Google Scholar]
- Hare WA, Owen WG. Effects of bicarbonate versus HEPES buffering on measured properties of neurons in the salamander retina. Vis Neurosci. 1998;15:263–271. doi: 10.1017/s0952523898152069. [DOI] [PubMed] [Google Scholar]
- Haverkamp S, Grunert U, Wassle H. The cone pedicle, a complex synapse in the retina. Neuron. 2000;27:85–95. doi: 10.1016/s0896-6273(00)00011-8. [DOI] [PubMed] [Google Scholar]
- Hille B. Ionic channels of excitable membranes. Ed 3. Sunderland, MA: Sinauer; 2001. [Google Scholar]
- Hirasawa H, Kaneko A. pH changes in the invaginating synaptic cleft mediate feedback from horizontal cells to cone photoreceptors by modulating Ca2+ channels. J Gen Physiol. 2003;122:657–671. doi: 10.1085/jgp.200308863. [DOI] [PMC free article] [PubMed] [Google Scholar]
- Janssen-Bienhold U, Schultz K, Gellhaus A, Schmidt P, Ammermuller J, Weiler R. Identification and localization of connexin26 within the photoreceptor-horizontal cell synaptic complex. Vis Neurosci. 2001;18:169–178. doi: 10.1017/s0952523801182015. [DOI] [PubMed] [Google Scholar]
- Kamermans M, Fahrenfort I. Ephaptic interactions within a chemical synapse: hemichannel-mediated ephaptic inhibition in the retina. Curr Opin Neurobiol. 2004;14:531–541. doi: 10.1016/j.conb.2004.08.016. [DOI] [PubMed] [Google Scholar]
- Kamermans M, Spekreijse H. The feedback pathway from horizontal cells to cones: a mini review with a look ahead. Vision Res. 1999;39:2449. doi: 10.1016/s0042-6989(99)00043-7. [DOI] [PubMed] [Google Scholar]
- Kamermans M, Fahrenfort I, Schultz K, Janssen-Bienhold U, Sjoerdsma T, Weiler R. Hemichannel-mediated inhibition in the outer retina. Science. 2001;292:1178–1180. doi: 10.1126/science.1060101. [DOI] [PubMed] [Google Scholar]
- Kraaij DA, Spekreijse H, Kamermans M. The nature of surround-induced depolarizing responses in goldfish cones. J Gen Physiol. 1999;115:3–16. doi: 10.1085/jgp.115.1.3. [DOI] [PMC free article] [PubMed] [Google Scholar]
- Kreitzer MA, Collis LP, Molina AJ, Smith PJ, Malchow RP. Modulation of extracellular proton fluxes from retinal horizontal cells of the catfish by depolarization and glutamate. J Gen Physiol. 2007;130:169–182. doi: 10.1085/jgp.200709737. [DOI] [PMC free article] [PubMed] [Google Scholar]
- Kuffler SW. Discharge patterns and functional organization of mammalian retina. J Neurophysiol. 1953;16:37–68. doi: 10.1152/jn.1953.16.1.37. [DOI] [PubMed] [Google Scholar]
- Lukasiewicz PD. Synaptic mechanisms that shape visual signaling at the inner retina. Prog Brain Res. 2005;147:205–218. doi: 10.1016/S0079-6123(04)47016-2. [DOI] [PubMed] [Google Scholar]
- McMahon MJ, Packer OS, Dacey DM. The classical receptive field surround of primate parasol ganglion cells is mediated primarily by a non-GABAergic pathway. J Neurosci. 2004;24:3736–3745. doi: 10.1523/JNEUROSCI.5252-03.2004. [DOI] [PMC free article] [PubMed] [Google Scholar]
- Packer OS, Dacey DM. Synergistic center-surround receptive field model of monkey H1 horizontal cells. J Vis. 2005;5:1038–1054. doi: 10.1167/5.11.9. [DOI] [PubMed] [Google Scholar]
- Packer O, Diller LC, Verweij J, Lee BB, Pokorny J, Williams DR, Dacey DM, Brainard DH. Characterization and use of a digital light projector for vision research. Vision Res. 2001;41:427. doi: 10.1016/s0042-6989(00)00271-6. [DOI] [PubMed] [Google Scholar]
- Packer OS, Verweij J, Schnapf J, Dacey DM. Primate S cones have blue-yellow opponent receptive fields [abstract] Invest Ophthalmol Vis Sci. 2007;48:2849. [Google Scholar]
- Piccolino M. The feedback synapse from horizontal cells to cone photoreceptors in the vertebrate retina. Prog Ret Eye Res. 1995;14:141. [Google Scholar]
- Schwartz EA. Transport-mediated synapses in the retina. Physiol Rev. 2002;82:875–891. doi: 10.1152/physrev.00010.2002. [DOI] [PubMed] [Google Scholar]
- Sheng S, Perry CJ, Kleyman TR. External nickel inhibits epithelial sodium channel by binding to histidine residues within the extracellular domains of alpha and gamma subunits and reducing channel open probability. J Biol Chem. 2002;277:50098–50111. doi: 10.1074/jbc.M209975200. [DOI] [PubMed] [Google Scholar]
- Smith RG. Simulation of an anatomically defined local circuit: the cone-horizontal cell network in cat retina. Vis Neurosci. 1995;12:545–561. doi: 10.1017/s0952523800008440. [DOI] [PubMed] [Google Scholar]
- Smith VC, Pokorny J, Lee BB, Dacey DM. Primate horizontal cell dynamics: an analysis of sensitivity regulation in the outer retina. J Neurophysiol. 2001;85:545–558. doi: 10.1152/jn.2001.85.2.545. [DOI] [PubMed] [Google Scholar]
- Stone S, Witkovsky P. Center-surround organization of Xenopus horizontal cells and its modification by gamma-aminobutyric acid and strontium. Exp Biol. 1987;47:1–12. [PubMed] [Google Scholar]
- Taylor WR. TTX attenuates surround inhibition in rabbit retinal ganglion cells. Vis Neurosci. 1999;16:285–290. doi: 10.1017/s0952523899162096. [DOI] [PubMed] [Google Scholar]
- Thoreson WB, Burkhardt DA. Effects of synaptic blocking agents on the depolarizing responses of turtle cones evoked by surround illumination. Vis Neurosci. 1990;5:571–583. doi: 10.1017/s0952523800000730. [DOI] [PubMed] [Google Scholar]
- Traynelis SF, Chesler M. Proton release as a modulator of presynaptic function. Neuron. 2001;32:960–962. doi: 10.1016/s0896-6273(01)00549-9. [DOI] [PubMed] [Google Scholar]
- van Hateren H. A cellular and molecular model of response kinetics and adaptation in primate cones and horizontal cells. J Vis. 2005;5:331–347. doi: 10.1167/5.4.5. [DOI] [PubMed] [Google Scholar]
- Verweij J, Kamermans M, Spekreijse H. Horizontal cells feed back to cones by shifting the cone calcium-current activation range. Vision Res. 1996;36:3943. doi: 10.1016/s0042-6989(96)00142-3. [DOI] [PubMed] [Google Scholar]
- Verweij J, Hornstein EP, Schnapf JL. Surround antagonism in macaque cone photoreceptors. J Neurosci. 2003;23:10249–10257. doi: 10.1523/JNEUROSCI.23-32-10249.2003. [DOI] [PMC free article] [PubMed] [Google Scholar]
- Vessey JP, Lalonde MR, Mizan HA, Welch NC, Kelly MEM, Barnes S. Carbenoxolone inhibition of voltage-gated Ca channels and synaptic transmission in the retina. J Neurophysiol. 2004;92:1252–1256. doi: 10.1152/jn.00148.2004. [DOI] [PubMed] [Google Scholar]
- Vessey JP, Stratis AK, Daniels BA, Da Silva N, Jonz MG, Lalonde MR, Baldridge WH, Barnes S. Proton-mediated feedback inhibition of presynaptic calcium channels at the cone photoreceptor synapse. J Neurosci. 2005;25:4108–4117. doi: 10.1523/JNEUROSCI.5253-04.2005. [DOI] [PMC free article] [PubMed] [Google Scholar]
- Watanabe M, Rodieck RW. Parasol and midget ganglion cells of the primate retina. J Comp Neurol. 1989;289:434–454. doi: 10.1002/cne.902890308. [DOI] [PubMed] [Google Scholar]
- Wu SM. Feedback connections and operation of the outer plexiform layer of the retina. Curr Opin in Neurobiol. 1992;2:462. doi: 10.1016/0959-4388(92)90181-j. [DOI] [PubMed] [Google Scholar]