Abstract
A novel imaging technology, high-speed microscopy, has been used to visualize the process of GLUT4 translocation in response to insulin in single 3T3-L1 adipocytes. A key advantage of this technology is that it requires extremely low light exposure times, allowing the quasi-continuous capture of information over 20–30 min without photobleaching or photodamage. The half-time for the accumulation of GLUT4-eGFP (enhanced green fluorescent protein) at the plasma membrane in a single cell was found to be of 5–7 min at 37°C. This half-time is substantially longer than that of exocytic vesicle fusion in neuroendocrine cells, suggesting that additional regulatory mechanisms are involved in the stimulation of GLUT4 translocation by insulin. Analysis of four-dimensional images (3-D over time) revealed that, in response to insulin, GLUT4-eGFP-enriched vesicles rapidly travel from the juxtanuclear region to the plasma membrane. In nontransfected adipocytes, impairment of microtubule and actin filament function inhibited insulin-stimulated glucose transport by 70 and 50%, respectively. When both filament systems were impaired insulin-stimulated glucose transport was completely inhibited. Taken together, the data suggest that the regulation of long-range motility of GLUT4-containing vesicles through the interaction with microtubule- and actin-based cytoskeletal networks plays an important role in the overall effect of insulin on GLUT4 translocation.
INTRODUCTION
The regulation of the subcellular distribution of the GLUT4 glucose transporter is one of the primary mechanisms by which insulin regulates glucose homeostasis in humans. In response to insulin a fraction of GLUT4, localized to intracellular membranes, redistributes to the plasma membrane, thus increasing the cell surface concentration of GLUT4, and thereby increasing glucose transport. Numerous studies have pointed to abnormalities in the regulation of the GLUT4 glucose transporter as the primary cause of insulin resistance in humans and in experimental models of diabetes (Garvey et al., 1993; Charron and Katz, 1998; Garvey et al., 1998). Given the importance of this membrane-trafficking process in human disease, elucidating its mechanisms at the cellular and molecular level is of great importance.
Several models have been proposed to explain the trafficking process that results in increased concentration of GLUT4 at the plasma membrane. One of these models postulates the existence of a population of vesicles enriched in GLUT4, which are positioned immediately below the plasma membrane, and are stimulated to fuse with the plasma membrane in response to insulin (Macaulay et al., 1997; Min et al., 1999; Pessin et al., 1999; Hashiramoto and James, 2000). An alternative model postulates that GLUT4 is not necessarily localized to a specific set of vesicles, but rather it internalizes and recycles constantly, using the same endocytic pathway used by molecules such as the transferrin receptor, but is retained longer in intracellular membranes by a mechanism that may involve a specific retention mechanism. In this model insulin decreases the retention of GLUT4, resulting in an increased initial exocytic rate followed by the establishment of a new steady state in which more of the GLUT4 transporter is at the plasma membrane (Subtil et al., 2000).
These alternative mechanisms would be predicted to differ in the speed at which the increased plasma membrane concentration of GLUT4 is established. Examples of exocytic events that involve the fusion of vesicles close to the plasma membrane indicate that these fusion events occur very rapidly. For example, studies on exocytosis from chromaffin cells have distinguished two kinetic components of exocytosis. One, the exocytic burst, is believed to result from fusion of a readily releasable pool of vesicles. This phase is completed within 1 s after application of the stimulus. A second slow component can be measured within 10 s to 1 min after stimulation (Xu et al., 1999a,b). Recent experiments that monitor the fate of a specific exocytic vesicle component, the V-snare VAMP2, demonstrate that insertion of these vesicles with the plasma membrane is completed within 100 s after stimulation (Sankaranarayanan and Ryan, 2000). The speed of stimulated exocytic event is also evident in systems other that neurosecretion. For example, the targeted fusion of endosomes with the plasma membrane during phagocytosis occurs well within 10 min after stimulation (Bajno et al., 2000).
VAMP2 has been directly implicated in the exocytic fusion of GLUT4 (Cheatham et al., 1996; Macaulay et al., 1997; Olson et al., 1997; Thurmond et al., 1998; Min et al., 1999; Pessin et al., 1999). Based on the recent kinetic data on the rate of insertion of VAMP2 (Sankaranarayanan and Ryan, 2000) it would be predicted that the stimulation of glucose uptake by insulin would occur rapidly (within 100 s) after insulin stimulation. However, measurements of the rate of glucose transport reveal that the effect of insulin is much slower, with a half-maximal response of 5–7 min at 37°C (Fingar et al., 1993; Robinson et al., 1993; van den Berghe et al., 1994; Garza and Birnbaum, 2000). This delay could be explained by a number of factors, including the possibility that individual cells might differ significantly in their response time to the insulin stimulus. This argument is supported by reports that indicate that only 50–60% of cells in a population can be seen to contain a significant amount of GLUT4 at the plasma membrane after 15 min of insulin treatment, as assessed by the so-called “plasma-membrane rim” technique (Waters et al., 1997). For this and other potential reasons, the time course of exocytosis of GLUT4 in a single cell cannot be inferred from the time course of glucose uptake measured in cell populations.
To directly address this question, we have measured the kinetics of GLUT4 translocation at the single-cell level by using a novel imaging technology, high-speed microscopy (Young et al., 1999). This technology, originally developed for the visualization of Ca2+ signals in isolated muscle cells, enables the visualization of a fluorophore within the whole three-dimensional volume of the cell at intervals as short as 3 s by using extremely low light exposure times (Carrington et al., 1995; Rizzuto et al., 1998a,b). Using this technology, we have acquired four-dimensional images (3-D images over time) of GLUT4-eGFP (enhanced green fluorescent protein) expressed in 3T3-L1 adipocytes, under basal conditions and in response to insulin. The results obtained demonstrate that the time course for the translocation of GLUT4 to the plasma membrane in a single cell, in response to insulin stimulation, occurs with a half-time of 5–7 min at 37°C. In addition, these images suggest that additional mechanisms of vesicular transport, which involve cytoskeletal-mediated motility over long distances, are critical for insulin action on GLUT4 translocation.
MATERIALS AND METHODS
GLUT4-eGFP Construction
The previously characterized pcDNA3 GLUT4-eGFP construct (Thurmond et al., 1998; Elmendorf et al., 1999) was kindly provided by Dr. Jeff Pessin (University of Iowa).The construct was prepared by subcloning the full-length rat GLUT4 cDNA in frame into the HindIII and BamHI sites of the pEGFP vector (CLONTECH, Palo Alto, CA) to generate a carboxyl-terminal green fluorescent protein fusion. This fusion protein was subsequently subcloned into the HindIII and XbaI sites of the pcDNA3 vector (Invitrogen, Carlsbad, CA).
Preparation of Cells
3T3-L1 fibroblasts (American Type Culture Collection, Manassas, VA) were seeded and fed every 2 days in Dulbecco's modified Eagle's medium supplemented with 50 U/ml penicillin, 50 μg/ml streptomycin, and 10% fetal calf serum, and grown under 10% CO2. At confluence, differentiation was started by addition of culture medium containing 0.25 μM dexamethasone (Sigma, St. Louis, MO), 0.5 mM isobutyl-methylxanthine (Sigma), and 1 μM insulin. After 48 h, this mixture was replaced with fresh medium. On day 8 of differentiation, adipocytes were trypsynized, electroporated (0.16 kV and 960 microfarads) with 50 μg of the GLUT4-eGFP plasmid, and seeded on glass coverslips (Thurmond et al., 1998; Elmendorf et al., 1999). After 24 h, cells were placed in a buffer (KRH buffer) composed of NaCl (125 mM), KCl (5 mM), CaCl2 (1.3 mM), MgSO4 (1.2 mM), HEPES pH 7.4 (25 mM), sodium pyruvate (2 mM), and bovine serum albumin (0.2%). After 3 h, coverslips were fastened into a customized heated chamber that maintains the buffer at a constant temperature of 36.5°C while imaging (Young et al., 1999).
Live Cell Imaging with the Ultra-Fast Microscope
Three critical features define the Ultra-Fast Microscope (Young et al., 1999). First, a laser source that provides wide field epi-fluorescence illumination at spectral lines capable of exciting common fluorophores with only 2–3-ms exposure times. Second, a high-speed piezoelectric focus drive. Third, a unique small-format (128 × 128 pixels) charge-coupled device camera, developed as a collaboration between the Biomedical Research Group and MIT Lincoln Laboratories, which operates with a quantum efficiency of 70%. The frame-transfer multi-output-port architecture of this charge-coupled device results in a readout time (time to transfer the image photoelectrons from the camera to computer memory) of 1.8 ms, permitting a maximum image rate of 543 images/s.
In the experiments presented here, the laser illumination was configured to provide a flux on specimen of ∼36 W/cm2 when used with an 60× objective and 488-nm excitation wavelength. With this flux, a single eGFP molecule can be detected as an 80-nm pixel after a 15-ms exposure time. If one assumes that adipose cells contain at least 50,000 copies of GLUT4/cell, it becomes clear that we can detect the signal from GLUT4-eGFP expressed at levels equal or below those of endogenous GLUT4. The high-speed piezoelectric focus drive is capable of shifting focus at a rate of 1 μm/ms. However, the flexure of the coverslip as the oil layer is displaced during a change in focus requires time to be allowed for the coverslip to return to its original position. For these practical reasons the focus shift was adjusted to a rate of 20 ms for each 250 nm. Using 5-ms exposure times we have been able to acquire 21 plane 3D image sets (5-μm thickness) at a resolution of 330 nm/pixel in under 1 s.
Images were captured and analyzed with proprietary software developed for the camera by the Biomedical Imaging Group, which has been described in detail (Young et al., 1999; ZhuGe et al., 1999). A drawback of the wide-field microscope is that it captures substantial haze originating from light sources outside the in-focus plane of the cell. However, the out-of-focus blur can be substantially reduced by the process of image restoration, which increases the signal-to-noise ratio of the image (Carrington et al., 1995, Young et al., 1999; ZhuGe et al., 1999).
2-Deoxyglucose Uptake
Cells were seeded and differentiated in 12-well multiwell dishes. Cells were serum starved for 3 h in KRH buffer and then treated with nocodazole (10 μM), latruculin-A (Lat-A) (10 μM), and insulin (100 nM) for the times indicated. Uptake measurements were initiated by the addition of 2-[1,2-3H]deoxy-d-glucose (NEN, Boston, MA) to a final concentration of 0.1 mM (100 mCi/mmol). After 5 min, uptake was stopped by aspiration of the media and three rapid washes with 2 ml of cold media containing 20 μM cytochalasin-B (Sigma) and 100 μM phloretin (Sigma). The radioactivity associated with the cells was measured by scintillation counting. Noncarrier-mediated transport was assessed in parallel incubations containing 50 μM cytochalasin-B.
RESULTS
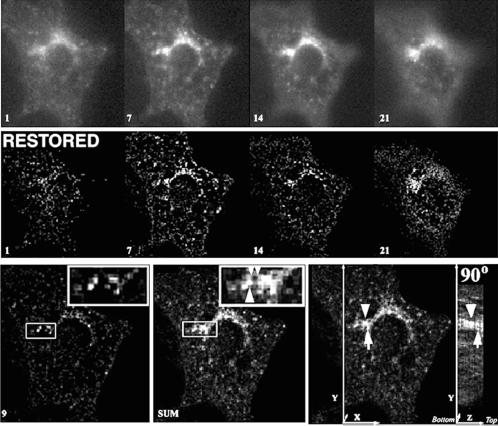
Figure 1 illustrates the enhancement of resolution achieved by image restoration of optical sections through a 3T3-L1 adipocyte expressing GLUT4-eGFP. Previous studies have shown that this GFP-GLUT4 chimera is synthesized, processed, and regulated in response to insulin in a way similar to the wild-type transporter (Elmendorf et al., 1999). The chimera was introduced by electroporation into differentiated 3T3-L1 adipocytes, which were imaged within 24 h after transfection. Twenty-one optical sections spaced by 250 nm were obtained by using 5-ms exposure time/section. Selected sections through the cell are shown before (Figure 1, top) or after (Figure 1, middle) restoration. The information contained within the three-dimensional volume can be analyzed by projecting all 21 sections into a single 2D image (Figure 1, compare left and middle bottom), or by rotating the 21-section stack (Figure 1, bottom right). This analysis indicates that GLUT4-containing structures are dispersed over the entire three-dimensional volume of the cell, and concentrate in the juxtanuclear region. In addition, prominent structures appear interconnected by finer tubular elements.
Figure 1.
Enhancement of resolution by image restoration. (Top) Four 250-nm optical sections of a 3T3-L1 adipocyte expressing GLUT4-eGFP. The number at the lower left corner of each image represents the image plane, the lower number being closest to the coverslip. (Middle) Same sections shown in the top, after restoration. (Bottom) Comparison of the information contained in a single 250-nm section from the middle of the cell (left) with the information contained in the 2D projection of 21 sections (middle). The large arrowhead in the expanded region indicates a prominent structure outside the single image plane. The small arrowheads point to thin tubules that appear to interconnect the more prominent vesicular structures. In the right-most panel the arrowhead and arrow illustrate structures localized at different Z-levels that can be appreciated by rotating the sum of the sections by 90°. Also see QuickTime Demo 1.
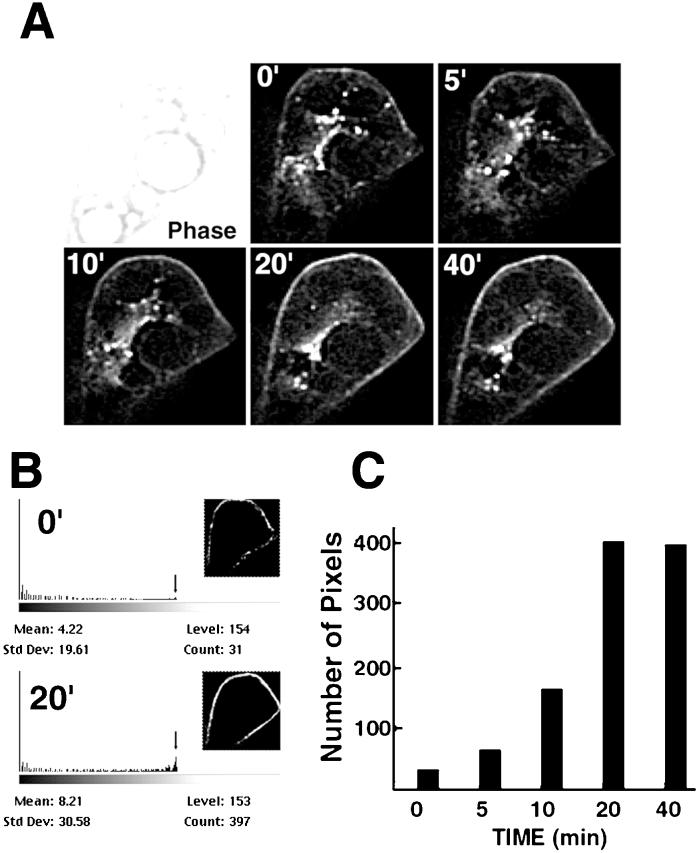
To determine the kinetics of insulin action at the single-cell level we obtained images of transfected 3T3-L1 adipocytes before and during insulin stimulation. Fully differentiated 3T3-L1 adipocytes, characterized by the presence of large fat globules (Figure 2, phase images) and expressing relatively low levels of GLUT4, were selected for imaging to prevent visualization of excessive GLUT4 spilled into nonrelevant compartments. Image stacks of 21 optical sections were obtained at the time points indicated in each panel and subjected to image restoration (Figure 2). A single optical section through the center of a cell before and during insulin stimulation is shown. The fluorescence intensity at the cell periphery was quantified by counting the number of pixels of a selected intensity found within 5 pixels of the boundary of the cell (Figure 2B). A plot of this parameter over time clearly demonstrates that the half-maximal intensity was reached after 5 min, and the maximal intensity was reached between 10 and 20 min of insulin stimulation.
Figure 2.
Time course of insulin action on GLUT4 accumulation at the plasma membrane. (A) Panels represent a single 250-nm section through the middle of the cell acquired at the times (Min et al., 1999) after insulin addition indicated in the top left corner. A phase image of the cell is shown in the first panel. (B) A rim of 5 pixels around the cell periphery was selected (insets), and the number of pixels of highest intensity (level 153) was calculated using the histogram function in Photoshop 5.0 The numbers at the top left corner represent minutes of insulin treatment. (C) Number of pixels was plotted as a function of time of insulin exposure (see also QuickTime Demo 1).
To ensure that the change in fluorescence intensity was in fact due to a redistribution of GLUT4 and not to an optical artifact due to changes in cell morphology, or to abnormal retention of the GLUT4-eGFP construct at the plasma membrane, we added wortmannin, which is known to rapidly reverse the effects of insulin on GLUT4 translocation. After 5 min of wortmannin treatment, the fluorescence at the cell boundary was greatly diminished (Figure 3). Thus, these results are consistent with previous observations that indicate that GLUT4-eGFP effectively reflects the behavior of endogenous GLUT4 in these cells (Elmendorf et al., 1999; Garza and Birnbaum, 2000).
Figure 3.
Reversal of insulin action by wortmannin. Single 250-nm section through the middle of the cell taken before (C) and after 20 min of insulin stimulation (I). Wortmannin (+W) was added after 20 min of insulin and the cell reimaged 5 min later.
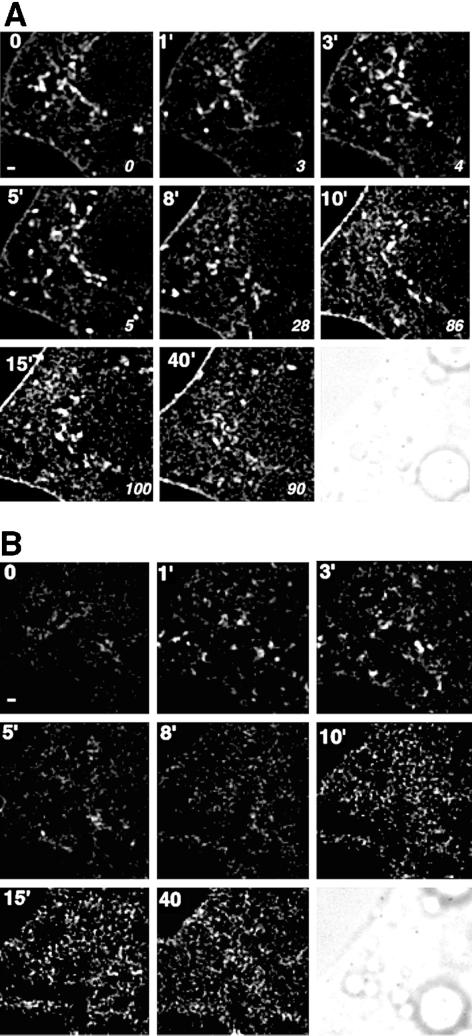
Because of the small format of the camera, imaging at higher resolution necessarily restricts imaging to a small portion of the cell. An example of this higher resolution imaging is seen in Figure 4. As shown in Figure 3, in focal planes taken through the middle of the cell, the limiting boundary progressively increased in fluorescence intensity in response to insulin, with a half-time of 5–8 min (Figure 4A). The analysis of focal planes taken through the bottom of the cell, which encompass the membrane attached to the coverslip, provides additional information (Figure 4B). In these images, concentrated foci of GLUT4-eGFP could be observed within the two-dimensional plane of the membrane. These foci gradually disappeared, and were replaced by a more homogeneous distribution of GLUT4 within the two-dimensional plane. The transition of GLUT4 into a more homogeneous distribution occurred with a half-time of 5–7 min. Because the focal planes are spaced by 250 nm, these images represent GLUT4-eGFP contained anywhere within a distance of 250 nm from the plasma-membrane bilayer, and could include vesicles approaching or bound to the bilayer, or plasma membrane ruffles. Thus, these images suggest that, within 0–5 min of insulin stimulation, membranes containing GLUT4 are mobilized to the plasma membrane from a source more than 250 nm distant from the bilayer. Subsequently, GLUT4 diffuses within the bilayer, possibly as a consequence of the fusion of these structures with the plasma membrane. The speckled appearance of GLUT4 is likely to be due to its presence in endocytic structures.
Figure 4.
Higher resolution imaging of GLUT4-eGFP. Images were acquired at settings that result in a resolution of 133 nm/pixel. The bar at the lower left corner of the first panel is 800 nm. (A) Panels represent a single 250-nm section through the middle of the cell acquired at the times (Min et al., 1999) after insulin addition indicated in the top left corner. Italicized numbers in the bottom right corner of each panel represent the percentage of maximal effect of insulin, which was calculated as described in Figure 3B. A phase image of the cell is shown in the first panel. (B) Panels represent a single 250-nm section through the bottom of the cell acquired at the times after insulin addition indicated in the top left corner.
Dynamics of GFP-GLUT
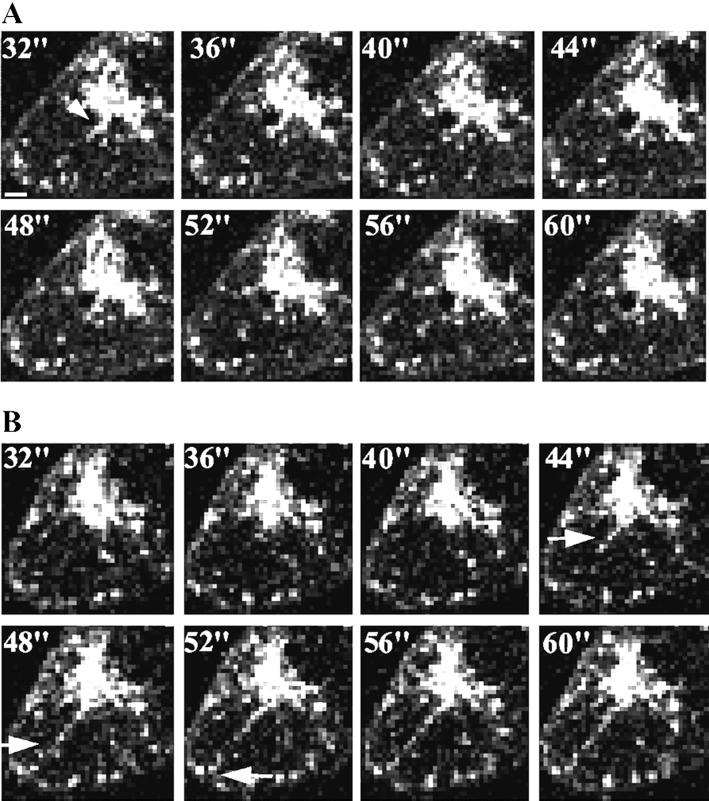
To obtain a more accurate analysis of the dynamics of GLUT4 motility in the whole cell, 21-section stacks acquired every 4 s were restored and projected into a single image plane. A striking finding in these images was the observation of tubular structures containing GLUT4-eGFP formed in response to insulin stimulation. Figure 5, A and B, depict eight successive projections, from a total of 300 collected, acquired at 333 nm/pixel before and during insulin stimulation. The full set of image stacks can be seen in QuickTime demo 2, in which the 300 projections are played. Of these, 100 image stacks (6.6 min) were collected before, and 200 image stacks (13.2 min) were collected after insulin addition.
Figure 5.
Dynamics of GLUT4-eGFP in response to insulin. (A) Panels represent the 2D projection of 21-image sections taken every 4 s, as indicated in the upper left corner. Arrows point to structures near the juxtanucelar region, which display rapid changes in shape. The bar at the lower left corner of the first panel represents 1.7 μm. (B) Panels shown were taken after 5 min of insulin addition, at 4-s intervals, as indicated in the top left corner. The arrow follows the trajectory of a stream of GLUT4-eGFP from the juxtanuclear region to the plasma membrane (see QuickTime Demo 2).
Figure 5A illustrates the basal dynamic behavior of GLUT4-eGFP. Numbers in the upper left corner of each panel represent seconds. The general distribution of GLUT4-GFP consists of tubulo-vesicular structures distributed throughout the cytoplasm, with an area of concentration adjacent to the nucleus (arrowhead). These elements are irregular in shape and extremely dynamic, changing shape and size continually. For example, the arrow points to a short tubular structure that extends from the perinuclear region toward the bottom left of the arrow. Twelve seconds later, this region appears to retract and condense into more enlarged vesicular structures.
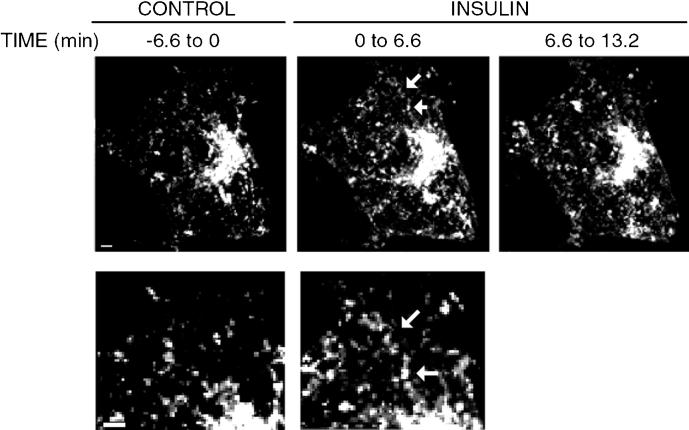
Figure 5B is composed of eight projections taken after exposure of the same cell to insulin for 5 min. Insulin elicited the movement of tubulo-vesicular structures directly from the juxtanuclear region to the plasma membrane. Examples of this movement are indicated by the arrow that follows the trajectory of a stream of these vesicles from 44- to 52-s time points. During this later period, the leading structures moved 4–6 μm, from which the movement of these vesicles is estimated to be approximately 0.5 μm/s. In three successive experiments, done with independent cell cultures and GLUT4-eGFP plasmid DNA preparations, individual vesicles were observed to move in the horizontal plane from the perinuclear region to the plasma membrane within 6 min of insulin addition The average tracking speed of these vesicles was of 0.245, 0.262, and 0.540 μm/s, but the variability ranged from a maximum speed of 0.707 to a minimum of 0.180. Although the apparent frequency of these events was only one to three over a period of 6 min of observation, it is very likely that this number is a vast underestimation of the actual frequency because vesicle streams are likely to extend in all directions and not be restricted to the horizontal plane. Because the 21 image planes only comprise a thickness of 5 μm, and 3T3-L1 adipocytes are typically 10–15 μm thick, vesicle streams moving off the horizontal plane toward the top or bottom of the cell become undetectable in our image sets. Nevertheless, the projection of 100 image sets obtained from insulin-treated cells (2100 images) onto a single two-dimensional image, which would reflect all movement occurring during 6 min of imaging within the 5-μm section, reveals the presence of numerous linear structures that are much less frequent in the noninsulin-treated cell (Figure 6). Furthermore, movement of vesicles from the juxtanuclear region to the plasma membrane was never seen in serum-starved cells before the addition of insulin, nor was it seen in other studies, where a GFP chimera of EEA1, a marker for the early endocytic pathway, was visualized. Taken together, this analysis supports the hypothesis that insulin elicits the movement of GLUT4 from the perinuclear region to the plasma membrane along specific tracks.
Figure 6.
Motility of GLUT4-eGFP revealed by 2D projection of 4D images. 100 stacks of 21 sections taken before (CONTROL), or after insulin addition (INSULIN, 0 to 6.6 and INSULIN 6.6 to 13.2) were summed and displayed as 2D images. Arrows point to a region were a linear track is defined by the presence of a contiguous GLUT4-eGFP signal. Bottom panels are an amplification of the same region from the cell from the before and after insulin sets. Bars on the lower left corner represent 3 um.
Dynamics of GLUT4-eGFP in Response to Microtubule and Microfilament Disruption
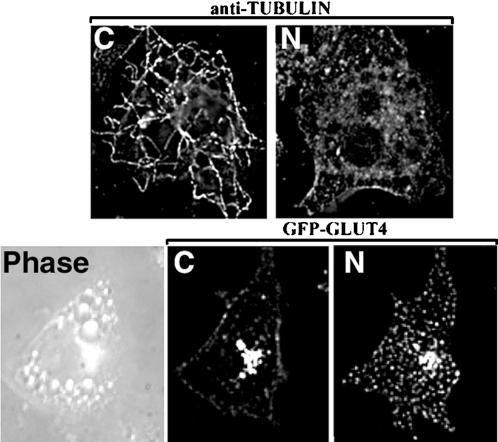
To determine both the mechanism whereby GLUT4-eGFP travels along linear tracks, as well as the physiological relevance of this motility, we tested the effects of microtubule- and actin depolymerizing drugs both on the distribution of GLUT4-eGFP, and on 2-deoxyglucose transport in nontransfected 3T3-L1 adipocytes. Within 10 min of addition, nocodazole, a potent inhibitor of microtubule polymerization, disrupted microtubules networks visible after fixation and staining of 3T3-L1 adipocytes with antitubulin antibodies (Figure 7, top). To examine the effects of microtubule depolymerization on GLUT4 dynamics, 100 sets of 21 optical sections of a 3T3-L1 adipocyte were acquired at 4-s intervals. Nocodazole was then added, and 40 sets were then collected at 30-s intervals. At that point, insulin was added, and 200 sets were collected at 4-s intervals (QuickTime Demo 3). Selected optical sections of this series are shown in Figure 7 (bottom). Exposure to nocodazole for 10 min changed the localization of GLUT4-eGFP from a tight juxtanuclear region, to a relatively homogeneous dispersion throughout the cytoplasm. These dispersed structures were more vesicular and homogeneous in size than those observed in control cells, and were much less dynamic. The effect of nocodazole was readily reversible as, within 5 min of washing, bidirectional movement of GLUT4-eGFP could be readily detected. These results indicate that the basal distribution of GLUT4 in 3T3-L1 cells is controlled by the microtubule cytoskeleton.
Figure 7.
Effect of nocodazole on GLUT4-eGFP dynamics. (A) 3T3-L1 adipocytes were incubated without (C) or with 10 μM nocodazole (N) for 20 min, fixed, and stained with antibody against alpha-tubulin followed by anti-mouse secondary antibody coupled with fluorescein isothiocyanate. (B) Single 250-nm optical sections through a 3T3-L1 adipocyte before (C) or after 20-min incubation with 5 μM nocodazole (N) (see QuickTime Demo 3).
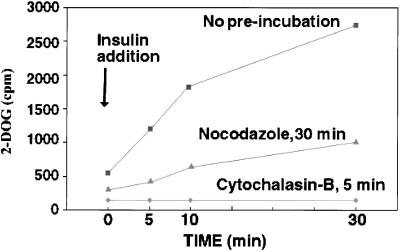
If the effects of insulin to redistribute GLUT4 to the cell surface indeed depend on microtubule-based motility mechanisms, disruption of microtubules would be expected to affect the rate of uptake of glucose by 3T3-L1 cells and its response to insulin. Insulin caused a 9-fold stimulatory effect in the rate of cytochalasin-B-inhibitable 2-deoxyglucose uptake, which was half-maximal after 5 min, and gradually reached a maximal rate after 20–30 min (Figure 8). In cells incubated with nocodazole for 60 min, basal 2-deoxyglucose uptake was slightly reduced, and the effect of insulin was reduced by 75% at 5 min and 66% after 30 min of insulin stimulation. These results support the hypothesis that microtubule-based motility plays an essential role in the maintenance of GLUT4 localization and its mobilization in response to insulin.
Figure 8.
Effect of nocodazole on insulin-stimulated 2-deoxyglucose uptake. 3T3-L1 adipocytes were preincubated with buffer (no preincubation), with 10 μM nocodazole for 30 min (nocodazole, 30 min), or with 20 μM cytochalasin-B for 5 min. Insulin (100 nM) was then added, and after the times indicated on the abscissa, uptake of 2-[1,2-3H]deoxy-d-glucose was measured as described in MATERIALS AND METHODS.
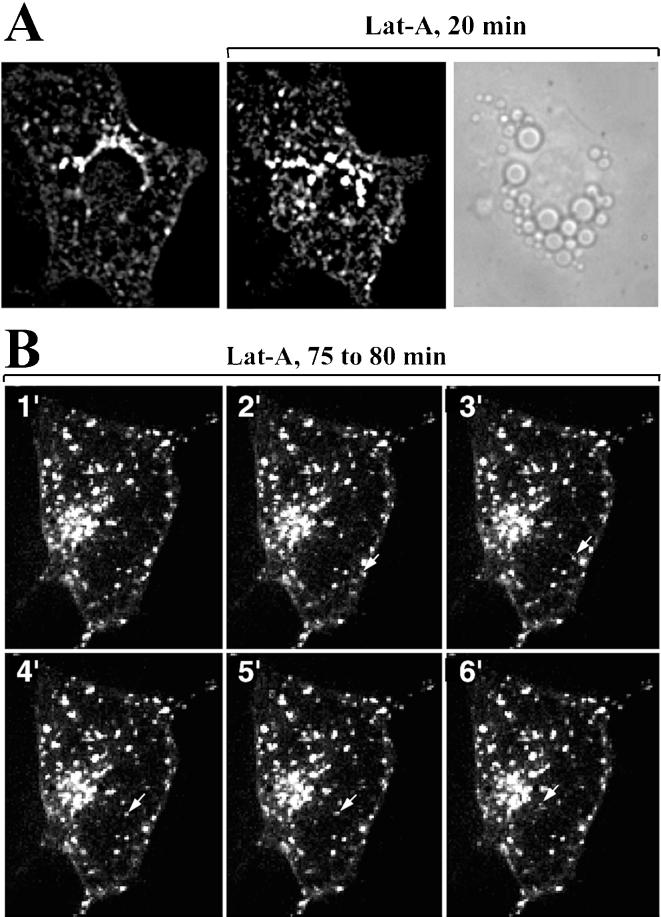
The dynamics of GLUT4-eGFP involves apparent fusion and fission events, as well as local movements and transformations of tubulo-vesicular elements that do not appear to involve motility over long distances. This local motility might be due to the interactions of GLUT4-enriched endosomes with the actin cytoskeleton. The actin cytoskeletal network can be depolymerized with Lat-A, a toxin purified from the red sea sponge, Latrunculia magnifica, which disrupts the polymerization of actin by forming a 1:1 M complex with G-actin. Cells treated with Lat-A (5 μM) for 20 min displayed marked and rapid changes in shape, as well as dramatic alterations in the motility and shape of GLUT4-containing endosomal elements. Within 10 min of exposure to Lat-A, GLUT4-eGFP was found in larger, more vesicular structures, which concentrated in the juxtanuclear region (QuickTime Demo 4 and Figure 9A). In cells exposed to Lat-A for 75 min, virtually all movement of GLUT4-GFP stopped, as demonstrated by the lack of significant change in GLUT4-eGFP pattern over six 60-s intervals (Figure 9B). Isolated vesicles could be seen moving over long distances (Figure 9B, arrow; and QuickTime Demo 5), but the frequency of these events was low.
Figure 9.
Effect of latrunculin-A on GLUT4-eGFP dynamics. (A) Single 250-nm optical sections through a 3T3-L1 adipocyte before (left) or after 20-min exposure to 10 μM Lat-A. The phase image (right) was obtained immediately after, to indicate that the cell remained spread out and attached to the coverslip. (B) 2D-projection of 21 optical sections through a 3T3-L1 adipocyte taken at 1-min intervals after 75 min of exposure to Lat-A. The arrow points to the trajectory of a single vesicle migrating toward the center of the cell (QuickTime Demos 4 and 5).
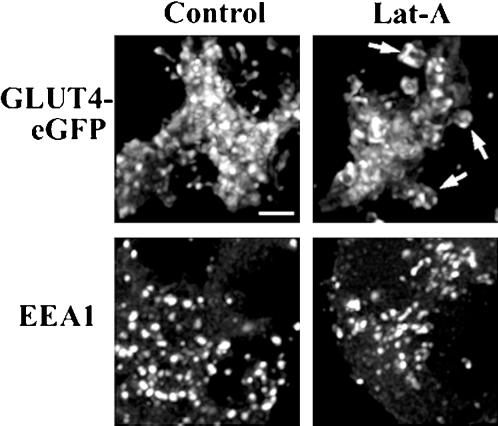
To determine whether the changes in shape of GLUT4-containing compartment might be due to a generalized morphological change in the endosomal membrane network, we compared the effects of Lat-A on GLUT4-eGFP and EEA1, a marker specific for the early endosomal compartment. Higher resolution images of the juxtanuclear region of control or Lat-A-treated adipocytes expressing GLUT4-eGFP, or stained for endogenous EEA1 reveal that, although disruption of the actin cytoskeleton caused GLUT4 to accumulate in large, vacuolar-like endosomes (Figure 10, top right, arrows), it had no detectable effect on the morphology of the early endosomal compartment (Figure 10, bottom).
Figure 10.
Effect of latrunculin-A on GLUT4-eGFP and EEA1. 3T3-L1 adipocytes expressing GLUT4-eGFP (control) were exposed to Lat-A for 20 min, fixed, permeabilized, and stained with a polyclonal antibody raised to EEA1. Each panel is the projection in a single two-dimensional plane of 30 optical sections through the juxtanuclear region of the cell. The arrows on the top right panel point to vacuoles containing GLUT4-eGFP. Bar, 3 μm.
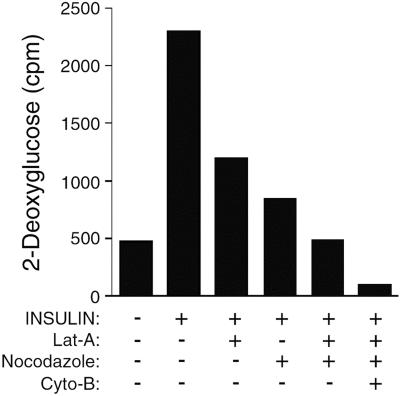
These images indicate that both the local motility of GLUT4-enriched endosomes and their movement over longer distances are dependent on actin filament integrity. This latter effect could be due to a requirement for actin for the interaction of vesicles with the microtubule cytoskeleton. Such interplay between actin and microtubules is known to play a fundamental role in the control of organelle movements (Brown, 1999; Goode et al., 2000). Consistent with these results, we found that a 30-min incubation with Lat-A caused an approximate 50% block in 2-deoxyglucose uptake in insulin-treated cells (Figure 11) consistent with previous reports (Wang et al., 1998; Omata et al., 2000). The partial inhibitory effects of Lat-A and nocodazole on 2-deoxyglucose might reflect temporal differences in the requirement for actin and microtubule cytoskeletal networks in insulin-stimulated GLUT4 traffic. If so, the combination of microtubule and actin depolymerization would be expected to completely block insulin-stimulated 2-deoxyglucose uptake in these cells. Figure 11 indicates that this is indeed the case.
Figure 11.
Effects of microtubule and actin depolymerization on insulin-stimulated 2-deoxyglucose uptake. Latrunculin-A (10 μM), nocodazole (10 μM), and cytochalasin-B (20 μM) were added 30 min before the addition of insulin (100 nM), as indicated along the abscissa. 2-Deoxyglucose uptake was measured after 15 min of insulin addition.
DISCUSSION
The ability to image the same cell over a period of 20–30 min has allowed us to visualize for the first time the movement of GLUT4-eGFP that occurs in 3T3-L1 adipocytes under basal conditions and in response to insulin. We have found that the vast majority of GLUT4 resides in membrane structures that display pronounced plasticity. The dynamic nature of these structures is consistent with electron microscopy studies that find GLUT4 in many morphologically different membrane subcompartments (Slot et al., 1991; Smith et al., 1991).
A key finding in this article is that, like the effect of insulin on glucose uptake, the accumulation of GLUT4 on the plasma membrane in 3T3-L1 adipocytes occurs with a half time of ∼5 min, and maximizes after 15–20 min (Elmendorf et al., 1999; Garza and Birnbaum, 2000). These results suggest that mechanisms in addition to the fusion of vesicles underlying the plasma membrane are involved in insulin action on GLUT4 translocation. The hypothesis that GLUT4 is mobilized from a source distant from the plasma membrane is consistent with previous immunofluorescence studies, where the formation of a bright rim of GLUT4 is clearly detected after insulin stimulation (Oatey et al., 1997; Elmendorf et al., 1999). At the resolution used in these studies (>500 nm/pixel), GLUT4 vesicles would not be resolved from the plasma membrane unless they were separated by a distance of at least 10 diameters. Thus, the difference in fluorescence intensity at the rim between control cells and cells treated with insulin would be virtually indistinguishable if the major pool of insulin-sensitive GLUT4 were within 0.5 μm from the plasma membrane.
The results presented here provide a novel, testable hypothesis for the mechanisms by which intracellular GLUT4 mobilized to the plasma membrane in response to insulin. We postulate that insulin stimulates the interaction of vesicles containing GLUT4 with microtubule networks, and that actin is required both for this interaction as well as for targeting GLUT4 to specific sites at the plasma membrane. This hypothesis is based on several observations. First, on the observation of streams of tubulo-vesicular structures emanating from the juxtanuclear region to the plasma membrane in response to insulin. Second, on the kinetics of this motility, which was observed as early as 1 min after insulin addition, and became most evident after 5 to 8 min of stimulation. This kinetics matches that of insulin action on the accumulation of GLUT4 on the membrane and on the stimulation of glucose transport. Third, on the dramatic redistribution of the majority of the GLUT4 pool observed in response to nocodazole, which indicates that in the steady state GLUT4-enriched vesicles interact with microtubules. Fourth, on the substantial inhibition by nocodazole of insulin-stimulated 2-deoxyglucose, which suggests that the interactions of GLUT4-enriched vesicles with microtubules are physiologically relevant for insulin action of GLUT4 translocation.
Understanding the precise manner by which the interaction with microtubules is important requires further study. One hypothesis to test is that insulin might regulate the interaction of vesicles containing GLUT4 with a kinesin. Alternatively, microtubules might be required to sort GLUT4 into a compartment from which it can be mobilized to the plasma membrane in response to insulin. An analogous role for microtubules in controlling protein sorting among late endosomes and the trans-Golgi network has been documented (Itin et al., 1999).
Our studies reveal that disruption of actin microfilaments resulted in the localization of GLUT4 in larger, almost immobile vesicles in the juxtanuclear region. GLUT4 translocation has previously been found to be sensitive to actin depolymerization (Wang et al., 1998; Omata et al., 2000). Two roles of actin in GLUT4 motility could be hypothesized. First, actin motors could coordinate the interaction of GLUT4-enriched vesicles with microtubules. In the absence of actin, GLUT4-enriched vesicles would be rendered immobile due to lack of microtubule interactions. Such dual dependency on microtubules and microfilament motors has been found to operate in vesicular traffic in melanosomes, and myosin V has been proposed to form a complex with kinesin (Rodionov et al., 1991; Langford, 1995; Hirokawa, 1998; Rodionov et al., 1998; Huang et al., 1999). Alternatively, GLUT4-enriched vesicles might interact directly with actin, and motors such as myosins I or V could drive long-distance movement (Rodionov et al., 1998; Tabb et al., 1998). Interestingly, the interaction of GLUT4 with aldolase appears to indirectly link it to the actin cytoskeleton (Kao et al., 1999).
Our studies also indicate that GLUT4 is targeted to specific sites on the plasma membrane. The specific SNARE complexes involved in GLUT4 insertion into adipocyte plasma membranes are distributed homogeneously on the plasma membrane (Cheatham et al., 1996; Macaulay et al., 1997; Olson et al., 1997; Thurmond et al., 1998; Min et al., 1999; Pessin et al., 1999), and thus additional mechanisms must account for targeting to specific membrane sites. In the yeast Saccharomyces cerevisiae, a specific protein complex, the exocyst, acts in conjunction with the actin cytoskeleton to direct vesicles to specific membrane sites in response to cues that signal the need for bud formation (TerBush et al., 1996; Roth et al., 1998). Insulin signal transduction pathways may in an analogous manner lead to the actin-dependent organization of sites of exocytosis through the known orthologues of exocyst components (Guo et al., 1997; Kee et al., 1997).
In summary, the results shown in this article indicate that the half-time of accumulation of GLUT4 on the cell surface matches that of insulin-stimulated glucose transport, and suggests that mechanisms additional to the control of fusion are involved in insulin action on GLUT4 localization. Furthermore, a functional role of the microtubule and actin cytoskeletal systems in the mechanism of insulin action on GLUT4 traffic is hypothesized. Both actin-based and microtubule-based motors are potential targets for kinases and phosphatases (Sato-Yoshitake et al., 1992). This study reveals these proteins to be potential novel targets for insulin-stimulated signal transduction pathways.
Supplementary Material
ACKNOWLEDGMENTS
We are indebted to Dr. Jeffrey Pessin for generously providing the GLUT4-eGFP construct as well as advice on the electroporation procedure and many helpful discussions. We also thank Dr. Michael Czech for critical reading of the manuscript, and for support of this work. This work was supported in part by NIH-Diabetes Endocrinology Research Grant DK-32520.
Footnotes
Online version of this article contains video material for Figures 1,2,5, and 9. Online version available at www.molbiolcell.org.
* Corresponding author. E-mail address: silvia.corvera@umassmed.edu.
REFERENCES
- Bajno L, Peng XR, Schreiber AD, Moore HP, Trimble WS, Grinstein S. Focal exocytosis of VAMP3-containing vesicles at sites of phagosome formation. J Cell Biol. 2000;149:697–706. doi: 10.1083/jcb.149.3.697. [DOI] [PMC free article] [PubMed] [Google Scholar]
- Brown SS. Cooperation between microtubule- and actin-based motor proteins. Annu Rev Cell Dev Biol. 1999;15:63–80. doi: 10.1146/annurev.cellbio.15.1.63. [DOI] [PubMed] [Google Scholar]
- Carrington WA, Lynch RM, Moore ED, Isenberg G, Fogarty KE, Fay FS. Superresolution three-dimensional images of fluorescence in cells with minimal light exposure. Science. 1995;268:1483–1487. doi: 10.1126/science.7770772. [DOI] [PubMed] [Google Scholar]
- Charron MJ, Katz EB. Metabolic and therapeutic lessons from genetic manipulation of GLUT4. Mol Cell Biochem. 1998;182:143–152. [PubMed] [Google Scholar]
- Cheatham B, Volchuk A, Kahn CR, Wang L, Rhodes CJ, Klip A. Insulin-stimulated translocation of GLUT4 glucose transporters requires SNARE-complex proteins. Proc Natl Acad Sci USA. 1996;93:15169–15173. doi: 10.1073/pnas.93.26.15169. [DOI] [PMC free article] [PubMed] [Google Scholar]
- Elmendorf JS, Boeglin DJ, Pessin JE. Temporal separation of insulin-stimulated GLUT4/IRAP vesicle plasma membrane docking and fusion in 3T3L1 adipocytes. J Biol Chem. 1999;274:37357–37361. doi: 10.1074/jbc.274.52.37357. [DOI] [PubMed] [Google Scholar]
- Fingar DC, Hausdorff SF, Blenis J, Birnbaum MJ. Dissociation of pp70 ribosomal protein S6 kinase from insulin-stimulated glucose transport in 3T3–L1 adipocytes. J Biol Chem. 1993;268:3005–8. [PubMed] [Google Scholar]
- Garvey WT, Maianu L, Zhu JH, Brechtel-Hook G, Wallace P, Baron AD. Evidence for defects in the trafficking and translocation of GLUT4 glucose transporters in skeletal muscle as a cause of human insulin resistance. J Clin Invest. 1998;101:2377–2386. doi: 10.1172/JCI1557. [DOI] [PMC free article] [PubMed] [Google Scholar]
- Garvey WT, Maianu L, Zhu JH, Hancock JA, Golichowski AM. Multiple defects in the adipocyte glucose transport system cause cellular insulin resistance in gestational diabetes. Heterogeneity in the number and a novel abnormality in subcellular localization of G.L.U.T4 glucose transporters. Diabetes. 1993;42:1773–1785. doi: 10.2337/diab.42.12.1773. [DOI] [PubMed] [Google Scholar]
- Garza LA, Birnbaum MJ. Insulin-responsive aminopeptidase trafficking in 3T3–L1 adipocytes. J Biol Chem. 2000;275:2560–2567. doi: 10.1074/jbc.275.4.2560. [DOI] [PubMed] [Google Scholar]
- Goode BL, Drubin DG, Barnes G. Functional cooperation between the microtubule and actin cytoskeletons. Curr Opin Cell Biol. 2000;12:63–71. doi: 10.1016/s0955-0674(99)00058-7. [DOI] [PubMed] [Google Scholar]
- Guo W, Roth D, Gatti E, De Camilli P, Novick P. Identification and characterization of homologues of the Exocyst component Sec10p. FEBS Lett. 1997;404:135–139. doi: 10.1016/s0014-5793(97)00109-9. [DOI] [PubMed] [Google Scholar]
- Hashiramoto M, James DE. Characterization of insulin-responsive GLUT4 storage vesicles isolated from 3T3–L1 adipocytes. Mol Cell Biol. 2000;20:416–427. doi: 10.1128/mcb.20.1.416-427.2000. [DOI] [PMC free article] [PubMed] [Google Scholar]
- Hirokawa N. Kinesin and dynein superfamily proteins and the mechanism of organelle transport. Science. 1998;279:519–526. doi: 10.1126/science.279.5350.519. [DOI] [PubMed] [Google Scholar]
- Huang JD, Brady ST, Richards BW, Stenolen D, Resau JH, Copeland NG, Jenkins NA. Direct interaction of microtubule- and actin-based transport motors [see comments] Nature. 1999;397:267–270. doi: 10.1038/16722. [DOI] [PubMed] [Google Scholar]
- Itin C, Ulitzur N, Muhlbauer B, Pfeffer SR. Mapmodulin, cytoplasmic dynein, and microtubules enhance the transport of mannose 6-phosphate receptors from endosomes to the trans-golgi network. Mol Biol Cell. 1999;10:2191–2197. doi: 10.1091/mbc.10.7.2191. [DOI] [PMC free article] [PubMed] [Google Scholar]
- Kao AW, Noda Y, Johnson JH, Pessin JE, Saltiel AR. Aldolase mediates the association of F-actin with the insulin-responsive glucose transporter GLUT4. J Biol Chem. 1999;274:17742–17747. doi: 10.1074/jbc.274.25.17742. [DOI] [PubMed] [Google Scholar]
- Kee Y, Yoo JS, Hazuka CD, Peterson KE, Hsu SC, Scheller RH. Subunit structure of the mammalian exocyst complex. Proc Natl Acad Sci USA. 1997;94:14438–14443. doi: 10.1073/pnas.94.26.14438. [DOI] [PMC free article] [PubMed] [Google Scholar]
- Langford GM. Actin- and microtubule-dependent organelle motors: interrelationships between the two motility systems. Curr Opin Cell Biol. 1995;7:82–88. doi: 10.1016/0955-0674(95)80048-4. [DOI] [PubMed] [Google Scholar]
- Macaulay SL, Hewish DR, Gough KH, Stoichevska V, MacPherson SF, Jagadish M, Ward CW. Functional studies in 3T3L1 cells support a role for SNARE proteins in insulin stimulation of GLUT4 translocation. Biochem J. 1997;324:217–224. doi: 10.1042/bj3240217. [DOI] [PMC free article] [PubMed] [Google Scholar]
- Oatey PB, Van Weering DH, Dobson SP, Gould GW, Tavare JM. GLUT4 vesicle dynamics in living 3T3 L1 adipocytes visualized with green-fluorescent protein. Biochem J. 1997;327:637–642. doi: 10.1042/bj3270637. [DOI] [PMC free article] [PubMed] [Google Scholar]
- Olson AL, Knight JB, Pessin JE. Syntaxin 4, VAMP2, and/or VAMP3/cellubrevin are functional target membrane and vesicle SNAP receptors for insulin-stimulated GLUT4 translocation in adipocytes. Mol Cell Biol. 1997;17:2425–2435. doi: 10.1128/mcb.17.5.2425. [DOI] [PMC free article] [PubMed] [Google Scholar]
- Omata W, Shibata H, Li L, Takata K, Kojima I. Actin filaments play a critical role in insulin-induced exocytotic recruitment but not in endocytosis of GLUT4 in isolated rat adipocytes. Biochem J. 2000;346:321–328. [PMC free article] [PubMed] [Google Scholar]
- Pessin JE, Thurmond DC, Elmendorf JS, Coker KJ, Okada S. Molecular basis of insulin-stimulated GLUT4 vesicle trafficking. Location! Location! Location! J Biol Chem. 1999;274:2593–2596. doi: 10.1074/jbc.274.5.2593. [DOI] [PubMed] [Google Scholar]
- Rizzuto R, Carrington W, Tuft RA. Digital imaging microscopy of living cells. Trends Cell Biol. 1998a;8:288–292. doi: 10.1016/s0962-8924(98)01301-4. [DOI] [PubMed] [Google Scholar]
- Rizzuto R, Pinton P, Carrington W, Fay FS, Fogarty KE, Lifshitz LM, Tuft RA, Pozzan T. Close contacts with the endoplasmic reticulum as determinants of mitochondrial Ca2+ responses. Science. 1998b;280:1763–1766. doi: 10.1126/science.280.5370.1763. [DOI] [PubMed] [Google Scholar]
- Robinson LJ, Razzack ZF, Lawrence JC, Jr, James DE. Mitogen-activated protein kinase activation is not sufficient for stimulation of glucose transport or glycogen synthase in 3T3–L1 adipocytes. J Biol Chem. 1993;268:26422–26427. [PubMed] [Google Scholar]
- Rodionov VI, Gyoeva FK, Gelfand VI. Kinesin is responsible for centrifugal movement of pigment granules in melanophores. Proc Natl Acad Sci USA. 1991;88:4956–4960. doi: 10.1073/pnas.88.11.4956. [DOI] [PMC free article] [PubMed] [Google Scholar]
- Rodionov VI, Hope AJ, Svitkina TM, Borisy GG. Functional coordination of microtubule-based and actin-based motility in melanophores [see comments] Curr Biol. 1998;8:165–168. doi: 10.1016/s0960-9822(98)70064-8. [DOI] [PubMed] [Google Scholar]
- Roth D, Guo W, Novick P. Dominant negative alleles of SEC10 reveal distinct domains involved in secretion and morphogenesis in yeast. Mol Biol Cell. 1998;9:1725–1739. doi: 10.1091/mbc.9.7.1725. [DOI] [PMC free article] [PubMed] [Google Scholar]
- Sankaranarayanan S, Ryan TA. Real-time measurements of vesicle-SNARE recycling in synapses of the central nervous system. Nat Cell Biol. 2000;2:197–204. doi: 10.1038/35008615. [DOI] [PubMed] [Google Scholar]
- Sato-Yoshitake R, Yorifuji H, Inagaki M, Hirokawa N. The phosphorylation of kinesin regulates its binding to synaptic vesicles. J Biol Chem. 1992;267:23930–23936. [PubMed] [Google Scholar]
- Slot JW, Geuze HJ, Gigengack S, James DE, Lienhard GE. Translocation of the glucose transporter GLUT4 in cardiac myocytes of the rat. Proc Natl Acad Sci USA. 1991;88:7815–7819. doi: 10.1073/pnas.88.17.7815. [DOI] [PMC free article] [PubMed] [Google Scholar]
- Smith RM, Charron MJ, Shah N, Lodish HF, Jarett L. Immunoelectron microscopic demonstration of insulin-stimulated translocation of glucose transporters to the plasma membrane of isolated rat adipocytes and masking of the carboxyl-terminal epitope of intracellular G.L.U.T4. Proc Natl Acad Sci USA. 1991;88:6893–6897. doi: 10.1073/pnas.88.15.6893. [DOI] [PMC free article] [PubMed] [Google Scholar]
- Subtil A, Lampson MA, Keller SR, McGraw TE. Characterization of the insulin-regulated endocytic recycling mechanism in 3T3–L1 adipocytes using a novel reporter molecule. J Biol Chem. 2000;275:4787–4795. doi: 10.1074/jbc.275.7.4787. [DOI] [PubMed] [Google Scholar]
- Tabb JS, Molyneaux BJ, Cohen DL, Kuznetsov SA, Langford GM. Transport of ER vesicles on actin filaments in neurons by myosin V. J Cell Sci. 1998;111:3221–3234. doi: 10.1242/jcs.111.21.3221. [DOI] [PubMed] [Google Scholar]
- TerBush DR, Maurice T, Roth D, Novick P. The Exocyst is a multiprotein complex required for exocytosis in Saccharomyces cerevisiae. EMBO J. 1996;15:6483–6494. [PMC free article] [PubMed] [Google Scholar]
- Thurmond DC, Ceresa BP, Okada S, Elmendorf JS, Coker K, Pessin JE. Regulation of insulin-stimulated GLUT4 translocation by Munc18c in 3T3L1 adipocytes. J Biol Chem. 1998;273:33876–33883. doi: 10.1074/jbc.273.50.33876. [DOI] [PubMed] [Google Scholar]
- van den Berghe N, Ouwens DM, Maassen JA, van Mackelenbergh MG, Sips HC, Krans HM. Activation of the Ras/mitogen-activated protein kinase signaling pathway alone is not sufficient to induce glucose uptake in 3T3–L1 adipocytes. Mol Cell Biol. 1994;14:2372–2377. doi: 10.1128/mcb.14.4.2372. [DOI] [PMC free article] [PubMed] [Google Scholar]
- Wang Q, Bilan PJ, Tsakiridis T, Hinek A, Klip A. Actin filaments participate in the relocalization of phosphatidylinositol3-kinase to glucose transporter-containing compartments and in the stimulation of glucose uptake in 3T3–L1 adipocytes [published erratum appears in Biochem J. (1999) 341, 861] Biochem J. 1998;331:917–928. doi: 10.1042/bj3310917. [DOI] [PMC free article] [PubMed] [Google Scholar]
- Waters SB, D'Auria M, Martin SS, Nguyen C, Kozma LM, Luskey KL. The amino terminus of insulin-responsive aminopeptidase causes Glut4 translocation in 3T3–L1 adipocytes. J Biol Chem. 1997;272:23323–23327. doi: 10.1074/jbc.272.37.23323. [DOI] [PubMed] [Google Scholar]
- Xu T, Ashery U, Burgoyne RD, Neher E. Early requirement for alpha-SNAP and NSF in the secretory cascade in chromaffin cells. EMBO J. 1999a;18:3293–3304. doi: 10.1093/emboj/18.12.3293. [DOI] [PMC free article] [PubMed] [Google Scholar]
- Xu T, Rammner B, Margittai M, Artalejo AR, Neher E, Jahn R. Inhibition of SNARE complex assembly differentially affects kinetic components of exocytosis. Cell. 1999b;99:713–722. doi: 10.1016/s0092-8674(00)81669-4. [DOI] [PubMed] [Google Scholar]
- Young A, Tuft R, Carrington W, Doxsey SJ. Centrosome dynamics in living cells. Methods Cell Biol. 1999;58:223–238. doi: 10.1016/s0091-679x(08)61958-5. [DOI] [PubMed] [Google Scholar]
- ZhuGe R, Tuft RA, Fogarty KE, Bellve K, Fay FS, Walsho JV. The influence of Sarcoplasmic reticulum Ca concentration on Ca sparks and spontaneous transient outward currents in single muscle cells. J Gen Physiol. 1999;113:215–228. doi: 10.1085/jgp.113.2.215. [DOI] [PMC free article] [PubMed] [Google Scholar]
Associated Data
This section collects any data citations, data availability statements, or supplementary materials included in this article.


