

Abstract
The aggregation of polyglutamine containing protein sequences is implicated in a family of familial neurodegenerative diseases, the expanded CAG repeat diseases. While the cellular aggregation process undoubtedly depends on the flux and local environment of these proteins, their intrinsic physical properties and folding/aggregation propensities must also contribute to their cellular behavior. Here we describe a series of methods for determining mechanistic details of the spontaneous aggregation of polyQ-containing sequences, including the identification and structural examination of aggregation intermediates.
Keywords: kinetics, thioflavin T, seeding, amyloid, oligomer, fluorescence
1. Introduction
Dense aggregates rich in specific proteins are observed on analysis of patient brains from a variety of common neurodegenerative diseases, including Alzheimer’s, Parkinson’s, and Huntington’s diseases [1], and may also be a feature of normal aging [2]. If the formation of these highly visible aggregates, or of intermediate aggregates less obvious on autopsy, is indeed a key step in the mechanisms of neurodegeneration and aging, then it is important to better understand how protein aggregation events are initiated. One fruitful approach has been to characterize the biophysical behavior of proteins in simple buffer systems in vitro. While it is clearly possible that the mechanistic details of the initiation of aggregation can differ substantially in vivo and in vitro, there are many instances in which in vitro results appear to mirror an important aspect of pathobiology in patients, animal models, and/or cell models. In a recent, striking example, a pair of Ser to Asp mutations in the 17 amino acid httNT sequence in the N-terminus of the huntingtin (htt) protein completely abrogate both neuronal aggregates and the disease phenotype associated with expanded polyQ in a full-length htt knock-in transgenic mouse, while producing parallel effects in a htt N-terminal fragment in vitro [3].
Even when in vitro results do not presage the in vivo experience, it is clear that in vitro studies help to define the kinetic and thermodynamic preferences encoded within the protein’s amino acid sequence, and any major differences in behavior observed when the molecule is placed in the cellular context have to be understood in terms of how the biological system subverts or enhances these underlying biophysical preferences. Without a knowledge of baseline behavior generated by in vitro studies, for example, the contributions to in vitro aggregation of molecular crowding, molecular chaperones, trafficking and organelle sequestration, proteolysis and other post-translational modifications could entirely escape detection and/or would be difficult to elucidate.
Polypeptide aggregation is often initiated by a nucleation event in which rapid aggregate growth is preceded by relatively slow formation of a required kinetic nucleus. Most in vitro studies of spontaneous protein aggregation tend to be (or at least are intended to be) studies of the process of homogeneous nucleation, in which the nucleus is a rare, transiently formed, thermodynamically unstable state of the protein under study. The fact that most biological protein aggregation takes place in a complex medium rich in a variety of macromolecules and super-assemblies, and at concentrations below those typically studied in vitro, suggests that spontaneous aggregation in vivo might at least sometimes occur via some heterogeneous nucleation process, such as the initiation of aggregate growth by the interaction of the protein with a nucleation surface provided by a cellular component. Nonetheless, some in vitro studies of aggregation replicate to a remarkable degree the process observed in vivo, suggesting a similar aggregation mechanisms in the cell and in the test tube, in spite of the radically different environments. For example, the repeat length dependence of polyglutamine (polyQ) aggregation rates is very similar in vitro [4] and in a C. elegans model system [5]. Accounting for spontaneous protein aggregation is not just a matter of reaction rates, however. Another important feature of a mechanism is the nature of the intermediate structures that form along the way to the reaction endpoint. As discussed below, developing a mechanism for nucleation is not just a matter of what is observed, but also of what is not observed.
Polyglutamine and the disease proteins containing these repeats provide a rich system for studying nucleation mechanisms whose elucidation has important potential practical consequences in human health [6]. PolyQ-containing N-terminal fragments of the huntingtin (htt) protein that is mutated in Huntington’s disease (HD) are particularly interesting since they provide one of the few cases where it has been demonstrated that a single protein is susceptible to two competing aggregation pathways with different intermediates and products (Jayaraman et al., manuscript submitted). The degree to which this competition occurs in vivo, and the toxic nature of the products or intermediates of the preferred in vivo pathway, are of clear interest to understanding disease mechanisms.
This laboratory has had a focus on understanding mechanisms of polyQ aggregation and its nucleation for over 10 years, since our development of solubilization protocols for chemically synthesized polyQ peptides [7] that made such studies feasible. In the course of this work we developed a number of additional novel methods, many of which have been described [8, 9]. In this paper, we focus on several more recently developed new methods and improvements.
2. Working with huntingtin N-terminal fragments
We have found that addition of flanking sequences to polyQ can significantly affect aggregation mechanisms, rates, and products [10, 11]. In some cases, the presence of flanking sequences also influences how the resulting peptides and aggregates respond to procedures developed for simple polyQ peptides, and may require changes in protocols in order to maximize results. In this section we address measures taken to improve recovery and behavior of synthetic huntingtin N-terminal fragments that contain the N-terminal 17 amino acid segment (“httNT”) of huntingtin that precedes the polyQ segment.
2.1. Disaggregation procedures for httNT-polyQ sequences
As previously described [9], our standard disaggregation protocol consists of dissolving the lyophilized peptide in either 100% trifluoroacetic acid (TFA), or a 1:1 mix of TFA and hexafluoroisopropanol (HFIP), then evaporating the solvent under a stream of nitrogen to generate a thin film on the inner wall of a glass tube. The film is then subjected to vacuum to remove traces of the volatile solvents, then is dissolved in 0.01 % aqueous TFA (pH 3) and centrifuged to remove residual aggregates. The supernatant is then immediately adjusted to the desired buffer conditions and the peptide studied. Storage of disaggregated peptides before use is discouraged, since aggregation can occur even in frozen solutions [12].
For polyQ peptides containing the httNT sequence, this procedure was modified to enhance recovery and quality of the peptide. First, we found that dissolving the peptide at a lower weight concentration of ~ 100 μg/ml in 1:1 TFA:HFIP improved recoveries. As previously discussed [9], surface to volume ratios can greatly impact the yield and quality of the material obtained, and so it is important that, when the total volume of solvent per weight of peptide is increased, the resulting solution should be distributed over more glass vials rather than in larger glass vessels. We used vials of dimensions d = 2.8 cm and h = 6.1 cm, filling each to about 5 % capacity, then evaporating under the nitrogen stream. This evaporation process is managed conveniently using a commercially available manifold (Organomation N-EVAP evaporator, Fisher Scientific, catalog # NC 9140221).
We have also found that the prolonged exposure of peptides containing Met residues to ambient dissolved oxygen can lead to significant (5–7 %) oxidation of the Met side chain that can be observed by altered mobility in the reverse phase HPLC and by mass spectrometric analysis. This oxidation can be greatly suppressed, to less than 1 %, if the solvents in which the peptide will be incubated for any substantial period, i.e., the pH 3 TFA/water and PBS buffer stock, are purged of oxygen by bubbling nitrogen through the solvent prior to use. The sensitivity of protein molecules to oxidation and other chemical degradation underscores one of the important advantages of using HPLC or LC/MS to monitor aggregation reactions (as opposed to, for example, a simple BCA-type protein assay), since any adventitious chemical modifications that do occur can be easily detected. Such oxidation reactions can have a significant effect on peptide properties, for example altering aggregation kinetics and aggregation critical concentrations [11].
2.2. Negative staining electron microscopy of aggregates
Important information relevant to sorting out nucleation mechanisms can be obtained by structural characterization of intermediate and final aggregation products, and negative stain EM is an important, widely utilized method for obtaining this information. Using 1 % Uranyl acetate staining, we have found that the quality of EM images of aggregates obtained in our lab can depend greatly on staining time. Optimal staining time appears to be dependent mostly on peptide composition, regardless of the kind of aggregate (oligomer, protofibril, fibril) being imaged. Thus, aggregates of Aβ peptides generally require about 30 secs exposure to the staining solution for optimal staining. In contrast, the amyloid-like aggregates made from simple polyQ peptides with or without an attached polyproline segment require lower staining times of about five secs to obtain good negative staining. Optimal negative staining of polyQ peptides that contain the httNT segment is obtained with only two secs exposure to staining solution; with longer exposure, the aggregates take up substantial amounts of stain, producing a positively stained image that is less well defined than the negatively stained images. Figure 1 shows electron micrographs of aggregates of the peptide httNTQ30P10K2 stained for either 30 secs (Fig. 1A) or two secs (Fig. 1B).
Figure 1.

Electron micrographs of httNTQ30P10K2 aggregates by different staining methods. Staining with 1% uranyl acetate for 30 seconds (A) or 2 seconds (B). The scale bar represents 50 nm.
3. Measurements of isolated aggregates
A tremendous amount of information on the nucleation mechanism can be obtained by studying aggregates collected at various times along the reaction coordinate. Clues to the assembly mechanism can be obtained by deciphering which parts of the polypeptide chain are involved in structure, or are exposed to solvent, in aggregates isolated at different times. Useful probes include limited proteolysis, antibody blots, and fluorescence. The ability of an aggregate to efficiently seed its own elongation by monomer addition also says something about the degree and type of structural organization within the aggregate. This can be probed conveniently by a sensitive microplate based elongation assay.
For such measurements to be quantitative and therefore cleanly interpretable, it is important that well characterized amounts or concentrations of aggregates are subjected to analysis. We achieve this with the aid of analytical reverse phase HPLC to assess weight concentrations of aggregates. Typically, aggregates are collected by centrifuging an aliquot of a reaction time point (45 mins at 20,817 x g in an Eppendorf 5417R tabletop centrifuge). The supernatant is decanted and the desired buffer is added, and the aggregate is resuspended by vortexing. Recovery of aggregates in suspension is confirmed and quantified by removal of an aliquot of the vortexed suspension and mixing with ten parts 100% formic acid to one part aggregate suspension, and incubating this mixture 1 hr at 37 ºC. This is analyzed by RP-HPLC to obtain the mass of peptide per volume. The calibrated aggregate suspension is then adjusted in concentration to make an appropriate stock for the assays described below. The challenge in this type of experiment is in obtaining useful amounts of the earliest formed aggregates. These are not only low in amount, but are also relatively small in particle size and therefore more difficult to collect by centrifugation. Furthermore, while preparative ultracentrifugation can assist collection of smaller aggregates, the down-side to high centrifugation speeds is the additional effort required to resuspend and break up the resulting aggregates. It may be possible, for aggregates that cannot be easily collected by centrifugation, to obtain useful quantities by size exclusion chromatography. Details of the preparation of aggregate suspensions by centrifugation, and their concentration determination, have been described [9].
3.1. Solvent quenching of Trp fluorescence
The interaction of the excited states of fluorophores with aqueous solvents leads to a solvent relaxation process that reduces the energy of the subsequent fluorescence emission, and hence shifts the emission wavelength higher (red shift). Sequestration of the fluorophore in a non-aqueous environment such as a membrane or apolar protein interior limits the energy loss of the excited state, leading to a higher energy emission and hence a decrease in the emission wavelength (blue shift) compared to the solvated fluorophore [13]. Fluorophores sequestered in the interior of a protein aggregate are similarly blue shifted. If the aggregating peptide does not contain a Trp residue, it may be possible to replace a Phe residue with Trp without greatly changing the peptide properties, including aggregation kinetics, and this substitution then allows analysis of aggregate structure using Trp fluorescence [11]. Analysis is carried out with 7–10 μg aggregates suspended in 300 μl 150 mM NaCl, 10 mM phosphate, pH 7.4, and analyzed on a Perkin Elmer LS50B luminescence spectrometer (excitation 280 nm, slit width 5 nm; emission scanned between 290–550 nm, slit width 5 nm). Figure 2 shows a superposition of the monomer and a series of aggregates, collected at various time points, for the peptide httNTQ20P10K2 (F17W), an analog of a huntingtin N-terminal fragment. The data show that the fluorescence maximum of the monomeric peptide is identical to that of the isolated amino acid Trp, suggesting a mobile, solvent exposed structure for the httNT segment, as was confirmed by other analyses [11]. Interestingly, the earliest formed aggregates (oligomeric by EM; data not shown) also show a highly solvent exposed Trp residue, even though limited proteolysis analysis (see Section 3.2) shows that the initial aggregates are formed by packing together of the httNT segments. As the reaction proceeds, presumably mediated by nucleation of amyloid-like structure within isolated oligomers followed by growth by monomer addition (see Section 3.4), the fluorescence of the Trp residue within isolated aggregates shifts to lower wavelengths, consistent with exclusion of water from Trp buried within aggregate structure. This consolidation of structure may indicate amyloid formation by the segment of the peptide containing the Trp residue. We also find that final aggregates of huntingtin N-terminal fragments containing mutations or grown under different conditions exhibit different emission maxima, indicating different degrees of solvent exclusion and/or mobility of the Trp residues within aggregate structure (unpublished data).
Figure 2.
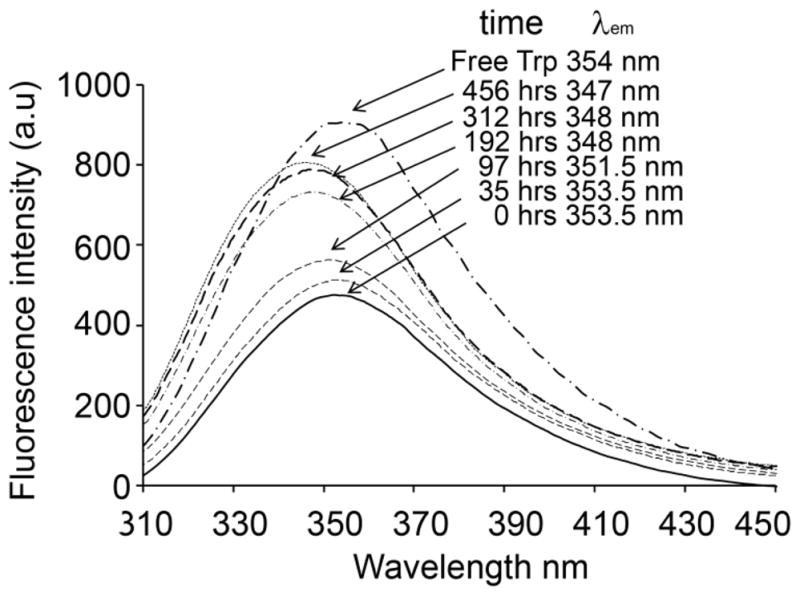
Fluorescence emission spectra of Trp-containing httNTQ20P10K2 (F17W) monomer and aggregates isolated and analyzed at various aggregation reaction times.
3.2. Structure analysis by limited proteolysis
Protection against proteolysis by protein aggregate structure has played an important role in defining prion-related molecular species for three decades [14]. Even amyloid fibrils of relatively small peptides like Aβ can have protease-sensitive as well as protease-resistant segments, and the amyloid core defined by such proteolytic analyses is consistent with other methods [15, 16]. In the case of relatively unstable fibrils, such as some Aβ amyloid, defining the protease-resistant core can require careful analysis of proteolysis rates [15], since the core itself is eventually degraded, probably via dissociation to protease-sensitive monomer fragments. In most cases, however, protease resistant cores are highly stable and can be identified simply by analyzing products isolated after long incubation at high protease levels. In principle, reactions with relatively pure samples can be characterized both by identifying the fragments that are released by aggregate digestion, or by identifying the peptide fragments resident in the resistant core. Figure 3 shows the results of exposure of various physical states of the huntingtin N-terminal fragment httNTQ20P10K2 to trypsin digestion. The httNT segment contains the only three trypsin sites in the peptide. Proteins were incubated at a concentration of 10–20 μg/ml, for 12–16 hrs at 37 ºC (aggregates) or 1 hr at 24–37 ºC (monomer), with a 1:10 weight ratio of trypsin (SEQUENZ-Trypsin, Worthington Biochemical Corp.) to protein, in 50 mM Tris-HCl, pH 7.0. The results show that while the monomer is efficiently cleaved, both the intermediate oligomers and the mature amyloid fibrils are resistant at all three trypsin sites. Thus, while the monomeric peptide exposed to trypsin yields a prominent peak corresponding to the polyQ-containing fragment produced by cleavage at Lys15 within the httNT sequence, and no material eluting at the position of full length httNTQ20P10K2 (Fig. 3, trace 5), both oligomeric aggregates isolated at 42 hrs (Fig. 3, trace 3) and fibrillar aggregates isolated at 700 hrs (Fig. 3, trace 4) yield, after exposure to trypsin and formic acid solubilization of the digestion product, only undigested, full length peptide in LC/MS.
Figure 3.
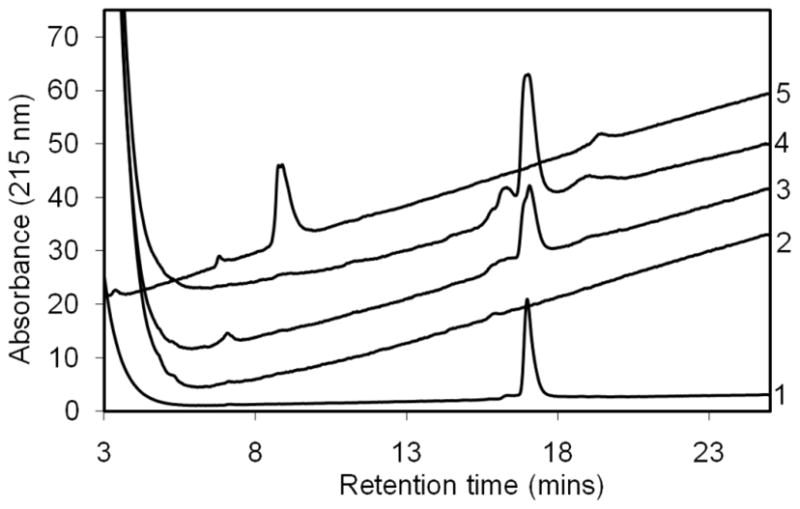
Trypsin digestion products from different physical states of httNTQ20P10 K2 monomer and aggregates: undigested monomer (trace #1); digested monomer (trace #5); aggregates isolated, trypsin-digested, and resolubilized at 42 hrs (trace #3) and 700 hrs (trace #4); supernatant from the digestion of 700 hrs aggregates (trace #2). Three fragments from trypsin digestion of monomeric peptide elute at 3.5 mins (MATLEK), 6.9 mins (AFESLK) and 8.9 mins (SFQ20P10K2). Full length peptide (MATLEKLMKAFESLKSFQ20P10K2) elutes at 17.0 mins. Material eluting at ~ 16.5 mins is full-length peptide that has undergone oxidation at one or both Met residues. Small peaks eluting around 19 mins are trypsin. The off-scale absorbance peaks at low elution times in traces 2, 3 and 4 are derived from the formic acid required to solubilize aggregates before injection. All peptide structures were confirmed by LC-MS.
There are some significant caveats to interpreting limited proteolysis data. While some methods for amyloid structure analysis can give resolution at the atomic [17] or residue [18] level, the resolution of proteolytic cleavage methods is lower and can be affected by peptide chain flexibility. Thus, protease binding and cleavage generally requires that the cleavage site be present in an expanse of polypeptide chain, including 3–4 residues upstream and downstream of the binding site – in other words, located within either an extended chain conformation or in a segment that can transiently access such conformations. This means that sites found to be protected might either be involved in structure or may be close enough to a structural element that protease access is denied. A site proximal to relatively loose structure might also be cleaved slowly as the site becomes transiently accessible. While interpreting anything more than the initial proteolytic event in a polypeptide chain is not advisable in limited proteolysis analysis of globular proteins, due to the possibility/likelihood of unfolding events being triggered by the initial cleavage event, this is presumably less of a problem with more securely structured aggregates. At the same time, it is important to keep this possible complication in mind in analyzing data.
In subsequent studies (R. Mishra, M. Jayaraman and R. Wetzel, unpublished), we found that a portion of the mature aggregates of htt N-terminal fragments grown from mutated peptides or under alternative growth conditions contain httNT segments that are partially accessible to trypsin, showing the sensitivity of this method to details of aggregate structure.
3.3. Segment accessibility in aggregates by antibody dot blots
As with protease sensitivity, analysis of aggregate structure by antibody accessibility requires that the entire peptide segment corresponding to the antibody epitope be accessible, at least transiently. Short, linear epitopes are therefore more useful probes of structure. For example, the anti-polyQ antibody MW1 [19] has been shown by X-ray crystal structure analysis of the complex to bind to a short, linear sequence of polyQ in an extended conformation [20]. One complication in using such antibodies to map polyQ accessibility is the “linear lattice effect”, that yields enhanced binding of antibodies with even modest affinity for their epitope if there is a high local concentration of epitopes, as there is for MW1 in a polyQ sequence [21]. Even with this complication, however, studies with this MAb (similar to the earlier described antibody 1C2 that also binds polyQ [22], have been very informative on htt N-terminal fragment aggregate structural transformations [11].
We followed the accessibility of the MW1 polyQ epitope in both aggregation reaction mixtures and in isolated aggregates, and compared the intensity of the blots to the same amount of monomer [11]. Thus, aliquots containing 400 ng of aggregates were transferred to a nitrocellulose membrane using a Bio-Dot apparatus (Bio-Rad, # 170–6545). Similarly, a portion of the unfractionated aggregation reaction mixture was transferred to nitrocellulose membrane at various time intervals. Blots were incubated overnight with TBST (10 mM Tris-HCl, pH 7.5, 150 mM NaCl, 0.1% (v/v) Tween-20, 0.05% (w/v) sodium azide) buffer containing 5% (w/v) BSA, washed three times with TBST and incubated with a 10 nM solution of purified MW1 antibody (a gift from J. Ko and P. Patterson) for 2 h. After washing with TBST to remove unbound material, blots were incubated 2 h with a 1:15,000 dilution of a peroxidase conjugate of anti-mouse IgG (whole molecule) (Sigma, A4416) and then washed four times with TBST. Blots were visualized with enhanced chemiluminescence solution (Pierce # 34080) following the manufacturer’s instructions.
Given the dependence of the blot intensity on exposure time, we sometimes see no detectable binding to htt N-terminal fragments, and other times observe slight binding which is, however, always considerably less than the binding to equal amounts of isolated oligomers and freshly disaggregated monomers [11]. Low but detectable binding to mature fibrils might indicate the presence of some dangling elements of polyQ sequence not incorporated into aggregate structure.
3.4. Seeding competence for growth of aggregates by monomer addition
One property that appears to distinguish pre-amyloid aggregates from amyloid is the enhanced ability of the latter to growth by monomer addition, even at relatively low monomer concentrations. The lower limit of monomer concentration that can sustain elongation of a given fibril is the critical concentration (Cr), which for many fibrils is below one μM. If the aggregate is adhered to a surface, such as a plastic microplate well, the Cr often appears to be even lower, presumably due to stabilization of the fibril by surface adherence. The low concentrations at which fibril elongation can be observed, which are far below the Cr for oligomer formation in suspension, guarantee that any grown of surface-adsorbed aggregates under these conditions must be due to additions by monomeric peptides and not by oligomers. Assays can thus be conducted at low monomer concentrations, and potentially with low masses of aggregates, provided there is good sensitivity in detecting aggregate growth. Previously we described a microtiter plate assay measuring the ability of a biotin-tagged polyQ monomer to add to a plastic-adsorbed polyQ amyloid-like aggregate [23, 24]. This assay can also be used to monitor Aβ fibril elongation [25], so it appears to be somewhat general. It should be kept in mind, however, that to monitor the elongation of biotin-labeled globular proteins, or even disordered polypeptides that may possess some inhibitory structure within the native ensemble [26], it may well be necessary to find incubation conditions that are partially destabilizing of structures that prevent the docking and/or locking steps [27] that are required for amyloid elongation.
By using this assay format and adhering aggregates isolated at various times along the reaction profile, it is possible to assess their relative abilities to support elongation [11, 28]. Thus, to assay the seeding capacity of aggregates of httNTQ20P10K2 isolated at various aggregation times as described in section 3 above, we incubated 100 μl aliquots of 1 ng/μl suspensions of aggregates in the wells of activated microtiter plates (EIA/RIA 96 well plates, Costar) and incubated the plate uncovered overnight in a 37 ºC oven to allow evaporation and encourage adherence. Two to three rows of wells were adhered with each aggregate type, in order to support kinetics of elongation with replicates of each kinetic time point.
To ensure that each aggregate type is efficiently sticking to the well, we conducted a preliminary experiment in which the supernatant from the aggregate adhesion step, plus well washes, were analyzed. Thus, the dried aggregate wells were washed three times with PBS, incubated 1 hr in PBS, then washed two more times with PBS. These washes were pooled and lyophilized, then 100% formic acid was added. After a brief incubation, water was added to make a final 20% formic acid mix and the sample was vortexed and injected into HPLC. Any monomer peaks observed could then be integrated to determine (from the standard curve [9]) the amount and concentration of monomer. For all aggregates of httNTQ20P10K2, we determined that our adherence conditions led to no detectable recovered peptide in the washes, and therefore essentially 100% adherence of the aggregates to the plastic. It is important to do this determination, since otherwise it would impossible to rigorously interpret a low observed elongation rate.
The wells were washed and blocked with 1% bovine serum albumin for 1 hr and washed with 100 μl of PBS. The elongation reaction was initiated by adding 100 μl of a 100 nM solution of biotinylated-Q29 peptide at 37 °C. In order to obtain a kinetic profile of elongation, different columns of the well were initiated at different times; wells not yet receiving biotinyl-Q29 contained PBS during the 37 ºC incubations in between initiations of different rows at different times. In this manner, after the last, brief, incubation to obtain the earliest time point, and after addition of biotinyl-Q29 to obtain a zero time point, the entire plate was emptied and given multiple washes. To the empty wells was added 100 μl of a 1:1,000 dilution of a europium-streptavidin (Wallac/Perkin-Elmer) reagent, and this was incubated 1 hr in the dark at RT. Wells were emptied and washed, then 100 μl of the Enhancement Solution (Wallac/Perkin Elmer) as added, and the wells incubated for 15 mins at RT. The plate was read at the europium fluorescence setting in a Victor2 fluorescence plate reader (Wallac/Perkin Elmer) and the fluorescence counts obtained, then converted to femtomoles of europium based on a standard curve. Knowledge of the number of Eu atoms per streptavidin tetramer, along with the assumptions that (a) each biotin is sterically available to bind streptavidin, and (b) that each streptavidin tetramer binds to only one biotin, allowed calculation of the number of biotinyl-polyQ peptides immobilized per well. While flaws in these assumptions will affect the absolute values of the determined elongation rates, they are unlikely to affect the relative elongation rates of different aggregates. For further details, see references 23–25.
The time course of fmols of peptide bound for equal deposited weights of different aggregates is shown in Figure 4. Using this data, elongation rates of fmol/hr were calculated for each aggregate type. We conducted and compared two ways of analyzing the data. In the first, we calculated the rate of the initial, very rapid binding step, which we interpret to be equivalent to the “docking” step of the dock-and-lock mechanism of fibril elongation [27, 29]; these rates are shown in the solid bars in Fig. 4B. We also calculated the steady state rates from the more shallow progressions swept out in the later time points in Figure 4A; these, shown in the open bars of Fig. 4B, we interpret to indicate the rate of the rate-limiting “locking” step of the dock-and-lock mechanism, whose completion results in the generation of a new docking site. Both rates calculations show the same trend of much faster rates stimulated by aggregates isolated after several days of the spontaneous aggregation reaction. We interpret this to indicate an amyloid-like, seeding competence in the later developing aggregates that is not present in early aggregates [11, 28]. In Figure 4, reactivity drops somewhat for older aggregates. This may indicate some masking of growth points due to aggregate clumping.
Figure 4.

Time course of incorporation of biotinyl-Q29 by various aggregated states of httNTQ20P10 using a microtiter plate based elongation assay. (A) Time course of biotinyl-Q29 attachment to aggregate containing plastic wells. Equal weights of aggregates isolated at 18 hrs (◇), 42 hrs (△), 120 hrs (□), 186 hrs (○), and 700 hrs (●) were affixed to wells. (B) Rates of biotinyl-Q29 incorporation for the initial, burst phase (solid bars) and second, steady-state phase (open bars).
3.5 Other methods of characterizing isolated aggregates
Although not discussed here in detail, there are other methods of analyzing isolated aggregates that can help give information about aggregation intermediates. Hydrogen-deuterium exchange monitored by mass-spectrometry can be a powerful tool for characterizing the β-sheet content of aggregates [30]. Using this method we have been able to demonstrate that protofibrils formed in the early stages of Aβ fibril assembly have a number of higher protected H-bonds suggesting a very stable β-sheet; these appear to be a subset of the H-bonds formed in the mature fibrils [16]. Although the material and analysis requirements can be prohibitive, Fourier transform infrared (FTIR) spectrometry can sometimes give important information on the secondary structure within fibrils. Recently we used FTIR to infer a role for a highly α-helical oligomeric intermediate in the aggregation of htt N-terminal fragments (M. Jayaraman and R. Wetzel, unpublished).
4. Aggregation kinetics analysis
Quantitative analysis of protein aggregation kinetics, to provide data of sufficient quality to support fitting to kinetics models, is simple conceptually but technically challenging. We have taken the approach of developing robust methods to monitor changes in monomer concentration as aggregation proceeds. Previously we reported useful methods for preparation of aggregate-free monomers and the use of analytical HPLC analysis of the centrifugation supernatants to monitor the disappearance of monomers [9]. These methods unveiled two broad classes of nucleation of polyglutamine amyloid formation: (a) a classical model involving transient, reversible formation of a nucleus from the monomer pool that, without further modifications, is competent to support elongation [31], and (b) a model characteristic of many amyloid systems [32, 33] that features an initial, kinetically downhill, aggregation of a small portion of the monomer pool to form a non-amyloid oligomer, followed by stochastic rearrangement within these oligomers to an elongation competent amyloid-like fibril [11]. The first mechanism applies to simple polyQ sequences, either unbroken [31] or containing point substitutions within the polyQ segment [34, 35], as well as to polyQ containing some flanking sequences [10]. The second mechanism applies to polyQ attached either to certain globular protein domains [28, 36] or to the httNT sequence from huntingtin [11].
Recently we had occasion to examine the aggregation behavior of a relatively short polyQ peptide, K2Q23K2, and this work led to some modifications of our normal protocols which may prove of some general use. We found that aggregation reactions of this peptide in the concentration range of 1– 50 μM, where we previously observed useful kinetic rates for longer polyQ sequences, proceeded extremely slowly, and in fact do not produce aggregation to a detectable extent even after weeks of incubation at 37 ºC in PBS [37]. While a pilot experiment showed that measureable aggregation occurs in solutions of several hundred μM of K2Q23K2, conducting a full concentration dependent aggregation kinetics study in the 100 μM to 700 μM concentration range under these conditions would have required 20–30 milligrams of purified peptide. The modification described below allowed us to obtain quality data at high concentrations while using modest amounts of peptide.
4.1 Acquiring sedimentation assay data at high peptide concentrations
Our normal protocol for the sedimentation assay involves removing a 100 μl aliquot from the ongoing aggregation reaction, centrifuging, and carefully removing the top 75 μl of the supernatant for HPLC analysis [9]. Even though a 7.5 μl aliquot of a 500 μM reaction would contain the same amount of peptide as 75 μl of a 50 μM reaction, and hence be easily detectable in analytical HPLC, we had concerns about being able to withdraw 7.5 μl from a 10 μl total volume after centrifugation, without disturbing the pellet and hence potentially obtaining erroneous data. To solve this problem, we instituted a 1−>5 dilution step before centrifugation, assuming that there would be negligible dissociation of aggregates at this lower concentration during the centrifugation time. This revised protocol gave excellent results that fit the kinetic model very well. To ensure that dissociation of aggregates was not occurring during the revised protocol, we analyzed a reaction by both the standard and the dilution method, and the kinetics curves were in excellent agreement (Figure 5). The dilution protocol is described below.
Figure 5.

Comparison of sample workup methods for sedimentation analysis of polyQ aggregation. Spontaneous aggregation at 37 ºC in PBS, pH 7.3 of a K2Q23K2 peptide at ~155 μM monitored with (open circle) or without (solid square) an intermediate dilution step built into the kinetics analysis protocol (see text).
A PBS solution of freshly disaggregated (see Section 4.2) 100 μM – 700 μM K2Q23K2 was incubated at 37 ºC. Aliquots were removed periodically for the sedimentation assay. For the dilution protocol, an aliquot of approximately 10 μl was removed using a calibrated micropipette, and delivered into a tared Eppendorf tube. The tube was then reweighed to yield the mg of added liquid, and hence very accurately the μl of aliquot delivered. An amount of PBS buffer was added to effect a 1−>5 dilution of the reaction aliquot and generate a final volume of ~ 50 μl. This was mixed, then centrifuged and the supernatant removed, and a measured aliquot analyzed as in the normal procedure [9]. From the mass of polyQ peptide obtained and the volume of the measured aliquot analyzed, the concentration of K2Q23K2 monomer in the diluted sample was determined, then multiplied times 5 to yield the concentration of monomer in the original time point. Replicate analysis of time points using this protocol gave very good agreement, and the overall kinetics curve obtained (Figure 5) was in close agreement with the data obtained from the same, on-going reaction analyzed by the published [9] protocol. Using this method a considerable amount of peptide was spared, while obtaining excellent data sets.
Besides allowing efficient use of potentially costly peptides, when incubation at high concentration is required, the above dilution method might also be used to confidently examine earlier time points in aggregation kinetics. We have never seen any evidence for significant distortions of the values of early time points due to the centrifugation time required for analysis. This might be due in part to our use of a 4 ºC refrigerated Eppendorf centrifuge, as well as to a conservative approach of only examining time points that are significantly longer than the centrifugation time. Where it is required that time points be taken within the first 60 mins, however, and where there is concern that the 4 ºC temperature might not sufficiently slow the ongoing aggregation reaction, subjecting the reaction to an immediate five-fold dilution should provide a substantial quenching of the aggregation rate.
4.2 Thioflavin T binding and fluorescence
One important quantity that helps considerably in characterizing differences in aggregates along the reaction coordinate is thioflavin T (ThT) fluorescence. Because of its simplicity, ThT binding is a popular technique for analyzing amyloid formation reactions [38]. While the molecular basis of ThT binding to fibrils remains poorly understood, progress is being made [39] and there remains a general consensus in the field that ThT is a reagent that detects β-sheets in aggregates (while exhibiting no ability to bind to β-sheet in globular proteins). We have found that different aggregates of the same protein [11, 25, 35], including different polymorphic amyloid fibrils of the same protein [40], exhibit quite different sensitivities to ThT. This can be evaluated in two ways. In the first, one calculates a ThT fluorescence yield that can be compared with that of other aggregates by measuring the fluorescence under an arbitrary, standard set of conditions, including a defined mass of aggregate added to the cuvette [40].
In the second, ThT fluorescence is converted to “% aggregation” by equating a late reaction ThT value with the corresponding percent aggregation value determined by the sedimentation assay, then calculating the % reaction of all earlier ThT values based on that defined equality. This provides a convenient visual portrayal of the degree to which the two measures overlap. Since late reaction time points of amyloid assembly reactions measured by ThT often decay, presumably due to steric blocking of binding sites due to aggregate clustering, it is important to pick a ThT value at or near its maximum as the defined point of equivalence. The use of this visual method to evaluate assembly mechanisms can be seen in Figure 6, a comparison of the aggregate assembly reactions for two polyQ sequences. As we reported previously for the aggregation of simple polyQ sequences [31], the percent reaction curves for K2Q30K2 as determined by the sedimentation assay (Fig. 6, ○) and the ThT assay (Fig. 6, ●) are equivalent. We interpret this as evidence that there are no non-amyloid intermediates populated in the early stage (or, indeed, at any stage) of the K2Q30K2 reaction. In contrast, the peptide K2Q15HQHQ15K2, a sequence similar to sequences found in the expanded CAG disease protein ataxin-1 [35], exhibits quite different progress curves under the same conditions. Specifically, the early aggregates detectable by the sedimentation assay (Fig. 6, □) exhibit little or no ThT fluorescence (Fig. 6, ■), suggesting that they are non-amyloid in character. Similar ThT-negative aggregates are formed early in the aggregation reactions of httNT-containing polyQ peptides [11] and in the aggregation of Aβ peptides [25]. Interestingly, this ThT-negative intermediate does not seem to be involved when K2Q15HQHQ15K2 aggregates at higher pH values [35], suggesting a pH-dependent shift in the aggregation mechanism.
Figure 6.

Comparison of reaction progress by sedimentation and ThT assays for two polyglutamine peptides. ThT fluorescence values (filled symbols) were normalized as described in the text. Sedimentation assay data (open symbols) using HPLC to monitor centrifugation supernatants [9]. Aggregation carried out in phosphate buffered saline adjusted to pH 6.0 and including 0.05% sodium azide at 37 ºC with either K2Q30K2 (●, ○) or K2Q15HQHQ15K2 (■, □). Data from reference 35.
4.3 Other methods of characterizing ongoing aggregation reactions
There are other spectrophotometric methods for evaluating on-going aggregation reactions that can sometimes give useful information. We have used circular dichroism to monitor the aggregation of a simple polyQ peptide and found a dramatic coil to sheet transition [31]. This simple monotonic transition suggests the absence of aggregation intermediates. In addition, calculation of the percent aggregation for each time point, based on time-dependent changes in the CD, generates an aggregation curve that overlaps the sedimentation and ThT curves [31]. Thus, if there is a non-amyloid intermediate in the aggregation of simple polyQ, it would have to be a β-sheet-rich non-amyloid aggregate. Unfortunately, CD analysis of aggregates is often compromised by the high degree of light scattering in the sample. Fortunately, amyloid-like polyQ aggregates tend to give relatively low scattering, perhaps because of a low tendency to form large super-aggregates, in contrast to many other amyloids.
Another method that is quite sensitive to aggregate formation in dynamic light scattering (DLS). We are using DLS to confirm the absence of aggregates in starting stocks of monomeric peptide, and also to test for the presence of aggregates during the aggregation lag phase and to characterize any aggregates formed. Unfortunately DLS quickly breaks down at later stages of aggregation due to high particle sizes and the complexity of the aggregate mix. The ability of very large aggregates to compromise size determination of smaller aggregates might be dealt with by removing the larger aggregates by centrifugation, allowing insight into at least a subpopulation of the reaction mixture. Perhaps the best use of this technique is to investigate the very early stages of aggregation. For example, we are able to identify and characterize oligomers formed during the early stages of the aggregation of httNT-containing polyQ peptides and Aβ peptides, and are also able to demonstrate the absence of significant amounts of aggregate during the early phases of simple polyQ aggregation reactions [37].
5. Applications
The vast majority of spontaneous amyloid growth reactions in vitro feature initial formation of oligomeric structures, followed by development of short, curvilinear protofibrils, before the formation of long, twisted, relatively straight amyloid fibrils. While the temporal relationships between these structures are clear, the mechanistic relationships are not. Some of these prefibrillar forms may be required on-pathway intermediates, while others may be formed in side reactions, off-pathway to the central amyloid formation pathway [33]. Sorting out the roles of these intermediates is just as challenging as ascribing on- or off-pathway roles to protein folding intermediates.
In our studies of the aggregation of huntingtin N-terminal fragments, we were able to better define the natures of different aggregated structures that appear along the reaction coordinate by using a series of assays that focus on the properties of the aggregates. The results provide suggestive data that the earliest formed aggregates isolatable by centrifugal sedimentation do play an on-pathway role. The earliest aggregates, isolated within the first few hours of httNTQ20P10K2 aggregation, exhibit features that are not associated with amyloid structure: (a) relatively low ThT signals relative to sedimentation assay (Section 4.2); (b) spherical morphology in EM (Section 2.2); (c) poor ability to serve as templates for seeding monomer elongation in the microplate assay (Section 3.4); (d) solvent exposure of Trp residues in the httNT segment (Section 3.1); (e) exposure of the polyQ tract to a polyQ antibody in dot blot assays (Section 3.3); (f) a very low concentration dependence of initial rates, atypical of simple polyQ peptides [9, 11]. The structural basis of this initial oligomer formation appears to be the packing of the N-terminal httNT segment into the oligomer core, given the resistance of this part of the molecule to trypsin on limited proteolysis of isolated aggregates (Section 3.2), in contrast to the accessibility of the polyQ in these aggregates to an anti-polyQ antibody (Section 3.3). Later in the aggregation reaction profile, many of these features change: (a) weight normalized ThT signals rise; (b) aggregates become elongated fibrils; (c) aggregates take on enhanced abilities to seed monomer elongation; (d) Trp residues at positions 11 or 17 of the httNT segment become solvent inaccessible; (e) the polyQ segments become antibody inaccessible. Significantly, all of these transformations occur in the same time frame, just as the overall rate of aggregation is undergoing a large enhancement. The large rate enhancement is consistent with the occurrence of an amyloid nucleation process, and the coincidence of the above structural transformations with this nucleation suggests that structural transformations being observed within the oligomers are somehow associated with the nucleation process. This leads to a model in which the high local concentration of polyQ elements brought together in solution by the formation of the httNT-mediated oligomers facilitates the nucleation of a polyQ-core amyloid fibril, which can then grow by monomer addition. The availability of the techniques described here not only make possible this initial analysis of the aggregation process, but also provides a means for future studies on the mechanistic roles of changes in the system, such as the ability of point mutations within the httNT segment to eradicate the HD phenotype in transgenic mouse models [3].
In contrast to htt N-terminal fragments and many other amyloidogenic peptides, simple polyQ peptides flanked by solubilizing Lys residues undergo a classical nucleated growth polymerization mechanism that involves formation of a thermodynamically unfavorable nucleus in a pre-equilibrium with monomers [31, 41, 42]. This behavior is of some importance to biology, since, while some flanking domains of the polyQ sequence in human disease proteins can act like the httNT segment of htt to significantly alter the aggregation mechanism [36], flanking sequences from other disease proteins [37], as well as a proline-rich domain located adjacent to the polyQ sequence [10], do not appear to do this. Because it does not appear to involve non-amyloid intermediates, it might appear that the nucleation mechanism for simple polyQ aggregation should itself be relatively simple to analyze. However, because of the intrinsic challenges in proving a negative – in this case the absence of non-amyloid intermediates, studying simple polyQ behavior requires its own set of methodological improvements. Some of the methods described here have contributed evidence against non-amyloid intermediates in simple polyQ aggregation. For example, EM (Section 2.2) shows that the earliest formed aggregates are already amyloid-like, and ThT (Section 4.2) and CD (Section 4.3) progress curves superimpose on the HPLC sedimentation progress curve [31], suggesting the absence of non-amyloid assembly intermediates. Description of other techniques can be found in our recent description of the nucleated growth polymerization mechanism for aggregation of K2Q23K2 and other relatively short polyQ peptides [37]. We include in this paper a description of the adjustments to the sedimentation assay necessitated by the requirement for unusually high concentrations to trigger aggregation by K2Q23K2 and other short polyQ sequences.
Finally, it is now clear that some peptides, such as polyQ-containing htt N-terminal fragments, can aggregate by both of the above pathways, with the relative rates of each dependent on solution conditions (M. Jayaraman et al., Ms. submitted). While analysis of such competing aggregation reactions is especially challenging, techniques described here can be of significant help in identifying and characterizing these underlying mechanisms.
6. Conclusions
While protein aggregates historically have been viewed as being amorphous, uninteresting, and unimportant, it is now appreciated that this aggregation is a natural consequence of the polymeric nature of proteins [43], and that the process and products of aggregation are of interest from many points of view – being aspects of the fundamental protein folding landscape, polymer chemistry and physics, and both normal and abnormal cell biology. Studying this process even in simple buffer systems requires as much or more care as the biophysical study of other biomolecular transformations. Providing this care can be deceptively difficult, involving protocols that are conceptually simple, yet not always simple in practice. For example, the quality of starting materials is paramount, yet it is easy to miss small contaminants that can bias the resulting aggregation process.
There are many useful methods available for studying aggregation. Some of these methods may appear to be quite rigorous and sophisticated, yet can suffer serious limitations when used in attempts to map the full scale of an aggregation reaction. In contrast, some conceptually and experimentally simple procedures can provide key information that is not otherwise available. As in any experimental science, there is discriminating analytical power in rolling out a battery of complementary tests and demanding that their results yield a self-consistent story. Developing such methodologies and the strategies for using them for the analysis of pathological protein aggregation reactions is an ongoing evolutionary process that is far from complete. It is hoped that this chapter contributes some incremental advances.
Acknowledgments
We acknowledge funding support from NIH grants R01 AG019322 and R21 AG033757, and thank Drs. James Conway and Alexander Makhov for help and access to the Structural Biology Department’s cryo-EM facility.
Footnotes
Publisher's Disclaimer: This is a PDF file of an unedited manuscript that has been accepted for publication. As a service to our customers we are providing this early version of the manuscript. The manuscript will undergo copyediting, typesetting, and review of the resulting proof before it is published in its final citable form. Please note that during the production process errors may be discovered which could affect the content, and all legal disclaimers that apply to the journal pertain.
References
- 1.Martin JB. N Engl J Med. 1999;340:1970–1980. doi: 10.1056/NEJM199906243402507. [DOI] [PubMed] [Google Scholar]
- 2.David DC, Ollikainen N, Trinidad JC, Cary MP, Burlingame AL, Kenyon C. PLoS Biol. 2010;8 doi: 10.1371/journal.pbio.1000450. [DOI] [PMC free article] [PubMed] [Google Scholar]
- 3.Gu X, Greiner ER, Mishra R, Kodali R, Osmand A, Finkbeiner S, Steffan JS, Thompson LM, Wetzel R, Yang XW. Neuron. 2009;64:828–840. doi: 10.1016/j.neuron.2009.11.020. [DOI] [PMC free article] [PubMed] [Google Scholar]
- 4.Chen S, Berthelier V, Yang W, Wetzel R. J Mol Biol. 2001;311:173–182. doi: 10.1006/jmbi.2001.4850. [DOI] [PubMed] [Google Scholar]
- 5.Morley JF, Brignull HR, Weyers JJ, Morimoto RI. Proc Natl Acad Sci U S A. 2002;99:10417–10422. doi: 10.1073/pnas.152161099. [DOI] [PMC free article] [PubMed] [Google Scholar]
- 6.Bates GP, Benn C. In: Huntington's Disease. Bates GP, Harper PS, Jones L, editors. Oxford University Press; Oxford, U.K: 2002. pp. 429–472. [Google Scholar]
- 7.Chen S, Wetzel R. Protein Science. 2001;10:887–891. doi: 10.1110/ps.42301. [DOI] [PMC free article] [PubMed] [Google Scholar]
- 8.Wetzel R. In: The Protein Folding Handbook. Buchner J, Kiefhaber T, editors. Part II. Wiley-VCH; Weinheim: 2005. pp. 1170–1214. [Google Scholar]
- 9.O'Nuallain B, Thakur AK, Williams AD, Bhattacharyya AM, Chen S, Thiagarajan G, Wetzel R. Methods Enzymol. 2006;413:34–74. doi: 10.1016/S0076-6879(06)13003-7. [DOI] [PubMed] [Google Scholar]
- 10.Bhattacharyya A, Thakur AK, Chellgren VM, Thiagarajan G, Williams AD, Chellgren BW, Creamer TP, Wetzel R. J Mol Biol. 2006;355:524–535. doi: 10.1016/j.jmb.2005.10.053. [DOI] [PubMed] [Google Scholar]
- 11.Thakur AK, Jayaraman M, Mishra R, Thakur M, Chellgren VM, Byeon IJ, Anjum DH, Kodali R, Creamer TP, Conway JF, Gronenborn AM, Wetzel R. Nat Struct Mol Biol. 2009;16:380–389. doi: 10.1038/nsmb.1570. [DOI] [PMC free article] [PubMed] [Google Scholar]
- 12.Chen S, Berthelier V, Hamilton JB, O'Nuallain B, Wetzel R. Biochemistry. 2002;41:7391–7399. doi: 10.1021/bi011772q. [DOI] [PubMed] [Google Scholar]
- 13.Lakowicz JR. Principles of Fluoresence Spectroscopy. 3. Kluwer; New York: 2006. [Google Scholar]
- 14.Bolton DC, McKinley MP, Prusiner SB. Science. 1982;218:1309–1311. doi: 10.1126/science.6815801. [DOI] [PubMed] [Google Scholar]
- 15.Kheterpal I, Williams A, Murphy C, Bledsoe B, Wetzel R. Biochem. 2001;40:11757–11767. doi: 10.1021/bi010805z. [DOI] [PubMed] [Google Scholar]
- 16.Kheterpal I, Chen M, Cook KD, Wetzel R. J Mol Biol. 2006;361:785–795. doi: 10.1016/j.jmb.2006.06.066. [DOI] [PubMed] [Google Scholar]
- 17.van der Wel PC, Lewandowski JR, Griffin RG. J Am Chem Soc. 2007;129:5117–5130. doi: 10.1021/ja068633m. [DOI] [PubMed] [Google Scholar]
- 18.Whittemore NA, Mishra R, Kheterpal I, Williams AD, Wetzel R, Serpersu EH. Biochemistry. 2005;44:4434–4441. doi: 10.1021/bi048292u. [DOI] [PubMed] [Google Scholar]
- 19.Ko J, Ou S, Patterson PH. Brain Res Bull. 2001;56:319–329. doi: 10.1016/s0361-9230(01)00599-8. [DOI] [PubMed] [Google Scholar]
- 20.Li P, Huey-Tubman KE, Gao T, Li X, West AP, Jr, Bennett MJ, Bjorkman PJ. Nat Struct Mol Biol. 2007;14:381–387. doi: 10.1038/nsmb1234. [DOI] [PubMed] [Google Scholar]
- 21.Bennett MJ, Huey-Tubman KE, Herr AB, West AP, Ross SA, Bjorkman PJ. Proc Natl Acad Sci U S A. 2002;99:11634–11639. doi: 10.1073/pnas.182393899. [DOI] [PMC free article] [PubMed] [Google Scholar]
- 22.Trottier Y, Lutz Y, Stevanin G, Imbert G, Devys D, Cancel G, Saudou F, Weber C, David G, Tora L, et al. Nature. 1995;378:403–406. doi: 10.1038/378403a0. [DOI] [PubMed] [Google Scholar]
- 23.Berthelier V, Hamilton JB, Chen S, Wetzel R. Anal Biochem. 2001;295:227–236. doi: 10.1006/abio.2001.5217. [DOI] [PubMed] [Google Scholar]
- 24.Berthelier V, Wetzel R. Methods Enzymol. 2006;413:313–325. doi: 10.1016/S0076-6879(06)13016-5. [DOI] [PubMed] [Google Scholar]
- 25.Williams AD, Sega M, Chen M, Kheterpal I, Geva M, Berthelier V, Kaleta DT, Cook KD, Wetzel R. Proc Natl Acad Sci U S A. 2005;102:7115–7120. doi: 10.1073/pnas.0408582102. [DOI] [PMC free article] [PubMed] [Google Scholar]
- 26.Bertoncini CW, Jung YS, Fernandez CO, Hoyer W, Griesinger C, Jovin TM, Zweckstetter M. Proc Natl Acad Sci U S A. 2005;102:1430–1435. doi: 10.1073/pnas.0407146102. [DOI] [PMC free article] [PubMed] [Google Scholar]
- 27.Esler WP, Stimson ER, Jennings JM, Vinters HV, Ghilardi JR, Lee JP, Mantyh PW, Maggio JE. Biochemistry. 2000;39:6288–6295. doi: 10.1021/bi992933h. [DOI] [PubMed] [Google Scholar]
- 28.Ignatova Z, Thakur AK, Wetzel R, Gierasch LM. J Biol Chem. 2007;282:36736–36743. doi: 10.1074/jbc.M703682200. [DOI] [PMC free article] [PubMed] [Google Scholar]
- 29.Cannon MJ, Williams AD, Wetzel R, Myszka DG. Anal Biochem. 2004;328:67–75. doi: 10.1016/j.ab.2004.01.014. [DOI] [PubMed] [Google Scholar]
- 30.Kheterpal I, Wetzel R. Acc Chem Res. 2006;39:584–593. doi: 10.1021/ar050057w. [DOI] [PubMed] [Google Scholar]
- 31.Chen S, Ferrone F, Wetzel R. Proc Natl Acad Sci USA. 2002;99:11884–11889. doi: 10.1073/pnas.182276099. [DOI] [PMC free article] [PubMed] [Google Scholar]
- 32.Serio TR, Cashikar AG, Kowal AS, Sawicki GJ, Moslehi JJ, Serpell L, Arnsdorf MF, Lindquist SL. Science. 2000;289:1317–1321. doi: 10.1126/science.289.5483.1317. [DOI] [PubMed] [Google Scholar]
- 33.Kodali R, Wetzel R. Curr Opin Struct Biol. 2007;17:48–57. doi: 10.1016/j.sbi.2007.01.007. [DOI] [PubMed] [Google Scholar]
- 34.Thakur A, Wetzel R. Proc Natl Acad Sci U S A. 2002;99:17014–17019. doi: 10.1073/pnas.252523899. [DOI] [PMC free article] [PubMed] [Google Scholar]
- 35.Jayaraman M, Kodali R, Wetzel R. Protein Eng Des Sel. 2009;22:469–478. doi: 10.1093/protein/gzp023. [DOI] [PMC free article] [PubMed] [Google Scholar]
- 36.Ellisdon AM, Thomas B, Bottomley SP. J Biol Chem. 2006;281:16888–16896. doi: 10.1074/jbc.M601470200. [DOI] [PubMed] [Google Scholar]
- 37.Kar K, Jayaraman M, Sahoo B, Kodali R, Wetzel R. Nature Str Mol Biol. 2011 doi: 10.1038/nsmb.1992. in press. [DOI] [PMC free article] [PubMed] [Google Scholar]
- 38.LeVine H. Meth Enzymol. 1999;309:274–284. doi: 10.1016/s0076-6879(99)09020-5. [DOI] [PubMed] [Google Scholar]
- 39.Biancalana M, Koide S. Biochim Biophys Acta. 2010;1804:1405–1412. doi: 10.1016/j.bbapap.2010.04.001. [DOI] [PMC free article] [PubMed] [Google Scholar]
- 40.Kodali R, Williams AD, Chemuru S, Wetzel R. J Mol Biol. 2010;401:503–517. doi: 10.1016/j.jmb.2010.06.023. [DOI] [PMC free article] [PubMed] [Google Scholar]
- 41.Bhattacharyya AM, Thakur AK, Wetzel R. Proc Natl Acad Sci U S A. 2005;102:15400–15405. doi: 10.1073/pnas.0501651102. [DOI] [PMC free article] [PubMed] [Google Scholar]
- 42.Slepko N, Bhattacharyya AM, Jackson GR, Steffan JS, Marsh JL, Thompson LM, Wetzel R. Proc Natl Acad Sci U S A. 2006;103:14367–14372. doi: 10.1073/pnas.0602348103. [DOI] [PMC free article] [PubMed] [Google Scholar]
- 43.Wetzel R, Shivaprasad S, Williams AD. Biochemistry. 2007;46:1–10. doi: 10.1021/bi0620959. [DOI] [PMC free article] [PubMed] [Google Scholar]