Abstract
Recently, a number of ternary phase diagrams of lipid mixtures have been constructed using various experimental techniques with a common goal of understanding the nature of lipid domains. An accurate experimental phase diagram can provide rich thermodynamic information, and can also be used to extract molecular interactions using computer simulation. In this study, the liquid-ordered and liquid-disordered (lo-ld) phase boundary of DSPC/DOPC/Cholesterol ternary mixtures is simulated in a lattice model using pairwise interactions. The block composition distribution (BCD) technique was used to accurately locate the compositions of coexisting phases and thermodynamics tie-lines in the 2-phase region, and the Binder ratio method was used to determine the phase boundary in the critical region. In simulations performed along a thermodynamic tie-line, the BCD method correctly samples the compositions as well as the relative amounts of coexisting phases, in excellent agreement with the Lever Rule. A “best-fit” phase boundary was obtained that has a top boundary closely resembling the experimental boundary. However, the width of the simulated 2-phase region is significantly wider than the experimental one. The results show that pairwise interactions alone are not sufficient to describe the complexity of molecular interactions in the ternary lipid mixtures; more complex forms of interactions, possibly multibody interaction or domain interfacial energy, should be included in the simulation.
Keywords: Monte Carlo simulation, phase separation, Lever Rule, lipid bilayer, Binder ratio, canonical ensemble
Introduction
Lipid rafts are cell membrane domains that are rich in cholesterol, certain high melting-temperature lipids, and certain membrane proteins. In model membranes, ternary lipid mixtures are a minimal system to model biomembrane rafts. In order to understand the biochemical and thermodynamic properties of lipid raft domains, a number of phase diagrams of ternary lipid mixtures have been constructed in recent years using various experimental techniques.1-4 Typically, the mixtures consist of three components: cholesterol, a high melting-temperature lipid (such as sphingomyelin, 1,2-palmitoyl-sn-glycero-3-phosphocholine (DPPC), or 1,2-distearoyl-sn-glycero-3-phosphocholine (DSPC)), and a low melting-temperature lipid (such as 1,2-oleoyl-sn-glycero-3-phosphocholine (DOPC)). A phase diagram of multi-component lipid mixtures can provide rich thermodynamic information about the mixtures5. An experimental phase diagram with accurately determined phase boundaries and tie-lines could also be extremely valuable for extracting molecular interactions between lipids using computer simulation or mean-field calculation 6-8. For a given set of hypothesized molecular interaction energies, the corresponding theoretical phase diagram can be generated through computer simulation. An experimental phase diagram provides strong constraints on the possible molecular interactions. Simulation of a phase boundary can greatly narrow down both the possible types of molecular interaction, as well as the possible magnitudes of interactions. Simulation of the experimental phase boundary can help researchers to understand the key interactions between membrane molecules or even the driving force of lipid raft formation. In addition, computer simulation would allow researchers to conveniently visualize lipid domains, phases, and interfaces, in various length and time scales.
The ternary phase diagram of DSPC/DOPC/cholesterol has been recently constructed using confocal fluorescence microscopy, fluorescence resonance energy transfer (FRET), single probe fluorescence spectroscopy, electron spin resonance (ESR), and wide angle X-ray diffraction techniques.1,4 The phase diagram has numerous interesting properties, but the region of biological importance is the coexisting region of liquid-ordered (lo) and liquid disordered (ld) phases. In this study, the lo-ld phase boundary in DSPC/DOPC/Cholesterol ternary mixtures is simulated in a lattice model using pairwise interactions. The block composition distribution (BCD) technique was used to effectively locate coexisting phases and thermodynamics tie-lines in the 2-phase region and the Binder ratio method9-12 was used to accurately determine the phase boundary in the critical region. We found both that the BCD method can correctly estimate the amounts of coexisting phases, and also that the Lever Rule is followed in simulations performed along a thermodynamic tie-line. A “best-fit” phase boundary was obtained, and the top boundary closely resembles the experimental boundary. However, the width of the simulated 2-phase region is wider than the experimental one: the compositions of simulated coexisting phases cannot be exactly correct. Therefore, we have found that pairwise interactions alone are not sufficient to describe the complexity of molecular interaction in the ternary lipid mixtures, and other forms of interactions, possibly multibody interaction or domain interfacial energy, should be included in the simulation.
Simulation Methods
A lipid bilayer is modeled as a 2D triangular lattice. A phospholipid is treated as physically linked dimer chains occupying two adjacent sites.13,14 A cholesterol molecule will only occupy one site due to its small cross-sectional area.7 The lipid composition of a ternary mixture is specified by two parameters: χC and R: χC is the mole fraction of cholesterol and R is the ratio of DSPC to all PC, defined as R = DSPC/(DSPC+DOPC). In order to reduce simulation size effects, a large lattice size (300×300) was used for all simulations. The number of lipid molecules in a 300×300 simulation lattice is approximately equal to the number of lipid molecules in one leaflet of a 0.1 μm diameter large unilamellar vesicle (LUV). Simulations were performed in the canonical ensemble using the Metropolis method.15 The standard periodical boundary condition was used. As illustrated in Fig. 1, three types of particle moves were implemented: (A) nearest-neighbor dimer pair rotation, first introduced by Jerala et al.;13 (B) long-range dimer-dimer exchange, in which two pairs of linked PC chains over any distance exchange positions; and (C) nearest-neighbor cholesterol-dimer flipping, in which a cholesterol and a pair of linked PC chains exchange positions. The long-range dimer-dimer exchange is very efficient to bring simulations to equilibrium.16 Without it, a simulation containing coexisting phases can be trapped at a local free energy minimum almost indefinitely. Most of the simulations started from an initial configuration in which molecules of the same kind were placed together as big blocks (“the block state”). Equilibrium was checked by monitoring the convergence of system parameters when parallel simulations were started from two very different initial configurations: the block state and a random mixing state. This long-range particle exchange is not a physical process, since lipids in a real bilayer cannot jump over a long distance. However, a relaxation method in MC simulation is not required to be physical: as long as the method can bring the system to equilibrium and can sample the phase-space effectively, the equilibrium thermodynamic properties of the mixture can be correctly simulated. A Monte Carlo (MC) step is defined as going over every lattice site one time in a random sequence to make the possible dimer pair rotation and dimer-dimer exchange moves. To compensate for the lack of long-range exchange for cholesterol, cholesterol-dimer flipping was performed 6 times more often than the other two moves. The typical equilibration time was between 10,000 to 30,000 MC steps; equilibrium statistical data were computed during 80,000 – 500,000 MC steps after equilibrium was reached.
Figure 1.
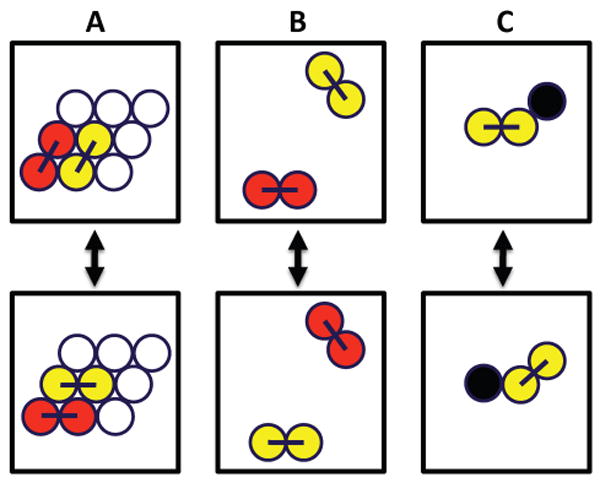
Three types of particle moves are used in simulations. A phospholipid is treated as physically linked dimer chains occupying two adjacent sites, and a cholesterol molecule occupies one site. DSPC acyl chains: red; DOPC acyl chains: yellow; cholesterol: black. (A) Nearest-neighbor dimer pair rotation; (B) long-range dimer-dimer exchange; and (C) nearest-neighbor cholesterol-dimer flipping.
Pairwise interaction Hamiltonian
The pairwise Hamiltonian that accounts for acyl chain-acyl chain, cholesterol-cholesterol and cholesterol-acyl chain interactions is given by
| Eq. 1 |
Where EOO, ESS, and ECC are pairwise interaction energies between DOPC acyl chains, between DSPC acyl chains, and between cholesterols, respectively. LOi, LSi, and LCi are occupation variables (= 0 or 1) of DOPC acyl chains, DSPC acyl chains, and cholesterols, respectively. The summation i is over all lattice sites, and j is over the nearest-neighbor sites of i only. Z (= 6) is the number of nearest-neighbors to a lattice site. ΔEOS, ΔEOC, and ΔESC are the pairwise excess mixing energies between DOPC and DSPC acyl chains, between DOPC acyl chains and cholesterol, and between DSPC acyl chains and cholesterol, respectively, which are defined as
| Eq. 2 |
where EOS, EOC, and ESC are pairwise interaction energies between DOPC and DSPC acyl chains, between DOPC acyl chains and cholesterol, and between DSPC acyl chains and cholesterol, respectively. The first 3 terms in Hamiltonian Eq. 1 are constants, independent of lipid lateral distribution. Lipid mixture behavior is entirely determined by values of the 3 excess mixing energies. Previously, the chemical activity of cholesterol in PC lipid bilayers has been measured experimentally.17 The analysis of the data indicates that the mixing of cholesterol with PC is overall energetically favorable, and cholesterol prefers PCs with saturated chains over PCs with unsaturated chains.18 Large negative values were chosen for ΔEOC and ΔESC in this study to express the favorableness. Also, cholesterol should prefer DSPC over DOPC due to the cis double bonds in DOPC chains, and this preference is expressed by assigning ΔESC < ΔEOC. On the other hand, ΔEOS has a large positive value, because the mixing of DOPC with DSPC is unfavorable, and this is the driving force of the lo-ld phase separation. A negative value of ΔEOS would not be consistent with the experimental phase diagram, because the ternary mixtures would not have a phase separation at all.
The Block Composition Distribution (BCD) Method
The BCD method has been widely used to determine the compositions of coexisting phases in canonical ensemble simulations.9-12 The essential feature of the BCD method is to systematically “scan” each equilibrium lateral lipid distribution by moving a square “phase mask”. The local lipid composition within the phase mask centered at every lattice site is recorded, and a local composition histogram for the whole mixture is generated at every 20 MC steps after equilibrium. The method gives a very straightforward visual approach to determine the number of phases of a simulated mixture: If a mixture only has one phase, then the local composition histogram should only have one large peak centered at the bulk (overall) composition of the mixture; If a mixture has two coexisting phases, the local composition histogram should have two large peaks, each centered at the composition of a coexisting phase. These two local compositions are two points on a phase boundary that separates a 1-phase region from a 2-phase region. Furthermore, a straight line connecting these two points in a phase diagram is the thermodynamic tie-line. Programming for the BCD method is quite simple, because it does not require any changes to the canonical ensemble simulation. The size of the “phase-mask” is an important issue for the method to work properly. In the Results section, we show that a proper phase-mask size can be chosen through a set of simulations.
The Binder ratio
With various simulation techniques, including the grand canonical ensemble or the Gibbs ensemble,19,20 the BCD method becomes ineffective in the critical region, since critical fluctuations become significant and the compositions of coexisting phases become too close to be resolved. It is well known that the critical temperature is a function of the simulation size. In the critical region, even a large size simulation could suffer from this effect. The Binder ratio method is convenient to obtain the true critical temperature or phase boundary, based on the techniques of finite-size scaling. Previously, the method has been used by Yethiraj and Weisshaar to find the critical temperature in a binary lipid mixture simulation.21 The Binder ratio is a fourth-order cumulant of the order parameter, defined as B(L)= 1- <m(L)4>/(3<m(L)2>2), where L is the linear size of “phase mask” and m(L) is the order parameter.10,12 At the true critical temperature, the Binder ratio is independent of the system size. Since the coexisting phases in our system primarily differ in the R value (R = DSPC/(DSPC+DOPC), we define the order parameter as m(L) = R(L)-R(bulk). The order parameter m(L) ≈ 0 for 1-phase mixtures. For 2-phase mixtures, m(L) > 0 in the lo phase and m(L) < 0 in the ld phase, because the local concentration of DSPC is higher or lower than its bulk concentration in the lo phase or in the ld phase, respectively.
Pair correlation function and correlation length
The pair correlation function between two types of particles (A and B) at a given distance r in a mixture is defined as:
| Eq. 3 |
where NAB(r) is the average number of occurrences in which type A particle is located at a distance r from a type B particle. By definition, gAB(r) = 1 for an ideal mixture. For a nonideal mixture, gAB(r) > 1 for small r if type A and type B particles attract to each other, and gAB(r) < 1 if two particles repel each other. For convenience, the functions were only evaluated along the three symmetrical axes of the triangular lattice.
Pair correlation length, ξ, is an indicative parameter that can be used to describe domain formation or phase separation in a mixture. In a phase separated mixture, certain correlation lengths become very long, as certain particles are more concentrated in a particular phase. On the other hand, in a 1-phase mixture, correlation lengths are typically quite short, reflecting the sizes of nonideal mixing clusters or domains. In this study, ξ is defined as the largest distance r at which
| Eq. 4 |
where gAB(max) is the maximum deviation of gAB(r) from the ideal mixing value of 1, which usually occurs at one or two lattice spacings. Also, in order to distinguish two opposite types of deviation from ideal mixing, ξ is assigned as a negative number if type A and type B molecules repel each other, and ξ is assigned as a positive number when type A and type B molecules attract. Pair correlation functions were calculated at every 20 MC steps after equilibrium.
Results and Discussion
Mapping a phase boundary by the BCD method
Our goal is to find a set of pairwise interaction parameters (ΔEOS, ΔEOC, ΔESC) that can closely reproduce the experimental lo-ld phase boundary of DSPC/DOPC/cholesterol mixtures. First, an initial set of interaction parameters was chosen, and the BCD method was used to partially map out the corresponding phase boundary. The simulated boundary was then compared to the experimental boundary, and the interaction parameters were adjusted for a better fit. We found that the location of the phase boundary at the center of the phase diagram is largely determined by the value of ΔEOS: An increase of the value moves the boundary to a higher cholesterol mole fraction. On the other hand, the slope of the phase boundary at center as well as the slopes of tie-lines are sensitive to the values of ΔEOC and ΔESC. For example, a larger negative value of ΔESC would move the right side of phase boundary higher. After testing several dozen parameter sets, parameters were narrowed down to a small range. Then Binder ratio method was used to find the true critical temperature. We found that the “best-fit” interaction parameter set was (ΔEOS=0.54 kT, ΔEOC=-1.0 kT, ΔESC=-1.3 kT). The simulation lattice size and the phase-mask size used were 300×300 and 25×25, respectively.
Fig. 2 shows a series of snapshots of lipid lateral distributions simulated with (ΔEOS=0.54 kT, ΔEOC=-1.0 kT, ΔESC=-1.3 kT). The R value for all snapshots is 0.5. At lower cholesterol concentration χC ≤ 0.36, the mixtures clearly have two coexisting phases: a liquid-ordered phase (red) that is rich in DSPC and cholesterol, and a liquid-disordered phase (yellow) that is rich in DOPC (Fig. 2 A & B). At χC = 0.40, the mixture is at the phase boundary (Fig. 2C). When χC > 0.40, mixtures have only one phase. However, large clusters of lipids are still visible at χC = 0.42 (Fig. 2D), with the clustering becoming somewhat smaller at χC = 0.48 (Fig. 2E). For comparison, Fig. 2F is a snapshot of ideal (i.e., random) mixing at χC = 0.48. Even with random mixing, small clusters of like molecules already exist; however, the cluster sizes are smaller than those in Fig. 2E. Note that due to figure space limitations, the snapshots in Fig. 2 were generated using a small simulation size, 150×150. With our standard size of 300×300, the sizes of coexisting phases in our simulations actually are somewhat larger than shown in Fig. 2A & 2B. In general, the sizes of coexisting phases in a 2-phase region always increase with the simulation lattice size, whereas the size of lipid clusters in 1-phase regions becomes independent of the simulation lattice size if the lattice is sufficiently large. Figure 2 also demonstrates that it is often difficult to tell the number of phases or the lipid compositions of coexisting phases in a simulated snapshot through visual inspection. The BCD method is a systematic way to determine these properties.
Figure 2.
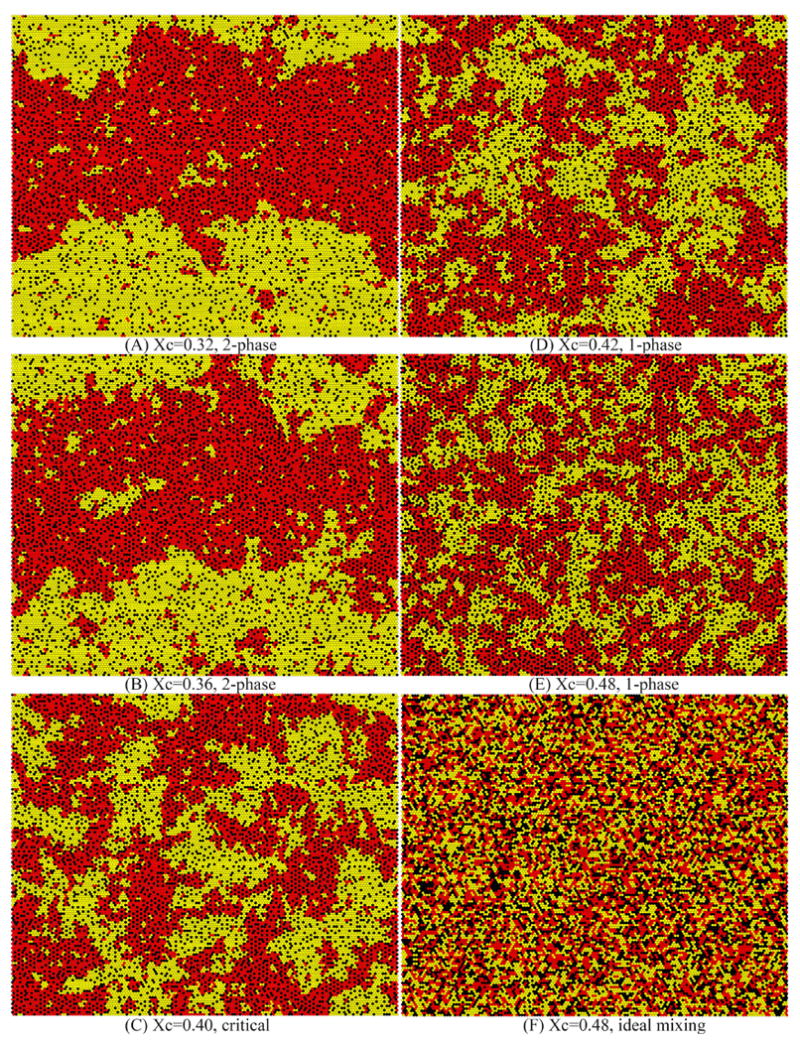
Snapshots of lateral lipid distributions for some DSPC/DOPC/cholesterol mixtures simulated with pairwise interaction energies (ΔEOS=0.54 kT, ΔEOC=-1.0 kT, ΔESC=-1.3) reveals phase separations and the range of cluster sizes. Black dots, cholesterol; Yellow dots, DOPC acyl chains; Red dots, DSPC acyl chains. Two chains from the same PC were physically linked. All mixtures have the same R ratio (i.e., DSPC/(DSPC+DOPC)) of 0.5, but different cholesterol mole fraction χC. (A) and (B) are 2-phase mixtures, (D) and (E) are 1-phase mixtures, and (C) is a mixture at the phase boundary. (F) is an ideal (random) mixing distribution at χC = 0.48.
For a mixture with coexisting phases, the system tends to form large size phases in order to reduce interfaces. In Fig. 2A & 2B, large horizontal band-like structures are quite noticeable: The band-like cluster topology is a result of using the rectangular periodical boundary condition in a simulation containing multiple phases, as discussed by Sugar in an earlier study.22 Near the critical region, where the interfacial energy is low, the orientation of the band-like cluster topology continuously changes during a long simulation. Away from the critical region, the band-like structure becomes more stable. It is interesting to notice that the actual boundary condition for liposomes is a spherical periodical boundary condition, not a rectangular one; “half-moon” shaped domains are often observed in giant unilamellar vesicles (GUV), as vesicles tend to minimize the interface separating phases.4
After the simulations reached equilibrium, the average local composition histograms were computed using the BCD method. Fig. 3 shows the resulting 3D histograms for the five ternary mixtures shown in Fig. 2. The two “horizontal” axes are local R value and local χC, representing the local lipid composition evaluated within the phase mask. The vertical axis is the number of sites having a particular local lipid composition (local R, local χC). For the mixture with bulk (overall) cholesterol mole fraction of 0.32, the local composition histogram shows two well separated sharp peaks, corresponding to the two coexisting phases with very different lipid compositions (see Fig. 2A). There is a small “ridge” connecting the two peaks, which arises from the interface area between coexisting phases. For the mixture with overall χC of 0.36, the local composition histogram also has two peaks. However, the peaks are broader and the distance between peaks is shorter, indicating that the difference in lipid composition between the two phases becomes smaller (see Fig. 2B). In addition, the “ridge” grows taller, caused by the increased contribution from interfacial area. The mixture with overall χC of 0.40 is essentially on the phase boundary: In its composition histogram, one can no longer distinguish peaks or ridge. The mixture with overall χC of 0.42 is a 1-phase mixture, but very close to the phase boundary. Its composition histogram shows a single broad peak; the broadness indicating a highly nonideal 1-phase mixture with significant clustering of molecules (see Fig. 2D). Finally, the mixture with overall χC of 0.48 is a 1-phase mixture, away from the phase boundary. The corresponding histogram has a single taller and narrower peak. This mixture is more ideal, with less clustering than that at χC 0.42 (see Fig. 2E).
Figure 3.
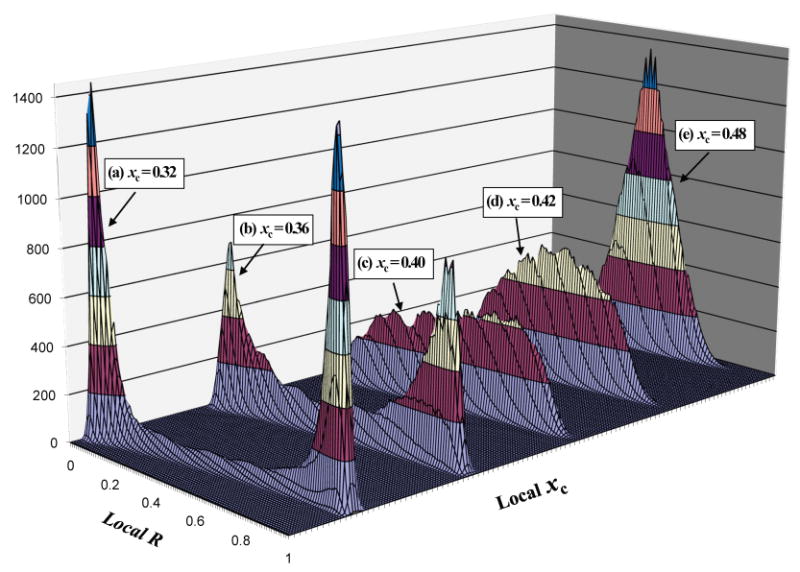
Local composition histograms for the five mixtures in Fig. 2 reveals coexisting phases. A local lipid composition is specified by local R ratio and local χC. The vertical axis is the number of the lattice sites having a particular local lipid composition. Some histograms have been shifted in local χC axis to facilitate viewing. χC is the bulk (overall) cholesterol mole fraction of a simulated mixture.
The center of mass (COM) of each peak is used to identify the composition of the phase using the following procedures: (i) The maximum height of a peak (hmax) is determined; (ii) Any grid point surrounding the peak with a height lower than 2/3 of hmax is set to zero. This effectively removes the contribution from the interfacial area; (iii) The COM of the other peak is calculated using χC(COM) = ΣχC(i)h(i) / Σh(i) and R(COM) = ΣR(i)h(i) / Σh(i), where h(i) is the height of the histogram at the composition i. After the compositions of the two coexisting phases are determined, the straight line connecting these two compositions on the triangular phase diagram is the thermodynamic tie-line. Thus, each simulation in the 2-phase region can provide two points on the phase boundary as well as a thermodynamic tie-line.9 In order to map out the phase boundary, a series of simulations is performed, usually starting near the middle of the 2-phase region, and crossing the phase boundary into the 1-phase region through small increments of cholesterol mole faction (typically 1 mol %). The boundary points obtained were connected together to form a phase boundary. Fig. 4 is the simulated phase diagram constructed using the BCD method. The simulations were performed with the bulk lipid composition marked as filled triangles (σ) in Fig. 4. The left phase boundary points obtained by the BCD method were plotted as open circles (μ), and the right boundary points were plotted as open squares (θ). The dashed lines connecting two boundary points obtained from the same simulation are thermodynamic tie-lines. In Fig. 4, the triangle labeled with letter “a” represents the mixture with bulk χC = 0.32 and R = 0.5; Its lateral distribution snapshot is shown in Fig. 2A and its local composition histogram is shown in Fig. 3A. Similarly, the triangle labeled with letter “b” represents the mixture with bulk χC = 0.36 and R = 0.5; Its lateral distribution snapshot is shown in Fig. 2B and its local composition histogram is shown in Fig. 3B. The thin solid line is the simulated phase boundary corresponding to the “best-fit” interaction parameter set (ΔEOS=0.54 kT, ΔEOC=-1.0 kT, ΔESC=-1.3 kT), and the thick solid line is the experimental phase boundary.
Figure 4.
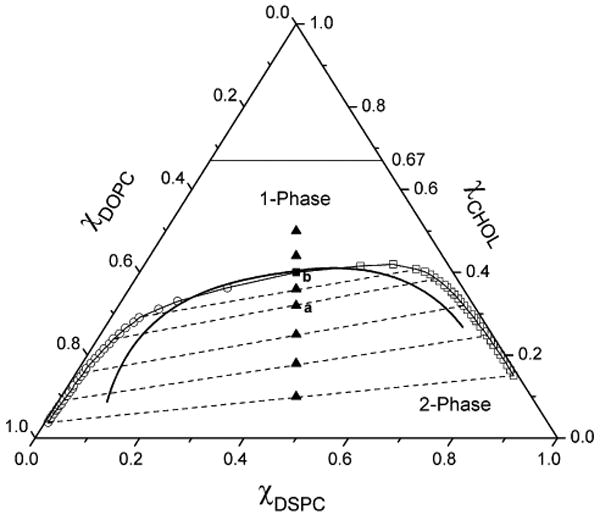
The upper boundary of phase coexistence of lo + ld is shown on the ternary phase diagram of DSPC/DOPC/cholesterol simulated with pairwise interaction energies (ΔEOS=0.54 kT, ΔEOC=-1.0 kT, ΔESC=-1.3). Open circles and open squares are boundary points obtained by the BCD method. Dashed lines are simulated thermodynamic tie-lines. The filled square is the boundary point obtained from Binder ratio method. The thin solid line is the phase boundary determined using the BCD method and the Binder ratio method together. The thick solid line is the experimental phase boundary.4 Filled triangles represent overall (bulk) lipid compositions at which simulations with the BCD method were performed. Filled triangles labeled as “a” and “b” indicate the overall lipid compositions of the mixtures “a” and “b” in Fig. 2 and Fig. 3.
Phase boundary in the critical region
As shown in Fig. 3C, near the critical region, it is very difficult to judge whether a mixture has one or two phases from the local composition histogram. In order to overcome the difficulty, we used the well-established Binder ratio method to accurately determine the phase boundary in the critical region. The experimental phase boundary passes through the lipid composition (χC = 0.40, R = 0.5) (Fig. 4). Using the BCD method, the range of pairwise interaction parameters was first narrowed down to (ΔEOS = 0.51-0.55 kT, ΔEOC =-1.0 kT, ΔESC= -1.3 kT). The Binder ratio method was then used to find the value of ΔEOS (equivalently, the true critical temperature) that produces a boundary passing through (χC = 0.40, R = 0.5). Fig. 5 shows the Binder ratio as a function of ΔEOS calculated using three different sizes of phase mask: 91×91, 121×121, and 141×141. The simulations were carried out at the fixed bulk lipid composition (χC = 0.40, R = 0.5), and with two fixed interaction parameters (ΔEOC = -1.0 kT, ΔESC = -1.3 kT), since the top boundary is most sensitive to the values of ΔEOS. For ΔEOS ≥ 0.55 kT, the Binder ratio has a strong phase mask size dependence: the Binder ratio is higher with a smaller mask size. For ΔEOS ≤ 0.53 kT, the size dependency is reversed: Binder ratio is lower with a smaller mask size. The crossover occurs at ΔEOS = 0.54 kT, at which the Binder ratio becomes independent of system size, and the true critical temperature is found. Thus, the interaction energy set (ΔEOS= 0.54 kT, ΔEOC =-1.0 kT, ΔESC= -1.3 kT) produces a phase boundary passing through the lipid composition (χC = 0.40, R = 0.5), which is represented by the filled square (ν) in Fig. 4. Together with the boundary points determined by the BCD method, the entire phase boundary was obtained. Calculation of Binder ratio requires long simulations: 500,000 MC steps were used for each data point in Fig. 5.
Figure 5.
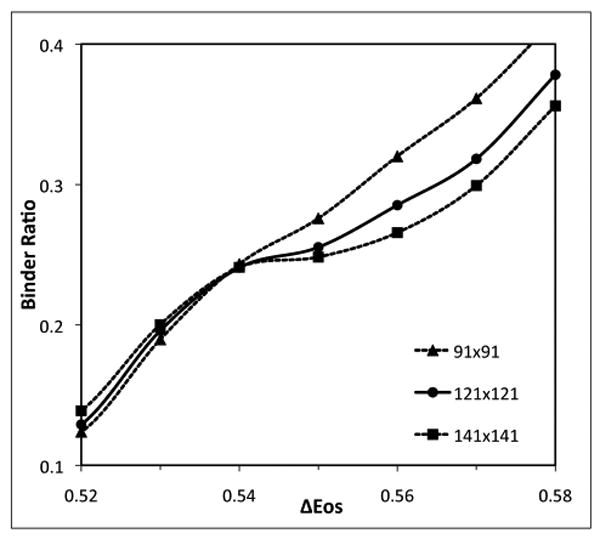
The Binder ratio as a function of ΔEOS calculated using phase mask size of 91×91, 121×121, and 141×141 at the bulk composition of R=0.5 and χC=0.40. The crossover occurs at ΔEOS≅ 0.54 kT, at which the Binder ratio becomes independent of system size.
The Binder ratio method can accurately determine the phase boundary in the critical region. Away from the critical region, the BCD method works very efficiently. Therefore, the BCD method and the Binder ratio method are complementary. Using the two methods together, an entire phase boundary can be determined. Note that in the process of searching for a set of molecular interaction energies that could closely reproduce an experimental phase boundary, one only needs to perform the Binder ratio method for the final few promising sets of parameters. In most cases, a boundary produced by the BCD method alone can give a good representation of the shape and location of the simulated boundary, and adjustment of interaction energy parameters can be made based on such a boundary.
Pair-correlation functions and lengths
Fig. 6a shows six pair-correlation functions for a 2-phase mixture with the bulk lipid composition R = 0.5 and χC = 0.36 (see Fig. 2B). DSPC and cholesterol are more concentrated in the liquid-ordered phase, and DOPC is more concentrated in the liquid-disordered phase. As expected, the DSPC-DSPC pair-correlation function and DOPC-DOPC pair-correlation function are both well above the ideal mixing value of 1 over a very long distance. On the other hand, due to the physical separation of DOPC and DSPC, the DOPC-DSPC pair-correlation function is well below the ideal mixing value of 1 over a long distance. The correlation length is measured in units of lattice spacing, i.e., the distance between two adjacent sites. The calculated correlation lengths for these functions are very long and are only limited by the size of the simulation lattice. Thus, these long correlation lengths signify a 2-phase mixture. The actual values of the correlation lengths in a 2-phase region are not meaningful if they are longer than about half of the simulation box dimension, since the sizes of coexisting phases are limited by the size of the simulation lattice. However, the correlation lengths in 1-phase regions are determined by nonideal mixing, and directly reflect the equilibrium average cluster size of molecules. If the simulation lattice is sufficiently large, the correlation lengths in 1-phase regions do not depend on the size of the simulation lattice. Fig. 6b shows the correlation lengths as a function of χC for mixtures with the bulk R value of 0.5. For χC < 0.35, four pair-correlation lengths (DOPC-DOPC, DSPC-DSPC, DOPC-DSPC, and DOPC-Chol) are longer than 150 lattice distance (i.e., more than ½ of the simulation lattice dimension). Clearly, these mixtures are in a 2-phase region. Between 0.37 and 0.40 of χC is the boundary region: all four correlation lengths show drops in magnitude in this narrow region. For χC > 0.40, correlation lengths slowly decrease as χC increases, and all correlation lengths become less than 10 lattice distances; clearly, this is a 1-phase region.
Figure 6.
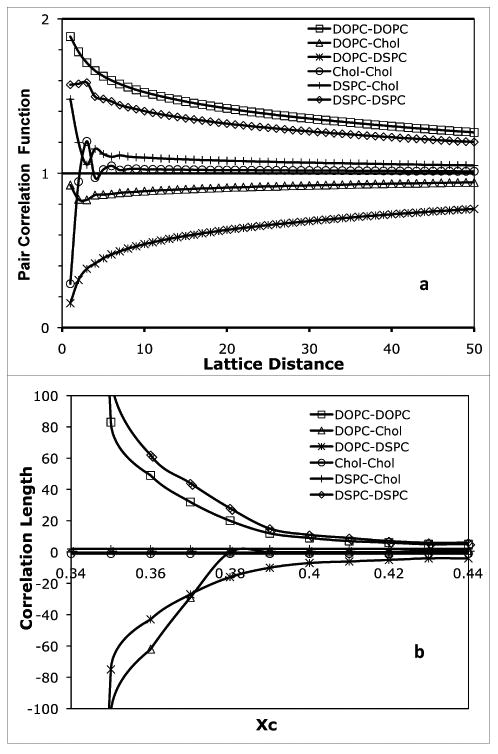
(a) Pair-correlation functions for the 2-phase ternary lipid mixture with R = 0.5 and χC = 0.36. (b) Pair-correlation lengths as a function of χC for mixtures with constant R ratio of 0.5. The phase boundary is at χC = 0.40.
Effect of phase mask size
If the size of phase mask were too small, the method would misinterpret the mere clustering of molecules in a 1-phase region due to nonideal mixing as distinct phases. On the other hand, if the mask size were too big, it would not be able to detect compositionally distinct large regions (i.e., separated phases) in a simulation. Thus, the size of the phase mask should be larger than the size of clusters (or pair-correlation lengths) in a 1-phase region, but be significantly smaller than the size of individual phases in a 2-phase region, which is related to the size of the simulation lattice. Therefore, a proper size for the phase mask can be selected through simulation. Figure 7 shows the effects of phase mask size on phase boundary determination. The phase boundaries of the ternary mixtures were simulated with (ΔEOS=0.53 kT, ΔEOC=-1.0kT, ΔESC=-1.3 kT). The simulation lattice size was fixed at 300×300, and only the size of the phase mask was changed. As shown in Fig. 7, when the size of the phase mask was too small, such as 9×9, 13×13, and 17×17, the resulting phase boundaries were noisy and sensitive to the size of the phase mask used. This result is consistent with the fact that the largest pair-correlation length in the 1-phase region is about 15 lattice spacings (Fig. 6B). However, when the size of the phase mask is larger than 21×21, the boundary becomes smooth and stable. The boundaries obtained using phase mask size of 25×25 or 29×29 were very similar. It has been shown that further increase of mask size reduces the sharpness of the peaks and the sensitivity of the method, but the positions of the peaks remain the same.12 For DSPC/DOPC/cholesterol mixtures, we chose 25×25 as our standard phase mask size and 300×300 as the simulation lattice size.
Figure 7.
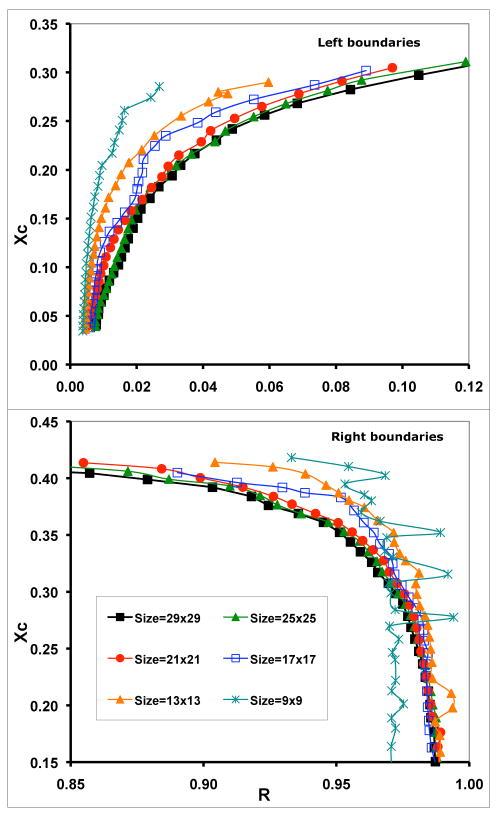
Simulated left and right phase boundaries using the BCD method with different sizes of phase-mask. Simulation lattice size was fixed at 300×300.
Pairwise interactions are insufficient
The “best-fit” pairwise interaction parameters were found to be (ΔEOS=0.54 kT, ΔEOC=-1.0kT, ΔESC=-1.3 kT). The positive ΔEOS represents the unfavorable interaction between DSPC and DOPC. The location of the top phase boundary is very sensitive to the value of ΔEOS: An increase of ΔEOS moves the top boundary to a higher cholesterol mole fraction. The entire 2-phase region would disappear if ΔEOS is less than ∼0.3 kT. The magnitude of unfavorable interaction between DSPC and DOPC, 0.54 kT or 320 cal/mol, is similar to the magnitudes of pairwise interactions found in other lattice model MC simulations.6 The negative ΔEOC and ΔESC represent the favorable DOPC-cholesterol and DSPC-cholesterol interactions, respectively. The difference between these two values largely determines the slope of the top boundary. The fitted values indicate that cholesterol more favorably interacts with DSPC than with DOPC. Previously, a series of jumps in chemical activity of cholesterol was observed in DOPC/cholesterol and DPPC/cholesterol binary mixtures, indicating that the favorable interactions are quite large.17,18
As shown in Fig. 4, the “best-fit” 2-phase region simulated using pairwise interactions is significantly wider than the experimental phase boundary. Thus, the compositions of coexisting phases are incorrect. For example, the experimental ld phase contains roughly 10 mole % of DSPC, while the simulated ld phase only has about 1-3 mole %. After testing several dozen sets of energy parameters, we found that as long as the top boundary is located around χC = 0.4, the simulated 2-phase region is always significantly wider than the experimental one. This is an intrinsic property of pairwise interactions and the problem cannot be fixed by adjusting energy parameters. Our result clearly shows that some other interactions must play important roles in producing lo-ld phase separation in DSPC/DOPC/cholesterol ternary mixtures, and these interactions should be included in simulations. Previously, it has been shown that the measured maximum solubility of cholesterol in lipid bilayers and the chemical activity of cholesterol in PC bilayers cannot be modeled by pairwise interactions alone, and some forms of multibody interactions are necessary.7,17,18,23 Here we see another clear case where pairwise interactions are insufficient to describe lipid-lipid interactions. In previous studies, the molecular origin of the multibody interactions was identified as the requirement for large headgroup lipids (such as PC) to cover the hydrophobic bodies of cholesterol in a lipid bilayer, described by the Umbrella Model.7 It will be interesting to find out whether line tension or interfacial energy play significant roles in lo-ld phase separation in ternary lipid mixtures.
The effects of linking two acyl chains
In this study, a phospholipid is treated as physically linked dimer chains occupying two adjacent sites.13,14 Obviously, this treatment avoids many unrealistic distributions, such as a single acyl chain of DOPC completely surrounded by DSPC chains and cholesterol. In addition, the distributional entropy is more correctly accounted for. However, a more significant effect of the dimer treatment is that it alters the magnitudes of pairwise interaction energies. For example, without the dimer linkage, in order to generate a similar lo-ld phase boundary in our ternary system, the value of pairwise interaction energy ΔEOS would be ∼0.8 kT, instead of 0.54 kT (data not shown). Previously, Sugar systematically investigated the differences between the dimer model and the monomer model in binary lipid mixtures, and concluded that the pairwise interaction energies were considerably lower in the dimer model than in the corresponding monomer model.22 These results show that the magnitude of interaction energy in a simulation depends on the detailed model: whether a phospholipid is treated as a linked dimer, or two unlinked chains, or a particle occupying a single lattice site. Furthermore, the result indicates that the magnitude of interaction energy required to create a phase separation would become less, if some particles were physically linked together. This result can be used to explain some cross-linking experiments. For example, it has been reported that if the lipid GM1 is included in sphingomyelin/DOPC/cholesterol at as little as 0.5 mole % in a 1-phase mixture that is close to macroscopic phase separation of lo-ld phases, then crosslinking the GM1 into pentamers by means of cholera toxin B subunit induces the entire sample to phase separate.24
Importance of an accurately determined phase boundary
An accurately determined experimental phase diagram is extremely valuable for testing hypothesis and extracting molecular interactions. An experimental phase boundary, which includes the critical point, the compositions of coexisting phases, and thermodynamics tie-lines, provides strong constraints on the types and magnitude of molecular interactions that can be used in simulation. It is relatively easy to move the phase boundary to a single lipid composition point by adjusting interaction parameters; however, fitting the entire phase boundary is far more challenging, but also far more meaningful.
Testing of the Lever Rule
To test whether the BCD method is capable of quantitatively estimating the relative amount of coexisting phases, we performed a series of simulations along a thermodynamic tie-line, and compared the result with the Lever Rule. According to the Lever Rule, the compositions of two coexisting phases are fixed along a tie-line, and the relative amount of each phase can be calculated using x/(x+y) and y/(x+y), where x and y are the distances from a given point on a tie-line to the two end point.25 Fig. 8 (upper) shows the local composition histograms at five different points along a tie-line. Point a (χC = 0.174 and R = 0.022) and point e (χC = 0.294 and R = 0.973) are the left and right end-points of the tie-line, respectively. Therefore, each is a 1-phase mixture, and only a single peak is present in the composition histogram. Point b is located at ¼ of the distance along the tie-line from the left side, with the bulk composition in the 2-phase region. Its local composition histogram shows a large peak corresponding to the left end-point of the tie-line, and a small peak corresponding to the right end-point. Point c is the midpoint of the tie-line, and the heights of the two peaks appear to be very similar. Point d is located at ¼ of the tie-line length from the right side, and the peak corresponding to the right endpoint is significantly higher than that corresponding to the left end-point. Fig. 8 clearly shows that as the simulation moves along a tie-line, the compositions of the two coexisting phases (i.e., the center positions of the two peaks) are unchanged, while the magnitude of one peak decreases and the magnitude of other peak increases. It is also interesting that for 2-phase mixtures (b, c and d in Fig. 8), there is a ridge connecting two main peaks in the local composition histogram. No such ridge exists for 1-phase mixtures (a and e in Fig. 8). The ridge results from the interfacial area separating the two phases. In order to quantitatively test the Lever Rule, we had to remove the contribution from the interface area in the composition histograms, since the Lever Rule was derived with the assumption that the system is sufficiently large that the interface between two phases is negligible. First, we found the maximum height of the ridge, then the magnitude of any histogram grid was set to zero if the magnitude was less than the maximum ridge height. After this treatment, only two isolated peaks were left in the histograms. The total weight of each peak (Σh(i)) was then calculated. Fig. 8 (bottom) shows the relative weight fraction of each peak as the simulation moves from one end-point of the tie-line to the other end-point. The solid straight lines represent the expected result given by the Lever Rule, and symbols are the simulation results using the BCD method. Clearly, agreement is excellent.
Figure 8.
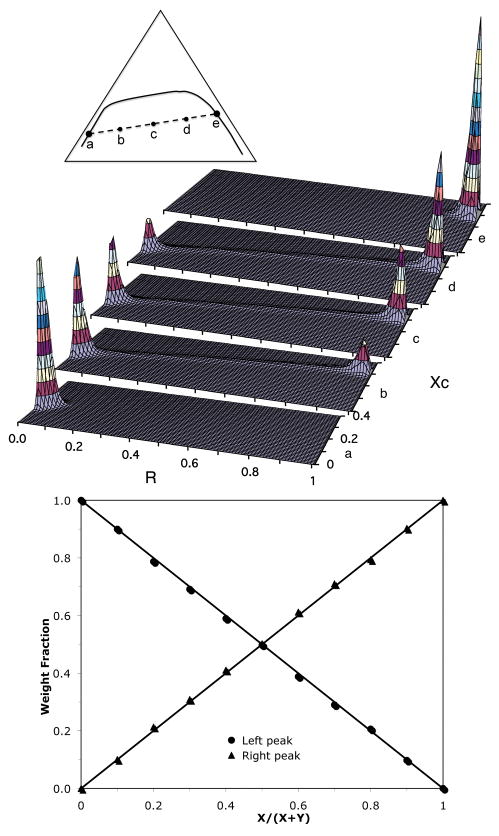
The BCD method is consistent with the Lever Rule. Upper: Local lipid composition histograms for five ternary lipid mixtures along a thermodynamic tie-line. The lipid compositions of the left and the right end-points of the tie-line are (R = 0.022, χC = 0.174) and (R = 0.973, χC = 0.294), respectively. Triangle inset: Schematic representation of a thermodynamic tie-line (dashed line) and a phase boundary (solid line). Points “a” to “e”, at which the simulations were performed, evenly divide the length of the tie-line. Bottom: The “weight” fractions of the left and right peaks in the local composition. The solid straight lines are the expected weight fractions according to the Lever Rule. X and Y are the distances from a given point on the tie-line to the two end-points.
The Lever Rule test is a strong test, further illustrating the capabilities of the BCD method: (i) The excellent agreement above indicates that the BCD method is capable of correctly determining the composition as well as the relative amount of each phase, as long as the two peaks are well separated; (ii) Typically, in order to map out a phase boundary, a series of simulations with the BCD method was performed crossing the middle of the phase diagram (i.e., R = 0.5), marked as the filled triangular points in Fig. 4. The advantage of this choice is that two peaks would have similar weights. We also tested the BCD method with some “off center” simulations, i.e., using R = 0.35 or 0.6, instead of 0.5. The phase boundaries obtained from these “off-center” simulations were essentially identical to the “on-center” simulations (data not shown). Our Lever Rule test naturally explained why the boundaries obtained were not sensitive to the choice of simulating composition; Finally, (iii) the results also indicate that true thermodynamic equilibrium was reached in all simulations, including those in the 2-phase region.
Summary
In this study, the lo-ld phase boundary in DSPC/DOPC/Cholesterol ternary mixtures is simulated using pairwise interactions. A “best-fit” phase boundary was obtained, and the top boundary closely resembles the experimental boundary. However, the width of the simulated 2-phase region is significantly wider than the experimental one. A very wide 2-phase region is an intrinsic property of pairwise interactions and the fitting cannot be improved by adjusting interaction parameters. Although pairwise interactions, as the simplest form of interactions, are often used in lipid bilayer simulations, our result clearly shows that pairwise interactions alone are not sufficient to describe the molecular interactions between lipids, and more complex forms of interactions, possibly multibody interaction or domain interfacial energy, should be included in the simulation.
We show that the BCD method and the Binder ratio method can be used in a canonical ensemble simulation to accurately produce the entire phase boundary. An important advantage of canonical ensemble simulation is that it can generate the entire lateral distribution of membrane molecules, which is very helpful for biomembrane research, since not only coexisting phases or domains, but also the interfacial area or critical fluctuations near critical points could have significant effects on membrane functions. The simulation techniques adopted in this study, together with an accurately determined experimental phase diagram, make possible to further refine the interaction model and uncover crucial molecular interactions in multi-component lipid mixtures.
Acknowledgments
This work was supported by the National Institute of Health grant 1 R01 GM077198-01A1 to GWF and JH (subaward 49238-8402) and National Science Foundation grant MCB-0344463 to JH.
References
- 1.Heberle FA, Wu J, Goh SL, Petruzielo RS, Feigenson GW. Biophys J. 2010;99:3309. doi: 10.1016/j.bpj.2010.09.064. [DOI] [PMC free article] [PubMed] [Google Scholar]
- 2.Smith AK, Freed JH. J Phys Chem B. 2009;113:3957. doi: 10.1021/jp808412x. [DOI] [PMC free article] [PubMed] [Google Scholar]
- 3.Veatch SL, Gawrisch K, Keller SL. Biophys J. 2006;90:4428. doi: 10.1529/biophysj.105.080283. [DOI] [PMC free article] [PubMed] [Google Scholar]
- 4.Zhao J, Wu J, Heberle FA, Mills TT, Klawitter P, Huang G, Costanza G, Feigenson GW. Biochim Biophys Acta. 2007;1768:2764. doi: 10.1016/j.bbamem.2007.07.008. [DOI] [PMC free article] [PubMed] [Google Scholar]
- 5.Feigenson GW. Biochim Biophys Acta. 2009;1788:47. doi: 10.1016/j.bbamem.2008.08.014. [DOI] [PMC free article] [PubMed] [Google Scholar]
- 6.Almeida PF. Biochim Biophys Acta. 2009;1788:72. doi: 10.1016/j.bbamem.2008.08.007. [DOI] [PubMed] [Google Scholar]
- 7.Huang J, Feigenson GW. Biophys J. 1999;76:2142. doi: 10.1016/S0006-3495(99)77369-8. [DOI] [PMC free article] [PubMed] [Google Scholar]
- 8.Putzel GG, Schick M. Biophys J. 2008;95:4756. doi: 10.1529/biophysj.108.136317. [DOI] [PMC free article] [PubMed] [Google Scholar]
- 9.Binder KZ. Phys B-Condens Mat. 1981;43:119. [Google Scholar]
- 10.Deutsch HP, Binder K. Macromolecules. 1992;25:6214. [Google Scholar]
- 11.Kaski K, Binder K, Gunton JD. Phys Rev B. 1984;29:3996. [Google Scholar]
- 12.Rovere M, Heermann DW, Binder K. J Phys-Condens Mat. 1990;2:7009. [Google Scholar]
- 13.Jerala R, Almeida PF, Biltonen RL. Biophys J. 1996;71:609. doi: 10.1016/S0006-3495(96)79261-5. [DOI] [PMC free article] [PubMed] [Google Scholar]
- 14.Sugar IP, Thompson TE, Biltonen RL. Biophys J. 1999;76:2099. doi: 10.1016/S0006-3495(99)77366-2. [DOI] [PMC free article] [PubMed] [Google Scholar]
- 15.Metropolis N, Rosenbluth AW, Rosenbluth MN, Teller A. J Chem Phys. 1953;21:1087. [Google Scholar]
- 16.Allen MP, Tildesley DJ. Computer Simulation of Liquids. Oxford University Press; Oxford: 1987. [Google Scholar]
- 17.Ali MR, Cheng KH, Huang J. Proc Natl Acad Sci U S A. 2007;104:5372. doi: 10.1073/pnas.0611450104. [DOI] [PMC free article] [PubMed] [Google Scholar]
- 18.Huang J. Methods Enzymol. 2009;455:329. doi: 10.1016/S0076-6879(08)04212-2. [DOI] [PMC free article] [PubMed] [Google Scholar]
- 19.Frenkel D, Smit B. Understanding Molecular Simulation: From Algorithms to Applications. 2nd. Academic Press; New York: 2002. [Google Scholar]
- 20.Shell MS, Panagiotopoulos AZ. In: In Free Energy Calculations: Theory and Applications in Chemistry and Biology. Chipot C, Pohorille A, editors. Springer; New York: 2007. p. 353. [Google Scholar]
- 21.Yethiraj A, Weisshaar JC. Biophys J. 2007;93:3113. doi: 10.1529/biophysj.106.101931. [DOI] [PMC free article] [PubMed] [Google Scholar]
- 22.Sugar IP. J Phys Chem B. 2008;112:11631. doi: 10.1021/jp800945j. [DOI] [PubMed] [Google Scholar]
- 23.Huang J, Buboltz JT, Feigenson GW. Biochim Biophys Acta. 1999;1417:89. doi: 10.1016/s0005-2736(98)00260-0. [DOI] [PubMed] [Google Scholar]
- 24.Hammond AT, Heberle FA, Baumgart T, Holowka D, Baird B, Feigenson GW. Proceedings of the National Academy of Sciences of the United States of America. 2005;102:6320. doi: 10.1073/pnas.0405654102. [DOI] [PMC free article] [PubMed] [Google Scholar]
- 25.Glasstone S. Physical Chemistry. D. Van Nostrand, Inc; New York: 1940. [Google Scholar]


