Sexually transmitted infections (STIs) tend to cluster in geographically definable core areas, or risk spaces.(1–15) These core areas are often located in low socioeconomic status (SES) urban neighborhoods,(4, 7, 9, 16, 17) suggesting that socio-cultural determinants of health may influence the clustered spatial pattern observed for STIs.
Several socio-cultural risk factors have been associated with gonorrhea in urban environments including individual level factors such as SES and community level (e.g. county or state) factors such as prevalence of infection,(18) % urbanicity,(19) neighborhood instability,(20) gender imbalance with more women than men, low social capital,(21, 22) and high % Black or Hispanic.(5, 23) For instance, low SES can impair timely access to STI services, thereby increasing the duration of infection and ultimately the prevalence of infection within a sexual network. Prevalence of an STI has a direct impact on the incidence of infection. As STI prevalence increases, the likelihood of finding a sexual partner that has an STI also increases. The power to negotiate the terms and conditions around sex is affected by both an imbalanced sex ratio, and the proportion of single parents in a community.(18) An imbalanced sex ratio with more women than men may increase the practice of high risk behaviors including unprotected sex and the exchange of sex for resources (money, food, shelter, father/mother figure, etc.).(24–26) The association between the spatial distribution of socio-cultural factors with the spatial pattern of STIs has been studied for urban environments, but not for rural environments.
Rurality may influence STI transmission through the low density and availability of partners within a sexual network, as well as the culture and social norms around sex and relationships within a community. Rurality may also act as a proxy for low physician density, poor access to STI health services, or community racial/ethnic homogeneity and hence, partner STI prevalence.
Race/ethnicity itself is not causally associated with STIs,(27) however, it can provide strong predictive power of STI risk.(28–33) For instance, in North Carolina, racial/ethnic differences in gonorrhea rates have persisted over time (18, 29) suggesting that race/ethnicity is a proxy for other STI risk factors. Possible explanatory factors include partner STI prevalence, assortative mixing, historic segregation, racism, unequal access to healthcare, or high incarceration rates.(18, 29, 32, 34)
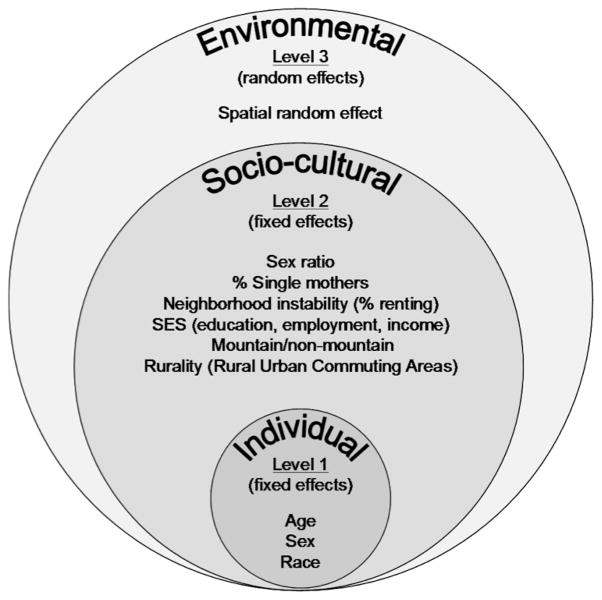
Our primary objective was to determine if the spatial pattern of gonorrhea observed for North Carolina (NC) was influenced by neighbourhood-level socio-cultural determinants of health (Figure 1). A secondary objective was to investigate the influence of race/ethnicity on the spatial pattern of gonorrhea, after accounting for known, measurable social factors.
Figure 1.
Conceptual model of the social and environmental factors thought to influence neighbourhood gonorrhea rates in North Carolina and how they were modeled in a generalized linear mixed model with spatial random effects.
METHODS
Gonorrhea and population data
In North Carolina, health care providers and laboratories are required to report suspected and newly identified cases of gonorrhea to the local health department. Basic demographic information is collected for each case on a case report card that is forwarded to the local health department, county health department, state health department, and finally to the Centers for Disease Control and Prevention. The North Carolina Department of Health and Human Services, Epidemiology Section, Branch of HIV/STD Prevention & Care, provided individual-level, de-identified and geomasked (35, 36) gonorrhea case data for this analysis. These data were aggregated by race/ethnicity, census tract, and three-month time intervals from January 1, 2005 to March 31, 2008.
Census tract level population estimates for the state of North Carolina were obtained from the US Census Bureau for the year 2000 and from the Environmental Systems Research Institute, Inc (Redlands, California) for the year 2007. A linear interpolation of population estimates from 2000 to a projected estimate for 2007 and an extrapolation to 2008 were used to approximate yearly underlying populations. Underlying population estimates were used as the offset during Poisson modeling.
Social determinants
Male-to-female sex-ratio (males/females; sex ratio), % female head of household with a child (single mother), and % renting were obtained at the neighborhood-level (census tract) for the year 2000 from the US Census Bureau. The relative rate was a linear function of the logged male-to-female sex-ratio with a change point at 1 (or 0 on the log scale) and constant after 2 males per female. The proportion of renters was used as an indication of neighborhood instability with the assumption that as this proportion increased, neighborhood instability also increases because of higher neighbor turnover and resulting lowered social capital. To construct an indicator for socioeconomic status (SES), we performed a principal components analysis of three census variables including % less than high school education, % with a household income less than $30,000 per year, and % unemployed. Only the first component was retained as a continuous indicator, which accounted for 66% of the total variation.
Rural Urban Commuting Areas
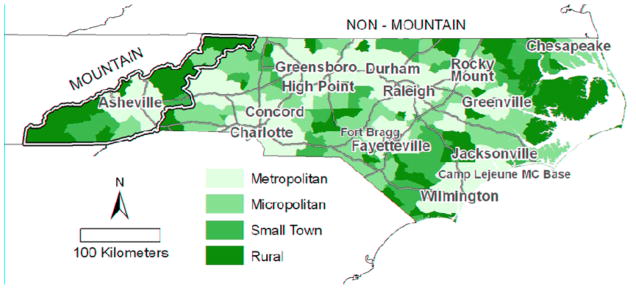
Rural Urban Commuting Areas (RUCAs) at the census tract level were used to define rurality.(37) RUCAs are separated into 10 primary and 30 secondary categories and classified according to population density, urbanization, as well as the % of residents that commute daily to an urban area. RUCAs were used as opposed to other classifications of rurality, such as % rural, because they account for daily commuting patterns, which may be an important factor when considering social and sexual networks. For the purpose of this analysis, RUCAs were grouped into four categories: metropolitan census tracts had more than 5% of the population commuting daily into an urbanized area (according to the US census bureau); micropolitan census tracts had more than 5% commuting into a large town; small town census tracts had more than 5% commuting into a small town; and rural census tracts had no primary flow (> 5%) into a urban core, large town, or small town (Figure 2a).{Hall, 2006 #480}
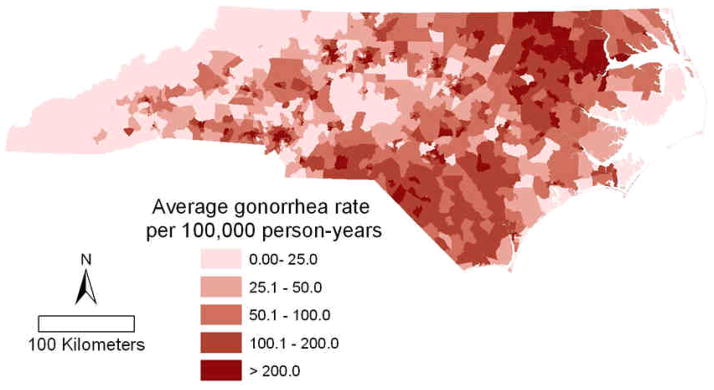
Figure 2.
(A) Average quarterly gonorrhea rate by census tract (neighborhood) for January 1, 2005 to March 31, 2008. (B) North Carolina census tracts by Rural Urban Commuting Area codes.(33) Major highways, cities, and military bases are indicated.
Mountain vs. non-mountain
Physiographically and socio-culturally, North Carolina can be divided into three regions: mountain in the west, Piedmont in the center, and coastal in the east. The mountain area of Western NC is known to have substantially lower gonorrhea rates than the rest of the state. NC was divided into the mountain region and non-mountain region for modeling purposes to avoid having the low rates in the mountains dominate the effect of rurality on gonorrhea rates for the entire state.
Statistical Analyses
Initially, the spatial distribution of gonorrhea was assessed qualitatively by visually interpreting and comparing maps of yearly, unadjusted gonorrhea rates, cumulative gonorrhea incidence, and socio-cultural factors mapped at the census tract level. Next, a three-level generalized linear mixed model with spatial random effects (38) was fit to quantify which social factors were associated with cumulative gonorrhea incidence and hence influenced the observed spatial pattern (Figure 1). Level 1 modeled the rate at which an individual contracts gonorrhea according to their age and sex and the rate for their race/ethnic group (Hispanic, Black, White, or American Indian) within their neighborhood. Level 2 modeled the relative rate for each race/ethnicity group within a neighborhood dependent on rurality (RUCA’s), mountain/non-mountain category, sex ratio, % renting, % single mothers, and SES. Interactions between rurality and race, as well as rurality and mountain/non-mountain region, were included. Level 3 modeled a neighborhood-level, spatially varying, random relative rate surface.(39)
Case age and gender were not available at the individual or census tract level because of concern that this information may breech confidentiality. Therefore, to adjust for age and gender, each individual’s rate was assumed to be proportional to the overall rate for their age, sex and ethnic group in North Carolina (averaged for 2005 to 2007) as obtained from the Center for Disease Control and Prevention. Each individual’s rate was modeled as the product of the average rate for their age/sex/ethnic group, a race-specific intercept term, the exponentiated sum of the fixed effects for levels 1 and 2 listed above, and the spatial relative rate surface.
Spatial variation in relative rate was modeled with a Besag, York and Mollie model,(39) where each census tract’s relative rate was log normally distributed and depended on the rate in adjacent census tracts.(38) This treatment of the overall rates for age, sex and ethnic group reduced the individual-level model described above to one where the case counts for each ethnic group in each census tract was modeled as Poisson distributed with an offset parameter related to these average rates and the population. Model fitting was done using Bayesian inference with the software WinBUGS and the glmmBUGS package in the statistical software package R.(40)
RESULTS
Between January 1, 2005 and March 31, 2008, a total of 45,745 gonorrhea cases were diagnosed and reported to the NC HIV/STD Treatment & Prevention Branch. The analysis presented here is based on the 39,529 cases (86.4%) successfully geocoded and geomasked. Over this time, the gonorrhea rate remained fairly stable at about 160 cases per 100,000 person-years, except for the first and last two quarters during the study period, which had lower rates. Low rates in the first quarter may be explained in part by the state’s transition to an electronic surveillance reporting system. Low rates in the last two quarters may be a result of reporting delays. Maps of unadjusted gonorrhea rates indicated clustering of high rates in the northeastern and southern parts of the state (Figure 2b).
In the year 2000, North Carolina was a heterogeneous state with slightly more women than men, nearly one-third of adults renting their living accommodations, and about 8% of households being headed by a single female with children (Table 1). The highest male to female population imbalances were observed in neighborhoods in urban centers of North Carolina; Raleigh, Durham, and Greensboro (more females than males) and areas with a military base (more males than females in counties with Fort Bragg and Camp Lejeune Military Bases). Single mothers comprised 57% of the households in one urban neighborhood in Durham, North Carolina. More than 85% of census tracts had at least 5% of the population commuting daily to a major metropolitan area (Figure 2a). Small town and rural neighborhoods accounted for 13.8% of the population and only 8.7% of gonorrhea cases (Table 1).
Table 1.
Socio-Cultural Characteristics of Neighborhoods in North Carolina, 2000 (N=1,554) and Proportion of Gonorrhea Cases from January 2005 to March 2008.
| Covariate | Mean (IQR) | Range |
|---|---|---|
| Male to female ratio | 0.99 (0.90, 1.00) | 0.48 – 33.82 |
| % FHH with child | 7.74 (4.56, 9.43) | 0.00 – 57.05 |
| % Renting | 29.84 (16.10, 40.16) | 1.29 – 100.00 |
| SES | 57.85 (47.4, 68.8) | 0.00 – 100.00 |
| Rural Urban Commuting Areas | Proportion of census tracts | Proportion of gonorrhea cases |
| Metropolitan | 65.8% | 69.6% |
| Micropolitan | 20.3% | 21.6% |
| Small Town | 7.0% | 5.6% |
| Rural | 6.8% | 3.1% |
| Region | ||
| Non-mountain | 90.0% | 97.5% |
| Mountain | 10.0% | 2.5% |
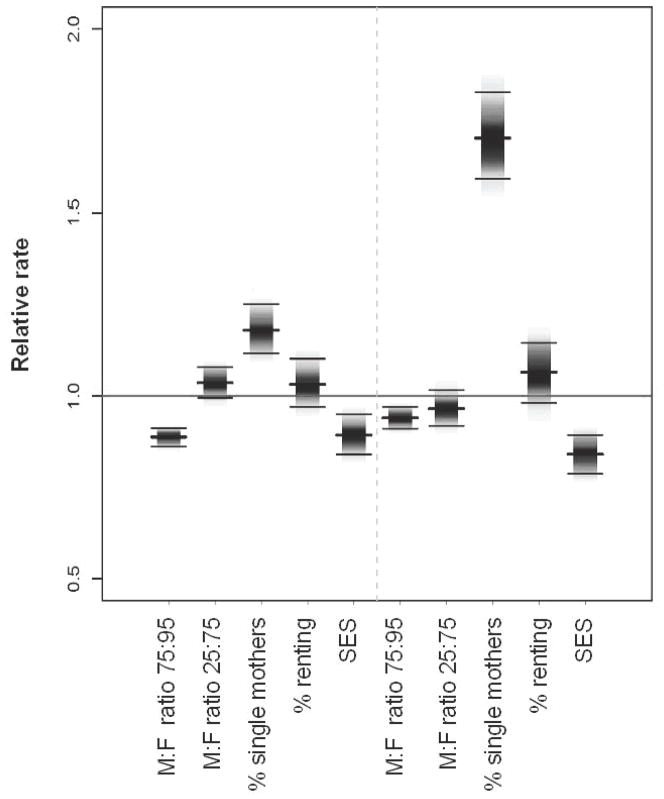
Neighborhoods with high SES were associated with low gonorrhea incidence rates; whereas neighborhoods with more women than men and a high % of single mothers were associated with high gonorrhea rates (Figure 3). In the model with race/ethnicity, an increase from the 25th to 75th neighborhood percentile increased the relative rate (RR) for % single mothers by 1.18 (95% CI 1.12, 1.25), and decreased relative rate for SES by 0.89 (95% CI 0.84, 0.95). The male-female sex ratio has a change point at the 1:1 value, coincidentally the 75th percentile. A threshold effect was observed where the relative rate of gonorrhea was consistently higher for neighborhoods with more women than men. However at the 1:1 change point, the relative rate of gonorrhea decreased as the proportion of men increased. The influence of the proportion single mothers was greatly attenuated after race/ethnicity was accounted for. The proportion of individuals renting was not associated with gonorrhea rates RR 1.03 (95% CI 0.97, 1.10).
Figure 3.
Posterior means and interquartile range for the relative gonorrhea rate between two census tracts (neighborhoods) with the values of the social variables equal to the 1st quartile and 3rd quartile (see Table 1) with all other factors being equal; derived from the generalized linear mixed model with spatial random effects for the model with race/ethnicity (left) and without (right). The male-female ratio additionally shows the relative rate for census tracts in the 75th and 95th percentiles.
Comparing the mountain region with the non-mountain region over the study period, the mountains reported a gonorrhea rate of 42.5 cases per 100,000 person-years and the non-mountain region reported a gonorrhea rate of 145.9 cases per 100,000 person-years. The mountain region had a lower % renting (21.6% mountain vs 30.8% non-mountain), a lower % of single mothers (5.2% mountain vs. 8.0% non-mountain) and a lower proportion of males (sex ratio of 95.3 mountain vs 99.7 non-mountain). Less than 5% of the population in the mountain region was Black compared to more than 25% in the non-mountain region. The non-mountain region of NC accounted for 90.0% of the population and 97.5% of gonorrhea cases.
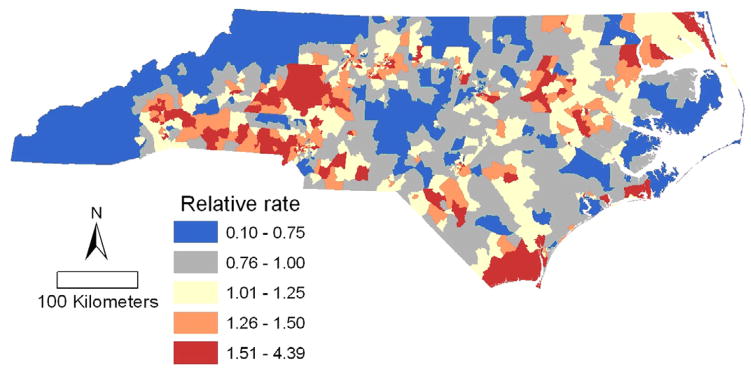
Spatial variation in gonorrhea rates remains even after adjustment for the age, sex, race/ethnicity, rurality, sex-ratio, % single mother, % renting, mountain and non-mountain region (Figure 4). Plotted are the predicted values of the random spatial component of the model, equivalent to the rate ratios relative to the state average after adjustment for the social and environmental risk factors. For example, neighborhoods with a rate ratio (RR) of 2.0 had twice the rate of gonorrhea as the estimated state average for census tracts with the same demographic, social and environmental factors as the neighborhood in question.
Figure 4.
Census tract level gonorrhea incidence rate ratio predicted by the generalized linear mixed model with spatial random effects, relative to the rate predicted by each census tract’s social and environmental risk factors and race/ethnicity.
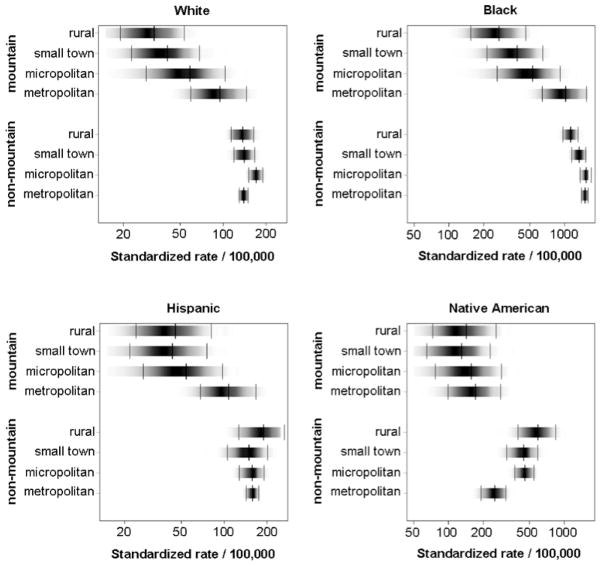
Blacks had the highest gonorrhea incidence rates in North Carolina followed by Native Americans (Figure 5). Hispanics and Whites had relatively low rates. In general, gonorrhea rates decreased or remained constant with increasing rurality, except for Native Americans living in the non-mountain region. Native Americans residing in more rural parts of central and eastern NC had a higher incidence of infection than Native Americans residing in metropolitan neighborhoods. Mountain residence was associated with reduced gonorrhea incidence for all races/ethnicities (Figure 5).
Figure 5.
Standardized gonorrhea yearly incidence rate per 100,000 by race/ethnicity, mountain/non-mountain location and rurality with 95% credible intervals based on a generalized linear mixed model with spatial random effects for North Carolina, January 1, 2005 to March 31, 2008.
The map of residual spatial variation in gonorrhea rates for the model without race (not shown) has considerably more variation than that for the model with race (Figure 4). Including race in the model explained a substantial amount of the spatial variation in rate; the variance of the random spatial component decreased by 47% after adjustment for race/ethnicity. The large differences between the fitted rates for the different racial groups (Figure 5) are further illustrations of the predictive power gained by including race in the model.
DISCUSSION
In North Carolina, the spatial pattern of gonorrhea rates appear to be influenced by neighborhood-level socio-cultural determinants of health, primarily those indicative of neighborhood deprivation (high % of single mothers, more women than men, and low SES).
As observed in other communities,(41) percent single mothers was the strongest predictor of high gonorrhea rates before adjusting for race/ethnicity. However, after accounting for race/ethnicity, the association was greatly attenuated. Neighborhood level % single mothers and % Black were strongly correlated (R = 0.79) suggesting that neighborhoods with a high proportion of single Black mothers were carrying the burden of infection.
Consistent with previous work in NC,(34) this study found that census tracts with more women than men were associated with increased gonorrhea rates. This association may represent destabilized family structures and relationship dynamics. Sex ratio imbalances with more women than men could decrease women’s power to negotiate sex, thereby increase concurrent sexual partnerships, high risk sexual behaviors, and reduced condom use. Similarly, census tracts with more men than women could increase a woman’s power to negotiate sex in turn decreasing concurrent partnerships and high risk behaviors. Sex ratio may also act as a proxy for higher incarceration rates and mortality rates among Black men.(18, 29)
As expected, neighborhoods with low SES were associated with a higher relative rate of gonorrhea (Figure 3). Low SES is associated with relationship instability and fewer eligible bachelors, which, similar to neighbourhood sex ratio imbalances, facilitates concurrent partnerships and decreases a woman’s power to negotiate sex and condom use. Low SES may also present barriers to STI treatment through the availability and affordability of healthcare.(42)
Race/ethnicity captured factors associated with gonorrhea incidence that other social variables did not. Part of this can be explained by high partner STI prevalence, facilitated by Blacks being less likely to form sexual partnerships across racial boundaries (32) and more likely to form dense sexual networks with higher concurrency compared to other race/ethnicities.(33, 43) However, the spatial component of this study would account for sexual networks to some extent. Another explanation is that race serves as a proxy for the effects of disproportionate incarceration rates, unequal access to health care, poor education, chronic joblessness, and social disorganization.(18, 29, 34) resulting from geographic, social, and economic segregation.(18)
For incident gonorrhea cases, rurality was protective for all races/ethnicities in the mountain region and for Blacks in the non-mountain regions of North Carolina (Figure 5). The varied effect of rurality and mountain residence suggests that the social, cultural, and economic characteristics of a rural environment that influence sexual networks and risk behaviors can both vary by community and influence STI patterns differently. We hypothesize that in the subsistence farming communities of the mountain region of North Carolina, rural communities are too isolated and small for STI epidemics to persist at endemic levels. As a result, the main pathway of STI transmission is from interconnected metropolitan areas to isolated rural areas, which explains why rurality (defined as areas where few people commute to a large town) is protective in the mountain region, while a similar dynamic cannot clearly be identified across all ethnic groups in the non-mountain region of North Carolina.
Spatial variation in gonorrhea rates still exhibited a considerable amount of spatial dependence, after accounting for social factors and race/ethnicity. That is, adjacent census tracts tended to have more similar rate ratios than census tracts further apart. This residual spatial dependence may be explained in part by the tendency for people to choose local sexual partners as opposed to partners further away.(15)
Neighbourhood instability was hypothesized to influence STI rates by affecting the pool of susceptible and infected residents, social support structures, and neighbourhood cohesion in a community. The percent renting was used as a proxy for neighbourhood instability, but was not an important predictor of gonorrhea rates in either the model with or without race/ethnicity. Percent renting may not fully capture the concept of neighbourhood instability. For example, % renting would not capture a sudden or drastic change in neighbourhood population over time, which could disrupt neighbourhood stability as seen with core areas of syphilis in Baltimore, Maryland.(4)
Census tracts were used to approximate neighborhoods for our study; however the accuracy of this approximation has been debated.(31, 44) Census tracts are still commonly used to delineate neighborhoods.(23, 45–47) Our findings indicate that census tracts are a meaningful resolution in this context given the identification of substantial associations.
The demographic and socio-cultural data available for intercensus years were incomplete. Consequently, we had to assume that socio-cultural data available from the census for the year 2000 was a reasonable approximation of the socio-cultural characteristics of neighborhoods for the years 2005 to 2008 – the timeframe for our gonorrhea data. For the majority of communities, the socio-cultural characteristics of a neighborhood do not change that rapidly. We do not expect the differential bias to change our results so much that it would change our interpretation of them.
North Carolina rates of gonorrhea by age, sex, and race/ethnic group were used to calculate expected case counts for census tracts. Our analyses assumed the influence of each covariate on neighborhood gonorrhea was the same for all age, sex, and race/ethnic groups, which may oversimplify the relations. More interactions between social covariates and individual-level confounders could have been included, as could a multivariate model with different relative rate surfaces. However, each additional component of the model creates further potential problems in model identifiability, providing easily interpretable results, and in reducing power. The model used reflects a compromise between simplicity and completeness by including known risk factors (i.e. age, sex), variables central to the hypothesis (race, ses), and variables whose importance was demonstrated during exploratory analyses (race – rurality interaction).
Neighborhood-level socio-cultural factors explained a significant proportion of the spatial pattern of gonorrhea in both urban and rural communities of North Carolina. Nonetheless, residual spatial dependence remains, suggesting that prevention activities must be effective at a local level. Similar to other studies, race/ethnicity relates to social and cultural factors that are not captured by measures of socioeconomic status alone. Until these factors can be identified and properly measured, race/ethnicity will remain a poor, yet necessary substitute to better understand how social, cultural and economic factors affect sexual behaviors and the spread of STIs.
Acknowledgments
This work was supported by R01 AI067913 from the National Institute of Allergy and Infectious Diseases. Ashleigh Sullivan was supported by a Canadian Institute for Health Research Public Health Professional Masters Award.
Abbreviations
- STIs
Sexually Transmitted Infections
- SES
Socio-economic status
- NC
North Carolina
- RUCAs
Rural-Urban Commuting Area codes
- RR
Relative Rate
Footnotes
Publisher's Disclaimer: This is a PDF file of an unedited manuscript that has been accepted for publication. As a service to our customers we are providing this early version of the manuscript. The manuscript will undergo copyediting, typesetting, and review of the resulting proof before it is published in its final citable form. Please note that during the production process errors may be discovered which could affect the content, and all legal disclaimers that apply to the journal pertain.
Contributor Information
Ashleigh B Sullivan, Dalla Lana School of Public Health, University of Toronto.
Dionne C Gesink, Dalla Lana School of Public Health, University of Toronto.
Patrick Brown, Cancer Care Ontario.
Lutong Zhou, Cancer Care Ontario, Toronto, Canada.
Molly Fitch, University of North Carolina at Chapel Hill Marc.
L Serre, University of North Carolina at Chapel Hill.
William C Miller, University of North Carolina at Chapel Hill.
References
- 1.Alvarez-Dardet C, Marquez S, Perea EJ. Urban clusters of sexually transmitted diseases in the city of Seville, Spain. Sex Transm Dis. 1985 Jul–Sep;12(3):166–8. doi: 10.1097/00007435-198507000-00016. [DOI] [PubMed] [Google Scholar]
- 2.Bautista CT, Sateren WB, Sanchez JL, Singer DE, Scott P. Geographic mapping of HIV infection among civilian applicants for United States military service. Health Place. 2008 Sep;14(3):608–15. doi: 10.1016/j.healthplace.2007.10.004. [DOI] [PubMed] [Google Scholar]
- 3.Bernstein KT, Curriero FC, Jennings JM, Olthoff G, Erbelding EJ, Zenilman J. Defining core gonorrhea transmission utilizing spatial data. Am J Epidemiol. 2004 Jul 1;160(1):51–8. doi: 10.1093/aje/kwh178. [DOI] [PubMed] [Google Scholar]
- 4.Gesink Law DC, Bernstein KT, Serre ML, Schumacher CM, Leone PA, Zenilman JM, et al. Modeling a syphilis outbreak through space and time using the Bayesian maximum entropy approach. Ann Epidemiol. 2006 Nov;16(11):797–804. doi: 10.1016/j.annepidem.2006.05.003. [DOI] [PubMed] [Google Scholar]
- 5.Jennings JM, Curriero FC, Celentano D, Ellen JM. Geographic identification of high gonorrhea transmission areas in Baltimore, Maryland. Am J Epidemiol. 2005 Jan 1;161(1):73–80. doi: 10.1093/aje/kwi012. [DOI] [PubMed] [Google Scholar]
- 6.Kerani RP, Handcock MS, Handsfield HH, Holmes KK. Comparative geographic concentrations of 4 sexually transmitted infections. Am J Public Health. 2005 Feb;95(2):324–30. doi: 10.2105/AJPH.2003.029413. [DOI] [PMC free article] [PubMed] [Google Scholar]
- 7.Law DC, Serre ML, Christakos G, Leone PA, Miller WC. Spatial analysis and mapping of sexually transmitted diseases to optimise intervention and prevention strategies. Sex Transm Infect. 2004 Aug;80(4):294–9. doi: 10.1136/sti.2003.006700. [DOI] [PMC free article] [PubMed] [Google Scholar]
- 8.Michaud JM, Ellen J, Johnson SM, Rompalo A. Responding to a community outbreak of syphilis by targeting sex partner meeting location: an example of a risk-space intervention. Sex Transm Dis. 2003 Jul;30(7):533–8. doi: 10.1097/00007435-200307000-00001. [DOI] [PubMed] [Google Scholar]
- 9.Potterat JJ, Rothenberg RB, Woodhouse DE, Muth JB, Pratts CI, Fogle JS., 2nd Gonorrhea as a social disease. Sex Transm Dis. 1985 Jan–Mar;12(1):25–32. doi: 10.1097/00007435-198501000-00006. [DOI] [PubMed] [Google Scholar]
- 10.Risley CL, Ward H, Choudhury B, Bishop CJ, Fenton KA, Spratt BG, et al. Geographical and demographic clustering of gonorrhoea in London. Sex Transm Infect. 2007 Oct;83(6):481–7. doi: 10.1136/sti.2007.026021. [DOI] [PMC free article] [PubMed] [Google Scholar]
- 11.Rothenberg RB. The geography of gonorrhea. Empirical demonstration of core group transmission. Am J Epidemiol. 1983 Jun;117(6):688–94. doi: 10.1093/oxfordjournals.aje.a113602. [DOI] [PubMed] [Google Scholar]
- 12.Schleihauf E, Watkins RE, Plant AJ. Heterogeneity in the spatial distribution of bacterial sexually transmitted infections. Sex Transm Infect. 2009 Feb;85(1):45–9. doi: 10.1136/sti.2008.030197. [DOI] [PubMed] [Google Scholar]
- 13.Shahmanesh M, Gayed S, Ashcroft M, Smith R, Roopnarainsingh R, Dunn J, et al. Geomapping of chlamydia and gonorrhoea in Birmingham. Sex Transm Infect. 2000 Aug;76(4):268–72. doi: 10.1136/sti.76.4.268. [DOI] [PMC free article] [PubMed] [Google Scholar]
- 14.Yorke JA, Hethcote HW, Nold A. Dynamics and control of the transmission of gonorrhea. Sex Transm Dis. 1978 Apr–Jun;5(2):51–6. doi: 10.1097/00007435-197804000-00003. [DOI] [PubMed] [Google Scholar]
- 15.Zenilman JM, Ellish N, Fresia A, Glass G. The geography of sexual partnerships in Baltimore: applications of core theory dynamics using a geographic information system. Sex Transm Dis. 1999 Feb;26(2):75–81. doi: 10.1097/00007435-199902000-00002. [DOI] [PubMed] [Google Scholar]
- 16.Lacey CJ, Merrick DW, Bensley DC, Fairley I. Analysis of the sociodemography of gonorrhoea in Leeds, 1989–93. BMJ. 1997 Jun 14;314(7096):1715–8. doi: 10.1136/bmj.314.7096.1715. [DOI] [PMC free article] [PubMed] [Google Scholar]
- 17.Rice RJ, Roberts PL, Handsfield HH, Holmes KK. Sociodemographic distribution of gonorrhea incidence: implications for prevention and behavioral research. Am J Public Health. 1991 Oct;81(10):1252–8. doi: 10.2105/ajph.81.10.1252. [DOI] [PMC free article] [PubMed] [Google Scholar]
- 18.Adimora AA, Schoenbach VJ. Social context, sexual networks, and racial disparities in rates of sexually transmitted infections. J Infect Dis. 2005 Feb 1;191( Suppl 1):S115–22. doi: 10.1086/425280. [DOI] [PubMed] [Google Scholar]
- 19.Kilmarx PH, Zaidi AA, Thomas JC, Nakashima AK, St Louis ME, Flock ML, et al. Sociodemographic factors and the variation in syphilis rates among US counties, 1984 through 1993: an ecological analysis. Am J Public Health. 1997 Dec;87(12):1937–43. doi: 10.2105/ajph.87.12.1937. [DOI] [PMC free article] [PubMed] [Google Scholar]
- 20.Browning CR, Burrington LA, Leventhal T, Brooks-Gunn J. Neighborhood structural inequality, collective efficacy, and sexual risk behavior among urban youth. J Health Soc Behav. 2008 Sep;49(3):269–85. doi: 10.1177/002214650804900303. [DOI] [PMC free article] [PubMed] [Google Scholar]
- 21.Holtgrave DR, Crosby RA. Social capital, poverty, and income inequality as predictors of gonorrhoea, syphilis, chlamydia and AIDS case rates in the United States. Sex Transm Infect. 2003 Feb;79(1):62–4. doi: 10.1136/sti.79.1.62. [DOI] [PMC free article] [PubMed] [Google Scholar]
- 22.Semaan S, Sternberg M, Zaidi A, Aral SO. Social capital and rates of gonorrhea and syphilis in the United States: spatial regression analyses of state-level associations. Soc Sci Med. 2007 Jun;64(11):2324–41. doi: 10.1016/j.socscimed.2007.02.023. [DOI] [PubMed] [Google Scholar]
- 23.Du P, McNutt LA, O’Campo P, Coles FB. Changes in community socioeconomic status and racial distribution associated with gonorrhea rates: an analysis at the community level. Sex Transm Dis. 2009 Jul;36(7):430–8. doi: 10.1097/OLQ.0b013e31819b8c2f. [DOI] [PubMed] [Google Scholar]
- 24.Baumeister RF, Vohs KD. Sexual economics: sex as female resource for social exchange in heterosexual interactions. Pers Soc Psychol Rev. 2004;8(4):339–63. doi: 10.1207/s15327957pspr0804_2. [DOI] [PubMed] [Google Scholar]
- 25.Hattori MK, DeRose L. Young women’s perceived ability to refuse sex in urban Cameroon. Stud Fam Plann. 2008 Dec;39(4):309–20. doi: 10.1111/j.1728-4465.2008.00177.x. [DOI] [PubMed] [Google Scholar]
- 26.Thomas JC, Schoenbach VJ, Weiner DH, Parker EA, Earp JA. Rural gonorrhea in the southeastern United States: a neglected epidemic? Am J Epidemiol. 1996 Feb 1;143(3):269–77. doi: 10.1093/oxfordjournals.aje.a008738. [DOI] [PubMed] [Google Scholar]
- 27.Williams DR. Race/ethnicity and socioeconomic status: measurement and methodological issues. Int J Health Serv. 1996;26(3):483–505. doi: 10.2190/U9QT-7B7Y-HQ15-JT14. [DOI] [PubMed] [Google Scholar]
- 28.Adimora AA, Schoenbach VJ, Doherty IA. HIV and African Americans in the southern United States: sexual networks and social context. Sex Transm Dis. 2006 Jul;33(7 Suppl):S39–45. doi: 10.1097/01.olq.0000228298.07826.68. [DOI] [PubMed] [Google Scholar]
- 29.Farley TA. Sexually transmitted diseases in the Southeastern United States: location, race, and social context. Sex Transm Dis. 2006 Jul;33(7 Suppl):S58–64. doi: 10.1097/01.olq.0000175378.20009.5a. [DOI] [PubMed] [Google Scholar]
- 30.Kaufman JS, Cooper RS. The use of racial/ethnic categories in medical diagnosis and treatment. In: Whitmarsh I, Jones DS, editors. What’s the use of race? Modern governance adn the biology of difference. Cambridge, MA: The MIT Press; 2010. pp. 187–206. [Google Scholar]
- 31.Krieger N, Chen JT, Waterman PD, Rehkopf DH, Subramanian SV. Race/ethnicity, gender, and monitoring socioeconomic gradients in health: a comparison of area-based socioeconomic measures--the public health disparities geocoding project. Am J Public Health. 2003 Oct;93(10):1655–71. doi: 10.2105/ajph.93.10.1655. [DOI] [PMC free article] [PubMed] [Google Scholar]
- 32.Laumann EO, Youm Y. Racial/ethnic group differences in the prevalence of sexually transmitted diseases in the United States: a network explanation. Sex Transm Dis. 1999 May;26(5):250–61. doi: 10.1097/00007435-199905000-00003. [DOI] [PubMed] [Google Scholar]
- 33.Morris M, Kurth AE, Hamilton DT, Moody J, Wakefield S. Concurrent partnerships and HIV prevalence disparities by race: linking science and public health practice. Am J Public Health. 2009 Jun;99(6):1023–31. doi: 10.2105/AJPH.2008.147835. [DOI] [PMC free article] [PubMed] [Google Scholar]
- 34.Thomas JC, Levandowski BA, Isler MR, Torrone E, Wilson G. Incarceration and sexually transmitted infections: a neighborhood perspective. J Urban Health. 2008 Jan;85(1):90–9. doi: 10.1007/s11524-007-9231-1. [DOI] [PMC free article] [PubMed] [Google Scholar]
- 35.Allshouse WB, Fitch MK, Hampton KH, Gesink DC, Doherty IA, Leone PA, et al. Geomasking sensitive health data and privacy protection: an evaluation using an E911 database. Geocarto Int. Oct 1;25(6):443–52. doi: 10.1080/10106049.2010.496496. [DOI] [PMC free article] [PubMed] [Google Scholar]
- 36.Hampton KH, Fitch MK, Allshouse WB, Doherty IA, Gesink DC, Leone PA, et al. Mapping health data: improved privacy protection with donut method geomasking. Am J Epidemiol. Nov 1;172(9):1062–9. doi: 10.1093/aje/kwq248. [DOI] [PMC free article] [PubMed] [Google Scholar]
- 37.Hall SA, Kaufman JS, Ricketts TC. Defining urban and rural areas in U.S. epidemiologic studies. J Urban Health. 2006 Mar;83(2):162–75. doi: 10.1007/s11524-005-9016-3. [DOI] [PMC free article] [PubMed] [Google Scholar]
- 38.Waller LA, Gotway CA. Applied spatial statistics for public health data. Hoboken, New Jersey: Wiley; 2005. Linking spatial exposure data to health events. [Google Scholar]
- 39.Besag J, York J, Mollie A. Bayesian Image-Restoration, with 2 Applications in Spatial Statistics. Annals of the Institute of Statistical Mathematics. 1991 Mar;43(1):1–20. [Google Scholar]
- 40.Brown P, Zhou L. MCMC for generalized linear models with glmm bugs. The R-Journal. 2010 [Google Scholar]
- 41.Bush KR, Henderson EA, Dunn J, Read RR, Singh A. Mapping the core: chlamydia and gonorrhea infections in Calgary, Alberta. Sex Transm Dis. 2008 Mar;35(3):291–7. doi: 10.1097/OLQ.0b013e31815c1edb. [DOI] [PubMed] [Google Scholar]
- 42.Blackwell DL, Martinez ME, Gentleman JF, Sanmartin C, Berthelot JM. Socioeconomic status and utilization of health care services in Canada and the United States: findings from a binational health survey. Med Care. 2009 Nov;47(11):1136–46. doi: 10.1097/MLR.0b013e3181adcbe9. [DOI] [PubMed] [Google Scholar]
- 43.Adimora AA, Schoenbach VJ, Doherty IA. Concurrent sexual partnerships among men in the United States. Am J Public Health. 2007 Dec;97(12):2230–7. doi: 10.2105/AJPH.2006.099069. [DOI] [PMC free article] [PubMed] [Google Scholar]
- 44.Diez Roux AV. Investigating neighborhood and area effects on health. Am J Public Health. 2001 Nov;91(11):1783–9. doi: 10.2105/ajph.91.11.1783. [DOI] [PMC free article] [PubMed] [Google Scholar]
- 45.Bird CE, Seeman T, Escarce JJ, Basurto-Davila R, Finch BK, Dubowitz T, et al. Neighbourhood socioeconomic status and biological ‘wear and tear’ in a nationally representative sample of US adults. J Epidemiol Community Health. Oct;64(10):860–5. doi: 10.1136/jech.2008.084814. [DOI] [PMC free article] [PubMed] [Google Scholar]
- 46.Li Q, Kirby RS, Sigler RT, Hwang SS, Lagory ME, Goldenberg RL. A multilevel analysis of individual, household, and neighborhood correlates of intimate partner violence among low-income pregnant women in Jefferson county, Alabama. Am J Public Health. Mar;100(3):531–9. doi: 10.2105/AJPH.2008.151159. [DOI] [PMC free article] [PubMed] [Google Scholar]
- 47.Theall KP, Scribner R, Ghosh-Dastidar B, Cohen D, Mason K, Simonsen N. Neighbourhood alcohol availability and gonorrhea rates: impact of social capital. Geospat Health. 2009 May;3(2):241–55. doi: 10.4081/gh.2009.224. [DOI] [PMC free article] [PubMed] [Google Scholar]


