Abstract
Several studies have implicated the dysregulation of microRNAs in neuroblastoma pathogenesis, an often fatal paediatric cancer arising from precursor cells of the sympathetic nervous system. Our group and others have demonstrated that lower expression of miR-542-5p is highly associated with poor patient survival, indicating a potential tumor suppressive function. Here, we demonstrate that ectopic over-expression of this miRNA decreases the invasive potential of neuroblastoma cell lines in vitro, along with primary tumor growth and metastases in an orthotopic mouse xenograft model, providing the first functional evidence for the involvement of miR-542-5p as a tumor suppressor in any type of cancer.
Keywords: MicroRNAs, neuroblastoma, miR-542-5p, orthotopic mouse model
1. Introduction
Mature, biologically active, miRNAs are ~22 nucleotides in length and are involved in the regulation of gene expression at a post-transcriptional level. The targeting of specific sequences within the mRNA 3′ untranslated region (UTR) by miRNAs within the RNA induced silencing complex (RISC) results in either degradation of the mRNA or translational inhibition [1]. More recently, it has also become apparent that miRNAs can target sites that are in 5′ UTR or exonic positions, and that interaction of miRNAs with gene promoters can regulate gene activity at a transcriptional level [2; 3; 4]. Several studies have demonstrated a significant role for microRNAs in various forms of cancer, including a role in the pathogenesis of neuroblastoma [5; 6; 7; 8]. Neuroblastoma is a paediatric cancer derived from precursor cells of the sympathetic nervous system which display extreme heterogeneity in clinical behaviour, ranging from spontaneous regression to rapid progression and death due to disease [9].
A number of recurrent genomic abnormalities have been associated with aggressive disease course in neuroblastoma, including MYCN amplification, loss of 1p and 11q material, and gain of 1q and 17q, as reviewed by Stallings [10]. Recent miRNA expression profiling studies have demonstrated that miRNA expression has been dysregulated by these genomic aberrations and that the expression levels of specific miRNAs can be significantly associated with clinical outcome [6; 7; 11]. Moreover, in vivo and in vitro functional studies have further implicated a number of miRNAs, as having either oncogenic or tumor suppressor effects in neuroblastoma [12; 13; 14; 15; 16; 17; 18].
Recently, our research group [11] and others [6; 7] have demonstrated that miR-542-5p expression levels are very significantly inversely correlated with MYCN amplification and that low expression of this miRNA is highly associated with poor clinical outcome in neuroblastoma. However, functional studies confirming a tumor suppressive function have not been reported. Here, we provide the first in vitro and in vivo functional studies demonstrating the biological effects of this miRNA in neuroblastoma. To the best of our knowledge, this is also the first demonstration for a tumor suppressive function for this miRNA in any form of cancer.
2. Materials and methods
2.1. Cell Culture
Kelly and SKNAS cell lines were purchased from the European Collection of Animal Cell Cultures. Kelly and SKNAS cells were grown in EMEM and RPMI 1640, respectively, supplemented with 10% foetal bovine serum (FBS), 2 mM Glutamine and 2 mM penicillin and streptomycin (GIBCO® Invitrogen by Life Technologies Corp., Carlsbad, CA). NB1691 and SKNAS cell lines containing the luciferase plasmid were maintained in RPMI-1640 supplemented with FBS (10%), l-glutamine (1%) and 100μg/mL Zeocin (InVivoGen, San Diego, California). All cell lines were validated by high resolution aCGH for the presence of previously documented genomic abnormalities.
2.2. Transfections
Pre-miR™ and Anti-miR™ to miR-542-5p along with a scrambled oligonucleotide were obtained from Applied Biosystems (by Life Technologies Corp., Carlsbad, CA). All oligonucleotides were transiently introduced into the cells by reverse transfection using the siPORT™ NeoFX™ (Applied Biosystems/Ambion, Austin, TX). Total RNA/miRNA was extracted using RNeasy and miRNeasy kits (Qiagen Inc, Valencia, CA).
2.3. Proliferation assays
Cells were transfected in 96-well plates (103 cells per well). At designated time points, cells were washed twice with PBS and 10mM p-nitrophenol phosphate in 0.1M sodium acetate with 0.1% triton X-100 was then added. Plates were incubated at 37°C for two hours and the reaction was stopped with 50μL 1M sodium hydroxide per well. Absorbance was measured at 405nm.
2.4. Growth Curve
NB1691 and SKNAS cells were transfected in 6-well plates (3×10⁵cells per well). At designated time points cells were trypsinised, re-suspended in 1 ml of media and nuclei were counted in triplicate for each sample using a Beckman Coulter Cell counter (Beckman Coulter Inc, Brea, CA).
2.5. Invasion assays
Invasion assays were carried out using BD BioCoat™ Growth Factor Reduced MATRIGEL™ Invasion Chamber as per manufacturers’ instructions (BD Biosciences, San Jose, CA). To determine the average number of invading cells, inserts were then viewed under the microscope and the number of cells/field, in 5 random fields, were counted at 200× magnification. Mean values of duplicate experiments were calculated and results subjected to t-test.
2.6. RT qPCR
RT qPCR was carried out using the microRNA specific stem-loop RT primers and Taqman assays (Applied Biosystems), as previously described [12]
2.7. Primary neuroblastoma tumors
The tumors used in this study came from either The Children’s Oncology Group, Philadelphia, PA or Our Lady’s Children’s Hospital, Dublin. The original miRNA profiling analysis of this panel of tumors has been previously described in depth [11].
2.8. In vivo tumor establishment and imaging
All animal experiments were carried out in 4 week old CB-17/SCID mice (Charles’ River Laboratories, Wilmington, MA) and were performed in accordance with a protocol approved by the Institutional Animal Care and Use Committee of St Jude Children’s Research Hospital, Memphis, Tennessee. Retroperitoneal tumors were established by injection of 4.4×10⁵ NB1691 or SKNAS cells behind the left adrenal gland via a left subcostal incision during administration of isoflurane (2%). Mice received an intraperitoneal injection of D-Luciferin (150-mg/kg, Caliper Life Sciences, Hopkinton, MA) and, five minutes after substrate injection, in vivo bioluminescence images were obtained using an IVIS Imaging System 100 Series (Xenogen Corporation, Alameda, CA). All specimens were imaged at a range of 25 cm and acquired images were analyzed using Living Image Software version 2.5 (Xenogen). In vivo bioluminescence measurements were recorded as photons per second and the automatic range of interest function of the Living Image Software was used to analyze tumor bioluminescence in the retroperitoneal tumors resulting in a value of photons per second per centimetre squared (photons/sec/cm2). Mice were initially imaged for 1 minute and if an image were saturated, the image time was reduced by 10-second intervals until saturation was eliminated. Bioluminescence intensities are reported as the mean photons/sec/cm2± SEM. The GraphPad Prism program (Prism 5, GraphPad Software Inc., La Jolla, CA) was used to analyze and graphically present all in vitro and in vivo data. Two-Way ANOVA analysis was used to calculate significance (p values) in all data sets.
2.9. Statistical analysis of neuroblastoma primary tumors
For a given miRNA, tumors were categorized into low versus high miRNA expression. If there were more than 10 patients with no expression, then dichotomization was by 0 versus > 0 expression, otherwise patients were dichotomized on the median expression value for a given miRNA. For event-free survival (EFS) and overall survival (OS), a log rank test was performed to compare the two groups for each miRNA. Kaplan Meier curves were generated overall and by risk factor or characteristic. EFS time was calculated from the time of enrolment on the front-line or biologic study until the time of the first recurrence, progressive disease, secondary malignancy, or death, or until the time of last contact if no event occurred. OS time was calculated until the time of death or until last contact. EFS and OS are presented as the estimate +/− the standard error.
2.10. Microarray gene expression profiling
Total RNA was extracted from Kelly cells 48 hrs post-transfection with either Pre-miR-542-5p or the negative control using the Qiagen miRNeasy Mini Kit (Qiagen Inc, Valencia, CA) including DNase treatment as per manufacturers instructions. RNA (input 25ng) was reverse transcribed and amplified using the WT-Ovation RNA Amplification System kit (NuGEN Technologies, San Carlos, CA). The single-stranded cDNA product (500ng) was labeled overnight using the NimbleGen One-Color DNA Labeling Kit (Roche NimbleGen, Inc., Madison, WI) generating Cy3-labelled ds-cDNA..
Four micrograms of Cy3-labelled ds-cDNA was hybridized to the Homo Sapiens 4 × 72K gene expression array (Roche NimbleGen Inc., Madison, WI) representing 24,000 protein-coding genes, according to the manufacturers protocol. The mRNA expression data were analysed using NimbleScan software version 2.4, which applied quantile normalization [19], and expression values were obtained using the Robust Multi-Chip Average algorithm as described by Irizarry et al. [20]. Expressional alterations of 2-fold across both biological repeats were considered significant.
3. Results
3.1. Association of miR-542-5p expression levels with patient event free (EFS) and overall (OS) survival and known predictive neuroblastoma disease risk factors
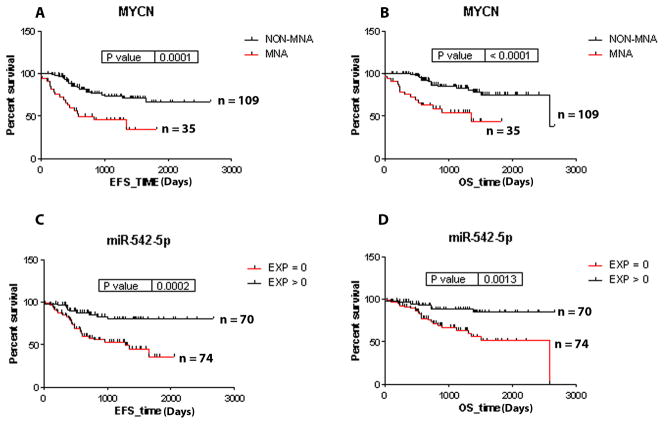
We previously profiled the expression of 449 miRNA loci in a cohort of 145 primary neuroblastoma tumors [11]. One of the most significantly associated miRNAs with patient survival was miR-542-5p, and in this report we provide a more in depth analysis of this miRNA with known disease risk factors and genetic subtypes. As expected, MYCN amplification was predictive of decreased EFS and OS in this data set (Figure 1A and B). As indicated in Figure 1C and D, patients with tumors that completely lacked detectable levels of miR-542-5p also had significantly worse EFS (36.0% probability of 5 year survival versus 80.2%; p = 0.0002; HR 3.20) and OS (51.4% versus 84.6%; p = 0.0013; HR 3.18).
Figure 1.
Kaplan-Meier survival plots confirm MYCN amplification as a significant risk factor in the 144 tumor dataset profiled for miRNA expression (A and B). Association between the lack of miR-542-5p expression (expression = 0) and lower EFS (p value = 0.0002) and OS (p value = 0.0013) (C and D).
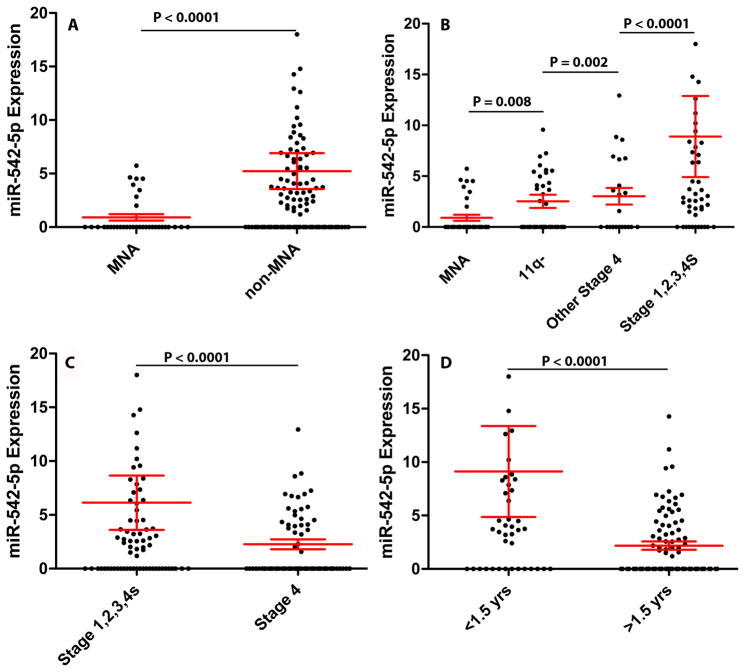
The complete absence of detectable miR-542-5p transcripts occurred at the highest frequency in MYCN amplified tumors (27/35 = 77%), and therefore MYCN amplified tumors had a lower mean expression of miR-542-5p relative to all non-amplified tumors (p < 0.0001)(Figure 2A). The majority of tumors with 11q loss of heterozygosity (25/43 = 58%), which are also an unfavorable tumor subtype, had a complete absence of detectable miR-542-5p and a mean expression level approximately 2.8 fold higher than the MYCN amplified tumors (p = 0.008)(Figure 2B). Approximately 50% (11/22) of tumors from patients with stage 4 disease lacking MYCN amplification or 11q LOH also had absence of miR-542-5p and a mean expression level 3.3 fold higher than MYCN amplified tumors (p = 0.002) (Figure 2B). Only 24% (11/45) of the more favorable tumor subtypes (stage 1,2,3 or 4s) without MYCN amplification or 11q LOH lacked miR-542-5p transcripts, thus having a mean expression level 9.9 fold higher than MNA tumors (p < 0.0001)(Figure 2B). Thus, the overall distribution of miR-542-5p transcripts among tumor genetic subtypes was nonrandom (P = 0.01), and although there was a significant correlation between low levels of miR-542-5p and MYCN amplification, this miRNA predicts poor EFS (HR 2.4; p = 0.016) and OS (HR 2.2; p = 0.027) independently of MYCN status based on the Cox proportional hazards multivariate testing method.
Figure 2.
Box plots illustrating miR-542-5p expression in (A) MYCN amplified (MNA) versus non-MNA tumors; (B) different genetic subtypes of neuroblastoma; (C) different disease stages; and (D) different ages at diagnosis.
Lower miR-542-5p expression was also significantly associated with tumors with stage 4 disease relative to stage 1, 2, 3 or 4s (2.7 fold difference; p < 0.0001) (Figure 1C) and with patients that were >1.5 years of age at diagnosis (4.1 fold difference; p < 0.0001) (Figure 1D).
3.2. Functional studies of miR-542-5p in neuroblastoma cell lines
Given the highly significant association of miR-542-5p with poor patient survival and other known disease risk factors such as INSS (international neuroblastoma staging system) and age at diagnosis, we carried out functional studies involving ectopic over-expression of this miRNA in two MYCN amplified (Kelly and NB1691) and a non-MYCN amplified (SKNAS) neuroblastoma cell lines. These cell lines exhibited an inverse relationship between levels of MYCN and miR-542-5p (Supplementary Figure 1), similar to that which was observed in primary tumors. However, endogenous levels of miR-542-5p were detectable even in the highest MYCN expressing line, i.e. Kelly.
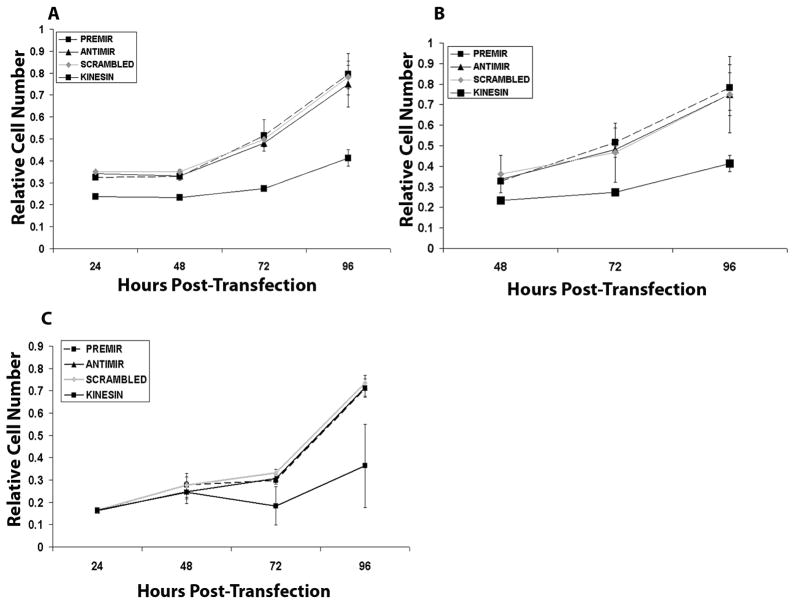
Each cell line was transfected with either mature miR-542-5p mimics, an AntimiR for miR-542-5p, a scrambled oligonucleotide (negative control) or an siRNA for kinesin (positive control to induce cellular arrest). Transfection of cells with miR-542-5p resulted in a significant increase of the mature miRNA in all three cell lines while the AntimiR resulted in a decrease in endogenous miR-542-5p levels (Supplementary Figure 2). As illustrated in Figure 3(A, B, and C), no statistically significant change in proliferation was observed over 96 hours as a result of up- or down-regulation of miR-542-5p compared to the negative control oligonucleotide in either Kelly, NB1691 or SKNAS. As expected, the kinesin siRNA was highly effective in retarding cell growth, indicating that transfection conditions were optimal.
Figure 3.
Kelly (A), SKNAS (B), and NB1691 (C) were transiently transfected with PremiR-542-5p, AntimiR-542-5p, a scrambled oligonucleotide (negative control) or a kinesin siRNA (positive control for proliferation arrest). Relative cell number was determined over a 96hr period using an MTT assay. Graphs represent results from two biological replicate experiments with n=3 technical repeats.
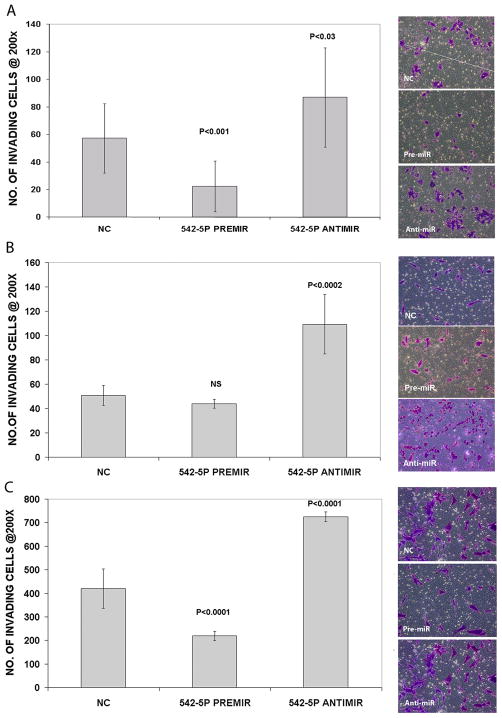
The effects of miR-542-5p over- and under-expression on cell invasion through a matrigel matrix in Kelly, NB1691 and SKNAS cells were also examined. For the Kelly cell line, ectopic over-expression resulted in a significant decrease in invasion (p < 0.001) over a 24 hr period, and conversely, miR-542-5p knock-down led to an increase in cell invasiveness (p = 0.03) relative to the negative control (Figure 4A). Inhibition of endogenous miR-542-5p in NB1691 also led to a significant increase in invasiveness (p < 0.0002)(Figure 4B), but ectopic over-expression did not lead to a statistically significant decrease in invasion. This cell line is minimally invasive so perhaps the absence of a significant decrease in invasive potential in response to miR-542-5p up-regulation is not too surprising. It was necessary to examine invasion for SKNAS at a much earlier time point (8 hrs) as this cell line is substantially more invasive than Kelly or NB1691 (Supplementary Figure 3). Ectopic over-expression of miR-542-5p at 8 hours post-transfection resulted in a significant (p < 0.0001) decrease in SKNAS cell invasiveness relative to the negative control, while a significant increase in invasiveness in response to down-regulation of the endogenous miRNA was detected (p < 0.0001)(Figure 4C).
Figure 4.
Number of invading cells detected per field at 200X magnification for Kelly (A), NB1691 (B) and SKNAS (C) cells transiently transfected with PremiR-542-5p, AntimiR-542-5p and a scrambled oligonucleotide negative control (NC). Graphs represent results from two biological replicate experiments with n=3 technical repeats. All p-values are relative to the negative control. Representative images of invading cells stained with crystal violet are displayed to the right of each set of graphs.
3.3. Ectopic over-expression of miR-542-5p in an orthotopic mouse xenograft model of neuroblastoma
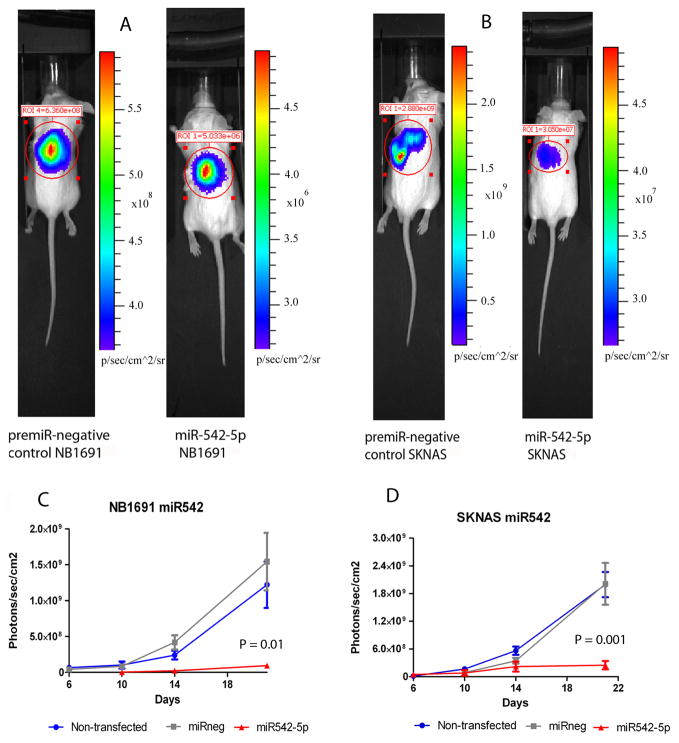
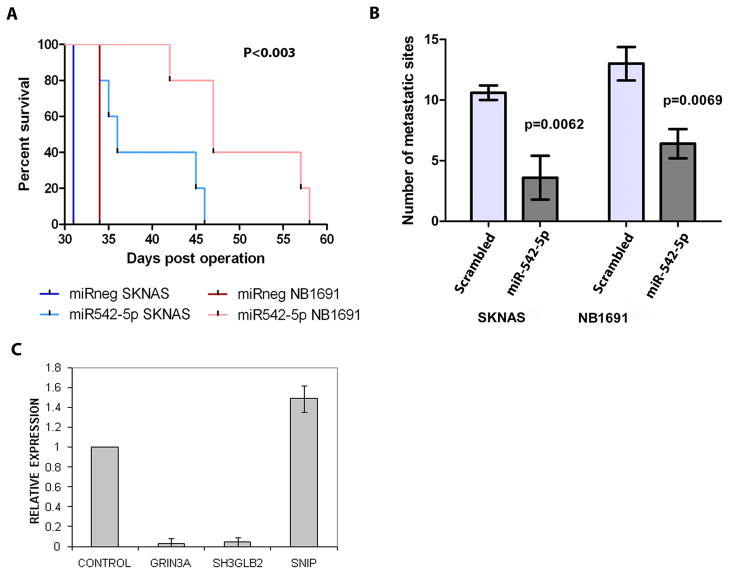
In order to determine the effects of miR-542-5p over-expression on in vivo tumor growth, we carried out transfection studies of this miRNA in the context of a well characterized orthotopic mouse model of this disease [21]. Mature mimics or a scrambled negative control oligonucleotide were transfected into SKNAS and NB1691 cell lines which contain a stably expressed luciferase reporter gene. Tumor growth was detected through bioluminescence imaging facilitated by stable expression of the firefly luciferase gene in SKNAS and NB1691 cells over a three week period (n = 4–6 per group)(Figure 5A and B). Transfection of either cell line with miR-542-5p 48 hours prior to retroperitoneal injection into CB-17/SCID mice led to significantly reduced tumor growth by day 21 relative to a negative control (p = 0.01 for NB1691 and p = 0.001 for SKNAS)(Figure 5C and D). In addition, ectopic over-expression of miR-542-5p significantly increased survival of mice relative to the negative control (p < 0.003 for both models)(Figure 6A) and reduced the number of metastatic sites in both SKNAS and NB1691 animal models relative to the negative control, as assessed by visual inspection and counting post-mortem (Figure 6B). Metastases outside the retroperitoneal cavity were noted and counted on the spleen, liver, and the intestinal lymph nodes, and were confirmed to be bioluminescent, thus originating from SKNAS or NB1691 cells. We conclude that ectopic over-expression of miR-542-5p reduces cell invasiveness in an in vitro cell model, and restricts tumor growth in vivo, consistent with our findings that low expression of this miRNA in tumors is highly correlated with poor patient survival.
Figure 5.
NB1691 or SKNAS cells stably expressing firefly luciferase were transfected with either miR-542-5p mimics or negative control oligonucleotide and then introduced into the retroperitoneal cavity of CB17-SCID immune compromised mice (n = 4–7). Representative bioluminescent images of scanned mice obtained in negative control transfected animals compared to Pre-miR 542-5p-treated groups for NB1691 (A) and SKNAS (B) at day 21 post-inoculation. Note that scales of bioluminescence intensity differ for each image. Imaging using an IVIS Imaging System 100 Series was carried out at days 6, 10, 14 and 21 post-tumor cell inoculation for NB1691 (C) and SKNAS (D) inoculated mice and the data analysed and presented as the mean value for each cohort (photons/sec/cm2) ± SEM. P-values are for day 21 post tumor cell inoculation.
Figure 6.
(A) Animals were sacrificed at moribundity and Mantle-Cox statistical analysis was used to compare overall survival in xenograft cohorts. (n = 4–7 animals per group; p < 0.003 for both NB1691 and SKNAS models). (B) The number of metastases counted post-mortem in Pre-miR 542-5p-treated groups compared to negative control (scrambled) groups. (C) qPCR validation of genes identified as differentially expressed in response to miR-542-5p by microarray gene expression profiling of Kelly cells (see Supplementary Table 1). Average fold change of genes is represented.
3.4 Expression microarray analysis for the identification of miR-542-5p mRNA targets
Given the significant effects that miR-542-5p has on tumor growth, invasiveness and metastasis, mRNA expression microarray analysis was carried out on Kelly cells transfected with either mature miR-542-5p mimics or a negative control oligonucleotide in order to identify down-regulated mRNA targets. Following analysis of two biological replicate experiments, 59 genes were down-regulated >2 fold, while 45 genes were up-regulated by >2 fold (Supplementary Table 1). Among the down-regulated genes, there was no statistically significant enrichment for miR-542-5p predicted binding sites, with only a total of 5 down-regulated genes having target sites predicted by one algorithm (4 from TargetScan; 1 from Microcosm; 0 from PicTar). Five of the genes (including three with predicted target sites) that were differentially expressed based on the microarray analysis were analysed by qPCR, and of these, three were validated (Figure 6C and Supplementary Table 1). However, none of the five putative direct target genes of miR-542-5p are known to play a role in any form of cancer.
4. Discussion
Our group [11] and others [6; 7] have reported that very low expression of miR-542-5p in primary neuroblastoma tumors is highly correlated with poor patient survival, indicating that this miRNA might have a tumor suppressor function. Here, we provide the first functional evidence that miR-542-5p acts as a tumor suppressor in neuroblastoma by blocking cellular invasiveness and by decreasing primary tumor growth and metastasis in an orthotopic mouse xenograft model. Our finding that miR-542-5p over-expression resulted in decreased cell invasion in vitro without affecting the rate of cell proliferation is consistent with previous work confirming that proliferation and invasion are two distinct processes under the control of different signalling pathways[22]. Therefore, the invasive phenotype is capable of change independent of proliferative behaviour. We have also demonstrated that miR-542-5p causes a reduction in the number of metastatic sites which is consistent with the reduction in cell invasiveness detected in vitro.
MiR-542-5p had the lowest level of expression in MYCN amplified tumors, indicating that MYCN might directly or indirectly suppress the transcriptional activity of this miRNA. Tumors with loss of chromosome 11q material, which represent a second major disease subtype with poor prognosis [23], had the second lowest levels of miR-542-5p expression, indicating that factors other than MYCN might also play a role in transcriptional down-regulation. Determining the DNA methylation status of the miR-542-5p promoter sequence in a series of unfavourable and favourable tumor subtypes would certainly be of interest. It is unlikely that chromosome deletion plays a major role in inactivating miR-542-5p given that this miRNA maps to a region on chromosome Xq which is not commonly deleted in neuroblastoma. However, it’s location on chromosome X would suggest that only a single allele would have to be inactivated in tumors from both male and females, given that males have only one copy of this chromosome and that the X chromosome in females undergoes random inactivation as a normal developmental process. The requirement for single allelic inactivation could explain why the most clinically aggressive tumors have no detectable miR-542-5p expression.
Currently, nothing is known about the molecular mechanism by which miR-542-5p causes its tumor suppressive effects. There are relatively few predicted targets for this miRNA in the TargetScan database (3 conserved, 108 poorly conserved targets), and none of the predicted targets that were down-regulated in our expression microarray experiments, and validated by qPCR, are known to play a role in cancer. It is possible that miR-542-5p is negatively regulating a gene(s) post-transcriptionally through translational inhibition without any affect on mRNA levels. Alternatively, the functioning of miR-542-5p could have a less conventional role, perhaps involving direct transcriptional activation or repression, as reported for a number of other miRNAs [4]. A global proteomics based approach is required to search further for direct targets of this miRNA. SNIP (also known as p140Cap) was indirectly up-regulated in response to miR-542-5p and is known to enhance cell invasiveness in other forms of cancer [24]. However, the level of up-regulation (1.5 fold), as assessed by qPCR, might not be biologically significant.
We conclude that although the precise mechanism of action of miR-542-5p is not understood, it is clear from the results presented here that this miRNA can act as a tumor suppressor in neuroblastoma, inhibiting invasiveness and tumor establishment. A recent study by Kota et al. [25] has demonstrated the possibility of miRNA replacement therapy using miR-26a and a murine model of liver cancer. Our results indicate that miR-542-5p can be added to an increasing list of tumor suppressive miRNAs that might serve as a therapeutic if targeted delivery can be achieved.
Supplementary Material
Endogenous levels of miR-542-5p and MYCN in SKNAS, NB1691 and Kelly cells, as determined by TaqMan qPCR.
miR-542-5p expression in SKNAS, NB1691 and Kelly cells at 48 hours post-transfection with Pre-miR and Anti-miR-542-5p compared to negative control.
Graph illustrating average number of invading cells per 5 × 10⁴ cells plated for NB1691, Kelly and SKNAS 24 hours post transfection with a negative control oligonucleotide.
Acknowledgments
This work was supported in part by a Science Foundation Ireland Short Term Travel Fellowship (AT), a Science Foundation Ireland Principal Investigator Award (07/IN.1/B1776)(RLS), the Children’s Medical and Research Foundation (RLS), the NIH (5R01CA127496) (RLS), the Assisi Foundation of Memphis (AMD), the US Public Health Service Childhood Solid Tumor Program Project Grant No. CA23099 (AMD), the Cancer Center Support Grant No. 21766 from the National Cancer Institute (AMD), and by the American Lebanese Syrian Associated Charities (ALSAC)(AMD). Flow Cytometry and Cell Sorting Shared Resource; Ms. Jennifer Peters of the Cell and Tissue Imaging Centre; Dr. Christopher Calabrese and staff of the Small Animal Imaging facility; and all technicians and staff associated with Department of Surgery, St. Jude Children’s Research Hospital, Memphis, TN 38105, USA. The funders played no role in the study design, collection, analysis or interpretation of the data.
Footnotes
Conflict of interest
None declared
Publisher's Disclaimer: This is a PDF file of an unedited manuscript that has been accepted for publication. As a service to our customers we are providing this early version of the manuscript. The manuscript will undergo copyediting, typesetting, and review of the resulting proof before it is published in its final citable form. Please note that during the production process errors may be discovered which could affect the content, and all legal disclaimers that apply to the journal pertain.
References
- 1.He L, Hannon GJ. MicroRNAs: small RNAs with a big role in gene regulation. Nat Rev Genet. 2004;5:522–531. doi: 10.1038/nrg1379. [DOI] [PubMed] [Google Scholar]
- 2.Duursma AM, Kedde M, Schrier M, le Sage C, Agami R. miR-148 targets human DNMT3b protein coding region. RNA. 2008;14:872–877. doi: 10.1261/rna.972008. [DOI] [PMC free article] [PubMed] [Google Scholar]
- 3.Orom UA, Nielsen FC, Lund AH. MicroRNA-10a binds the 5′UTR of ribosomal protein mRNAs and enhances their translation. Mol Cell. 2008;30:460–471. doi: 10.1016/j.molcel.2008.05.001. [DOI] [PubMed] [Google Scholar]
- 4.Place RF, Li LC, Pookot D, Noonan EJ, Dahiya R. MicroRNA-373 induces expression of genes with complementary promoter sequences. Proc Natl Acad Sci U S A. 2008;105:1608–1613. doi: 10.1073/pnas.0707594105. [DOI] [PMC free article] [PubMed] [Google Scholar]
- 5.Buckley PG, Alcock L, Bryan K, Bray I, Schulte JH, Schramm A, Eggert A, Mestdagh P, De Preter K, Vandesompele J, Speleman F, Stallings RL. Chromosomal and microRNA expression patterns reveal biologically distinct subgroups of 11q- neuroblastoma. Clin Cancer Res. 2010;16:2971–2978. doi: 10.1158/1078-0432.CCR-09-3215. [DOI] [PMC free article] [PubMed] [Google Scholar]
- 6.Mestdagh P, Fredlund E, Pattyn F, Schulte JH, Muth D, Vermeulen J, Kumps C, Schlierf S, De Preter K, Van Roy N, Noguera R, Laureys G, Schramm A, Eggert A, Westermann F, Speleman F, Vandesompele J. MYCN/c-MYC-induced microRNAs repress coding gene networks associated with poor outcome in MYCN/c-MYC-activated tumors. Oncogene. 2010;29:1394–1404. doi: 10.1038/onc.2009.429. [DOI] [PubMed] [Google Scholar]
- 7.Schulte JH, Schowe B, Mestdagh P, Kaderali L, Kalaghatgi P, Schlierf S, Vermeulen J, Brockmeyer B, Pajtler K, Thor T, de Preter K, Speleman F, Morik K, Eggert A, Vandesompele J, Schramm A. Accurate prediction of neuroblastoma outcome based on miRNA expression profiles. Int J Cancer. 2010 doi: 10.1002/ijc.25436. [DOI] [PubMed] [Google Scholar]
- 8.Stallings RL, Foley NH, Bryan K, Buckley PG, Bray I. Therapeutic targeting of miRNAs in neuroblastoma. Expert Opin Ther Targets. 2010 doi: 10.1517/14728222.2010.510136. [DOI] [PubMed] [Google Scholar]
- 9.Hoehner JC, Gestblom C, Hedborg F, Sandstedt B, Olsen L, Pahlman S. A developmental model of neuroblastoma: differentiating stroma-poor tumors’ progress along an extra-adrenal chromaffin lineage. Lab Invest. 1996;75:659–675. [PubMed] [Google Scholar]
- 10.Stallings RL, Howard J, Dunlop A, Mullarkey M, McDermott M, Breatnach F, O’Meara A. Are gains of chromosomal regions 7q and 11p important abnormalities in neuroblastoma? Cancer Genet Cytogenet. 2003;140:133–137. doi: 10.1016/s0165-4608(02)00681-7. [DOI] [PubMed] [Google Scholar]
- 11.Bray I, Bryan K, Prenter S, Buckley PG, Foley NH, Murphy DM, Alcock L, Mestdagh P, Vandesompele J, Speleman F, London WB, McGrady PW, Higgins DG, O’Meara A, O’Sullivan M, Stallings RL. Widespread dysregulation of MiRNAs by MYCN amplification and chromosomal imbalances in neuroblastoma: association of miRNA expression with survival. PLoS One. 2009;4:e7850. doi: 10.1371/journal.pone.0007850. [DOI] [PMC free article] [PubMed] [Google Scholar]
- 12.Chen Y, Stallings RL. Differential patterns of microRNA expression in neuroblastoma are correlated with prognosis, differentiation, and apoptosis. Cancer Res. 2007;67:976–983. doi: 10.1158/0008-5472.CAN-06-3667. [DOI] [PubMed] [Google Scholar]
- 13.Cole KA, Attiyeh EF, Mosse YP, Laquaglia MJ, Diskin SJ, Brodeur GM, Maris JM. A functional screen identifies miR-34a as a candidate neuroblastoma tumor suppressor gene. Mol Cancer Res. 2008;6:735–742. doi: 10.1158/1541-7786.MCR-07-2102. [DOI] [PMC free article] [PubMed] [Google Scholar]
- 14.Foley NH, Bray IM, Tivnan A, Bryan K, Murphy DM, Buckley PG, Ryan J, O’Meara A, O’Sullivan M, Stallings RL. MicroRNA-184 inhibits neuroblastoma cell survival through targeting the serine/threonine kinase AKT2. Mol Cancer. 2010;9:83. doi: 10.1186/1476-4598-9-83. [DOI] [PMC free article] [PubMed] [Google Scholar]
- 15.Fontana L, Fiori ME, Albini S, Cifaldi L, Giovinazzi S, Forloni M, Boldrini R, Donfrancesco A, Federici V, Giacomini P, Peschle C, Fruci D. Antagomir-17–5p abolishes the growth of therapy-resistant neuroblastoma through p21 and BIM. PLoS One. 2008;3:e2236. doi: 10.1371/journal.pone.0002236. [DOI] [PMC free article] [PubMed] [Google Scholar]
- 16.Wei JS, Song YK, Durinck S, Chen QR, Cheuk AT, Tsang P, Zhang Q, Thiele CJ, Slack A, Shohet J, Khan J. The MYCN oncogene is a direct target of miR-34a. Oncogene. 2008;27:5204–5213. doi: 10.1038/onc.2008.154. [DOI] [PMC free article] [PubMed] [Google Scholar]
- 17.Welch C, Chen Y, Stallings RL. MicroRNA-34a functions as a potential tumor suppressor by inducing apoptosis in neuroblastoma cells. Oncogene. 2007;26:5017–5022. doi: 10.1038/sj.onc.1210293. [DOI] [PubMed] [Google Scholar]
- 18.Tivnan A, Foley NH, Tracey L, Davidoff AM, Stallings RL. MicroRNA-184-mediated inhibition of tumor growth in an orthotopic murine model of neuroblastoma. Anticancer Res. 2010;30:4391–4395. [PMC free article] [PubMed] [Google Scholar]
- 19.Bolstad BM, Irizarry RA, Astrand M, Speed TP. A comparison of normalization methods for high density oligonucleotide array data based on variance and bias. Bioinformatics. 2003;19:185–193. doi: 10.1093/bioinformatics/19.2.185. [DOI] [PubMed] [Google Scholar]
- 20.Irizarry RA, Hobbs B, Collin F, Beazer-Barclay YD, Antonellis KJ, Scherf U, Speed TP. Exploration, normalization, and summaries of high density oligonucleotide array probe level data. Biostatistics. 2003;4:249–264. doi: 10.1093/biostatistics/4.2.249. [DOI] [PubMed] [Google Scholar]
- 21.Dickson PV, Hamner B, Ng CY, Hall MM, Zhou J, Hargrove PW, McCarville MB, Davidoff AM. In vivo bioluminescence imaging for early detection and monitoring of disease progression in a murine model of neuroblastoma. J Pediatr Surg. 2007;42:1172–1179. doi: 10.1016/j.jpedsurg.2007.02.027. [DOI] [PubMed] [Google Scholar]
- 22.Gao CF, Xie Q, Su YL, Koeman J, Khoo SK, Gustafson M, Knudsen BS, Hay R, Shinomiya N, Vande Woude GF. Proliferation and invasion: plasticity in tumor cells. Proc Natl Acad Sci U S A. 2005;102:10528–10533. doi: 10.1073/pnas.0504367102. [DOI] [PMC free article] [PubMed] [Google Scholar]
- 23.Attiyeh EF, London WB, Mosse YP, Wang Q, Winter C, Khazi D, McGrady PW, Seeger RC, Look AT, Shimada H, Brodeur GM, Cohn SL, Matthay KK, Maris JM. Chromosome 1p and 11q deletions and outcome in neuroblastoma. N Engl J Med. 2005;353:2243–2253. doi: 10.1056/NEJMoa052399. [DOI] [PubMed] [Google Scholar]
- 24.Damiano L, Di Stefano P, Camacho Leal MP, Barba M, Mainiero F, Cabodi S, Tordella L, Sapino A, Castellano I, Canel M, Frame M, Turco E, Defilippi P. p140Cap dual regulation of E-cadherin/EGFR cross-talk and Ras signalling in tumor cell scatter and proliferation. Oncogene. 2010;29:3677–3690. doi: 10.1038/onc.2010.128. [DOI] [PubMed] [Google Scholar]
- 25.Kota J, Chivukula RR, O’Donnell KA, Wentzel EA, Montgomery CL, Hwang HW, Chang TC, Vivekanandan P, Torbenson M, Clark KR, Mendell JR, Mendell JT. Therapeutic microRNA delivery suppresses tumorigenesis in a murine liver cancer model. Cell. 2009;137:1005–1017. doi: 10.1016/j.cell.2009.04.021. [DOI] [PMC free article] [PubMed] [Google Scholar]
Associated Data
This section collects any data citations, data availability statements, or supplementary materials included in this article.
Supplementary Materials
Endogenous levels of miR-542-5p and MYCN in SKNAS, NB1691 and Kelly cells, as determined by TaqMan qPCR.
miR-542-5p expression in SKNAS, NB1691 and Kelly cells at 48 hours post-transfection with Pre-miR and Anti-miR-542-5p compared to negative control.
Graph illustrating average number of invading cells per 5 × 10⁴ cells plated for NB1691, Kelly and SKNAS 24 hours post transfection with a negative control oligonucleotide.


