Abstract
There has recently been renewed interest in non-contrast techniques for peripheral MR angiography following the discovery of an association between gadolinium-based contrast agents and nephrogenic systemic fibrosis (NSF) in patients with renal insufficiency. The ‘fresh blood imaging’ technique proposed by Miyazaki et al. involves the subtraction of two 3D fast spin-echo image sets, one acquired in systole, when the arteries appear dark due to flow-related dephasing, and the other obtained in diastole, when the arteries are brighter. Our goal was to investigate how parameters of the fast spin-echo sequence influence its flow sensitivity, and how that in turn impacts the depiction of large and small arteries. Results from phantom experiments and human studies in the calf suggest that the flow sensitivity is governed largely by the flip angle of the radiofrequency refocusing pulses. The area of the spoiler gradients has a lesser effect, and at low flip angles the echo time plays a role. These parameters can be optimized to obtain good depiction of the calf arteries in healthy subjects. It remains to be seen whether they provide sufficient control over flow sensitivity to achieve diagnostic-quality images in other vascular beds and in the presence of pathology.
Keywords: noncontrast MRA, fast spin echo, flow
Introduction
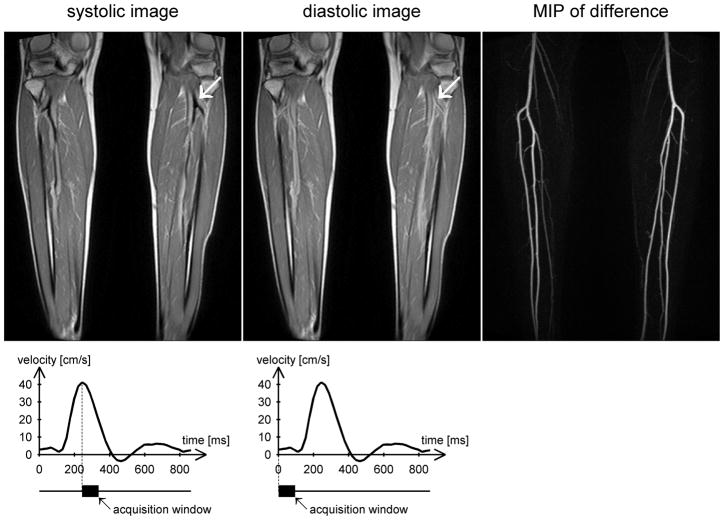
First-pass contrast-enhanced MR angiography (MRA) has become a routine clinical tool for the diagnosis of peripheral arterial disease [1]. However the recent discovery of an association between gadolinium-based contrast agents and nephrogenic systemic fibrosis (NSF) in patients with renal insufficiency [2] has spurred a revival of interest in non-contrast techniques [3]. One approach, pioneered by Miyazaki et al. [4–5], and termed ‘fresh blood imaging’, exploits the pulsatile nature of arterial blood flow to distinguish arteries from veins and stationary tissue. Two sets of 3D fast spin-echo images are acquired, one in systole when the flow is fast and the other in diastole when the flow is slow. The arteries appear dark on the systolic images due to flow-related dephasing, but brighter on the diastolic images, so that subtraction yields a bright-blood angiogram of the arteries (Figure 1).
Figure 1.
Example images from a healthy volunteer acquired at 1.5T during peak systolic flow (left) and end-diastolic flow (center) using an ECG-gated 3D fast spin-echo sequence with a proton density weighted variable flip angle refocusing pulse train. The readout direction is head-foot (i.e. along the principal direction of flow). Note that the arteries appear dark during systole and bright during diastole (arrows). Subtracting the systolic images from the diastolic images produces a bright-blood angiogram, of which a maximum intensity projection (MIP) is shown on the right. The flow velocity time course obtained from phase contrast imaging through the popliteal arteries is plotted below, together with the acquisition windows for systolic and diastolic imaging.
Since the range of flow velocities varies greatly between large and small vessels, and among different people, it is important to understand how the parameters of the fast spin-echo sequence affect its flow sensitivity, and how that in turn impacts the depiction of the arterial system. Three parameters were investigated, namely the flip angle of the radiofrequency (RF) refocusing pulses, the echo time, and the area of the spoiler gradients in the direction of flow.
The influence of flip angle on the flow sensitivity of fast spin-echo sequences has been independently observed by Busse et al. [6], and can be understood as follows. Broadly speaking, the loss of signal from moving protons in fast spin-echo imaging arises from two primary mechanisms: intravoxel dephasing from isochromats with different velocities, and mixing among pathways involving different combinations of spin echoes and stimulated echoes. For flow in the readout direction, pathways that involve only spin echo formation exhibit even-echo rephasing, in which the motion-induced phases are reversed on alternate echoes. If all the refocusing pulses had flip angles of exactly 180°, these pathways would entirely govern the signal at each echo. However, it is common to use flip angles of substantially less than 180° to reduce specific absorption rate (SAR) and to slow the decay of signal from stationary tissues, thereby allowing longer echo trains or a narrower point spread function [6–7]. This results in the formation of stimulated echoes. The phase evolution for moving protons undergoing stimulated echoes differs from that for spin echoes because of the time in which magnetization is stored along the longitudinal axis [8]. There, it retains its phase memory but does not accumulate any additional phase. Pathways that involve a combination of spin echoes and stimulated echoes exhibit a complicated phase evolution, because of repeated exchanges of magnetization between the transverse plane and the longitudinal axis. When such pathways mix during echo formation, the difference in their motion-induced phases can cause signal loss. Since the flip angle of the refocusing pulses determines the relative contributions of spin echoes and stimulated echoes, it strongly influences the flow sensitivity of the sequence.
Fast spin-echo sequences with both constant and variable flip angle pulse trains are commercially available. ‘Constant’ in this case means that the flip angle of the refocusing pulses remains constant throughout the echo train except for the first few pulses, where it is adjusted appropriately to achieve a smooth transition to a pseudo-steady state. In a variable flip angle train, the flip angle is reduced rapidly to achieve a target signal level, and then increased gradually to maintain that signal for much of the remainder of the echo train [9]. This minimizes SAR and enables the use of very long echo trains without blurring.
At low flip angles, the flow sensitivity of the sequence is expected to increase with echo time, since a larger number of pathways contribute to later echoes, causing greater motional dephasing. The area of the spoiler gradients is also anticipated to influence flow sensitivity, since it directly affects the phase change of the transverse magnetization between successive refocusing pulses.
The goal of this work was to examine the effect of the aforementioned sequence parameters on flow sensitivity and the resulting depiction of the calf arteries using the fresh blood imaging technique.
Methods
Both flow phantom experiments and human studies were performed. The purpose of the phantom experiments was to investigate flow sensitivity in a setting where flow velocity could be easily controlled and accurately measured. The results were then used to interpret the images obtained in the human studies.
Phantom experiments
The effect of flip angle (FA), echo time (TE) and spoiler gradient area on signal intensity was measured over a range of flow speeds. Experiments were conducted at 3T on a Tim-TRIO system (Siemens, Erlangen, Germany) running VB13A software.
Apparatus
The phantom consisted of a displacement pump (CardioFlow, Shelley Medical Imaging Technologies, Toronto, Ontario, Canada) connected to a reservoir via braid-reinforced Tygon tubing (5/8″ inner diameter) to form a closed circuit. The pump was driven at constant flow rates of 0, 1, 2, 4, 6, 8, 12 and 16ml/s, which were selected to span the expected range of diastolic velocities in the popliteal artery. It was not considered necessary to include peak systolic velocities, since our experience has shown that the popliteal artery always appears dark in systole on fast spin-echo images. The circulating fluid in the flow phantom consisted of 3% glycerol in water doped with 0.15ml/L Magnevist (gadopentetate dimeglumine, Bayer Healthcare Pharmaceuticals Inc, Wayne, NJ, USA) to approximate the relaxation times of blood. The pump was positioned outside the scan room and a loop of tubing was passed through a waveguide in the wall and into the scanner. There it was laid on the patient table to form two long straight sections parallel to the bore axis, about 17 cm apart, and connected by a loose turn. A small stationary phantom was placed between the two straight sections to provide additional coil loading. The entire arrangement was weighted down with sandbags to avoid motion, and covered with a body phased array coil, which was used in combination with spine coil elements in the patient table for signal reception. Scanner adjustments were performed once, at the beginning of the study, and the patient table remained fixed for the duration of the experiment.
Relaxation measurements
A sample of the circulating fluid was drawn into a 35ml syringe to measure its relaxation times. T1 and T2 were measured at 3T using a segmented inversion-recovery sequence and a spin-echo sequence respectively. The inversion-recovery sequence consisted of a non-selective inversion pulse with a segmented low flip angle gradient-echo readout, which was repeated with several different inversion times. Sequence parameters were: TR = 20s, FA = 15°, BW = 260Hz/pixel, 5 lines per segment, in-plane voxel size 0.9mm × 0.9mm, slice thickness 8mm, TI = 40, 100, 200, 300, 500, 700, 1000, 1500, 2000, 3000, 5000 and 8000ms. The spin-echo sequence was repeated with several different echo times to measure T2. Parameters were: TR = 10s, BW = 130Hz/pixel, in-plane voxel size 0.9mm × 0.9mm, slice thickness 8mm, TE = 12, 150, 300, 450 and 600ms.
B1+ mapping
The use of a 3T system rather than a 1.5T system for the phantom studies was dictated by logistical constraints. In view of the possibility of significant B1+ inhomogeneity at 3T, B1+ mapping was performed to measure the local flip angle in the tubing. The B1+ mapping technique consisted of a series of single-shot 2D fast gradient-echo acquisitions, each of which was immediately preceded by a non-selective preparation pulse with differing nominal flip angle [10]. Parameters for the single-shot readout were: FA = 8°, in-plane voxel size 0.9mm × 0.9mm, slice thickness 8mm, centric ordering, BW = 770Hz/pixel, echo spacing 3.3ms, phase FOV 25%, matrix size 224 × 56. The preparation pulse was a non-selective rectangular pulse, whose nominal flip angle was varied from one acquisition to the next, and whose duration was kept short (400μs) to minimize the effects of B0 inhomogeneity. At least 20s were allowed to elapse between successive acquisitions for the magnetization to return to equilibrium. The pump was turned off prior to measurements and a transverse slice was prescribed through the tubing 8cm from isocenter. Eleven images were acquired, one without a preparation pulse, and the others with preparation pulses whose nominal flip angles ranged from 30° to 110°. A greater density of points was acquired close to the signal null to improve accuracy.
B1+ maps were calculated offline by fitting the signal intensities as a function of nominal flip angle using the model
where S is the signal intensity and FAnominal is the nominal flip angle of the preparation pulse (0° in the absence of a preparation pulse). S0 and β are fitted parameters, where
is the ratio of the measured flip angle to the nominal flip angle and is used as a surrogate for B1+.
Phase contrast imaging
Phase contrast imaging was used to measure the flow velocity in the tubing for each flow setting. Images were acquired in the same transverse plane as the B1+ maps. Sequence parameters were: velocity-encoding factor (venc) = 60cm/s, in-plane voxel size 0.8mm × 0.8mm, slice thickness 5mm, BW = 391Hz/pixel, 5 lines per segment, FA/TE/TR = 20°/3.95ms/71.9ms (where TR includes all lines in a segment). Flow velocities at the center of the tubing were measured using Siemens Argus software.
Fast spin-echo imaging
The flow phantom was imaged using a 3D fast spin-echo sequence with non-selective excitation and refocusing pulses (Siemens product sequence ‘tse_vfl’). The readout direction was chosen along the direction of flow. A modified version of the product sequence was used to investigate the dependence of flow sensitivity on the area of the spoiler gradients in the readout direction.
The effect of the spoiler gradients on moving spins depends not only on their area but also on their duration and timing. However, these parameters typically change together. We therefore characterize the spoilers by their area only, which we define as the total gradient area in the frequency-encoding direction between successive refocusing pulses minus the theoretical minimum readout gradient area (i.e. the duration of the readout period multiplied by the amplitude of the plateau gradient). This latter quantity is just (γΔx)−1, where γ is the gyromagnetic ratio of protons and Δx is the voxel size in the readout direction. The spoiler gradient area is expressed as a percentage of this value. Assuming other sequence parameters remain constant, the spoiler gradient area has a minimum value determined by slew rate limitations, and a maximum value constrained by the echo spacing.
Sequence parameters were chosen to ensure that the results of the phantom experiments were relevant to the situation in vivo. To achieve a similar variation of signal with velocity, the readout gradients were required to have comparable strength and duration. This was done by using the same readout bandwidth as for the human studies (977Hz/pixel) and a similar resolution in the frequency-encoding direction (1.4mm, obtained with FOV = 350mm and a base resolution of 256). The echo spacing was 2.86ms, which fell within the range used in the human studies. The resolution in the phase-encoding direction was dictated by the need to mimic the degree of intravoxel dephasing that occurs in vivo. This meant having a similar ratio of lumen diameter to voxel size. We chose to model the popliteal artery, which has a lumen diameter of approximately 5 – 8mm in healthy subjects [11] and spans roughly 4 voxels (without interpolation) for typical imaging parameters in vivo. Given that the inner diameter of the tubing was 5/8″ (1.6cm), we chose a voxel width of 4mm in the phase-encoding direction (i.e. a phase resolution of 34%) for the phantom experiments. In the partition-encoding direction we used the minimum slice resolution (50%) in combination with a nominal slice thickness of 1mm.
Imaging of the phantom was performed without parallel imaging or partial Fourier sampling. Using the product fast spin-echo sequence with constant flip angle pulse trains, data were collected with nominal flip angles ranging from 60° (the minimum value) to 180° in steps of 30°. For each flip angle, images were acquired with TE = 2.9ms (the minimum value) and 100ms. The spoiler for the product sequence was 64.9%, as defined above. Using the modified version of the sequence with variable spoiler gradients, data were acquired with the maximum and minimum spoilers (68.9% and 14.3% respectively) holding all other parameters constant. In each case, flip angles of 60°, 90° and 120°, and echo times of 2.9ms and 100ms were tested. For TE = 100ms, both sequences were run with a repetition time of TR = 1400ms and 1 echo train per partition, giving an echo train duration of 200ms. For TE = 2.9ms they were run with TR = 700ms and 2 echo trains per partition, giving an echo train duration of 103ms. These choices ensured adequate dynamic range without saturating the signal. For the long TE acquisitions the phase-encoding order was linear, and for the short TE acquisitions it was centric, with positive and negative halves of k-space being sampled in alternate echo trains. In both cases, TE corresponded to an odd echo. However, the results should depend little on whether TE coincides with an even or odd echo, since the lumen is very narrow, giving it a broad k-space distribution, and the turbo factor is very large (i.e. the echo train is very long). Odd and even echoes should therefore contribute with almost equal weighting to the signal in the lumen.
Signal evaluation of the fast spin-echo images was performed by choosing regions of interest in the center of the tubing at the same level as that used for phase contrast imaging and B1+ mapping.
Human studies
The goal of the human studies was to investigate the effect of flip angle, echo time and spoiler gradients on the depiction of large and small arteries using the fresh blood imaging technique, and thereby determine an optimal range of sequence parameters for imaging the calves.
Study population
Three healthy subjects participated in the study (two men, one woman, ages 23, 25 and 27). It was known from earlier exams that they represented a wide range of heart rates. All provided informed consent under an IRB-approved protocol, and each was imaged at 1.5T (Siemens Avanto with VB15A software) and 3T (Siemens Tim-TRIO with VB13A software). Peripheral phased array coils were used to image the calves in all studies except one (images from which are shown in Figure 1). At the time of that study, the peripheral coil was not available, and two body phased array coils were used instead.
Phase contrast imaging
Phase contrast imaging was performed in an axial plane through the popliteal artery to measure the flow velocity time course and determine the trigger delay corresponding to peak systolic flow. The table was positioned such that the imaging slice was at the center of the bore. This was done to ensure accuracy of the velocity-encoding gradients, since it is known that the magnetic fields produced by the gradient coils are nonlinear and the gradient amplitudes decrease far from isocenter. The sequence was run with retrospective ECG gating and the following parameters: venc = 100cm/s, in-plane voxel size 1.5mm × 1.5mm, slice thickness 5mm, 40 phases, BW = 391Hz/pixel, FA/TE/TR/lines per segment = 30°/3.53ms/40.7ms/3 at 1.5T and 20°/3.79ms/70.3ms/5 at 3T (where TR includes all lines in a segment).
B1+ mapping
B1+ mapping was performed using the technique described earlier. A slice was prescribed at the same nominal level as for phase contrast imaging. However, the table was fixed at the position used for the non-contrast MRA. Five images were acquired, one without a preparation pulse, and four with preparation pulses whose nominal flip angles ranged from 35° to 140° in steps of 35°. Parameters for the single shot readout were: FA = 8°, in-plane voxel size 2.2mm × 2.2mm, slice thickness 8mm, centric ordering, BW = 760Hz/pixel, echo spacing 2.7ms, phase FOV 37.5%, matrix size 160 × 60.
Non-contrast MRA
Non-contrast MRA was performed using an ECG-gated 3D fast spin-echo sequence with non-selective excitation and refocusing pulses. Both constant flip angle and proton density weighted variable flip angle refocusing pulse trains were used. Two data sets were acquired within the same sequence, one during peak systolic flow, as determined by phase contrast imaging, and the other at end-diastole, with a trigger delay of zero (see Figure 1). Using constant RF pulse trains, imaging was performed with flip angles ranging from 60° to 170° (the maximum being limited by SAR constraints). In addition, comparisons were made between the maximum and minimum spoilers (67.9 % and 15.2 % respectively) and between short and long echo times (20 – 21ms and 83 – 109ms respectively). Echo times shorter than 20ms were not possible for these acquisitions because of the use of linear ordering in combination with partial Fourier phase sampling. The phase partial Fourier factor varied automatically with TE, reaching 100% at the longest echo time used (109ms). The acquisition window changed with TE, but fell within the range 118 – 216ms in all cases. Echo spacing was 2.86 – 2.96ms, depending on the choice of RF pulse length, a longer pulse being used at high flip angles to reduce SAR. As in the phantom experiments, the results should depend little on whether TE coincides with an odd or even echo, since the vessels are very narrow, giving them a broad k-space distribution, and the turbo factor is very high. Other parameters included: frequency-encoding direction head-foot, phase-encoding direction left-right, FOV = 400mm, base resolution 320, phase resolution 83 – 89%, 80 – 88 partitions with nominal slice thickness 1.5mm, slice resolution 75% and slice partial Fourier factor 6/8, BW = 977Hz/pixel, GRAPPA acceleration factor 2 with 24 reference lines, data acquisition every R-R interval, restore pulse on, 2 echo trains per partition, and total acquisition time 180 – 198 heartbeats (depending on the number of partitions). Variable flip angle imaging was performed with an echo time of 7ms, echo spacing of 2.4ms, half-Fourier phase sampling and an acquisition window of 94 – 105ms. The shorter echo time compared to the constant flip angle acquisitions resulted from the use of centric ordering for the oversampled region at the center of k-space, and the shorter echo spacing was due to shorter RF pulses. Other parameters were as above.
Results
Phantom experiments
At 3T the relaxation times of the circulating fluid in the flow phantom were measured to be T1 = 2100 ± 30 ms and T2 = 232 ± 1 ms. These are comparable to the relaxation times of blood reported by Stanisz et al. [12], namely T1 = 1932 ± 85 and T2 = 275 ± 50 ms at 3T and T1 = 1441 ± 120 and T2 = 290 ± 30 ms at 1.5T.
The flow velocities at the center of the tubing for flow rates of 1, 2, 4, 6, 8, 12 and 16ml/s were measured to be 0.95, 1.7, 3.4, 5.9, 7.8, 10.6 and 12.7 cm/s respectively. This relationship is approximately linear, as expected. B1+ mapping at the center of the tubing showed that β = 1.08, i.e. the measured flip angles were 8% higher than the nominal flip angles. Since a rough evaluation at the time of the experiment showed that the difference was small, no adjustments were made to the reference transmit voltage.
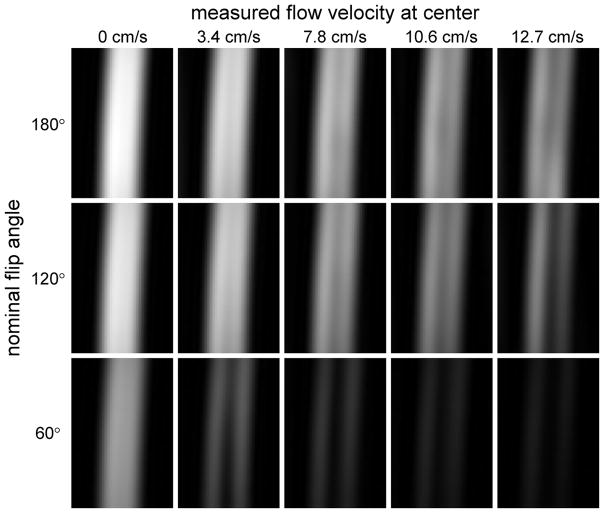
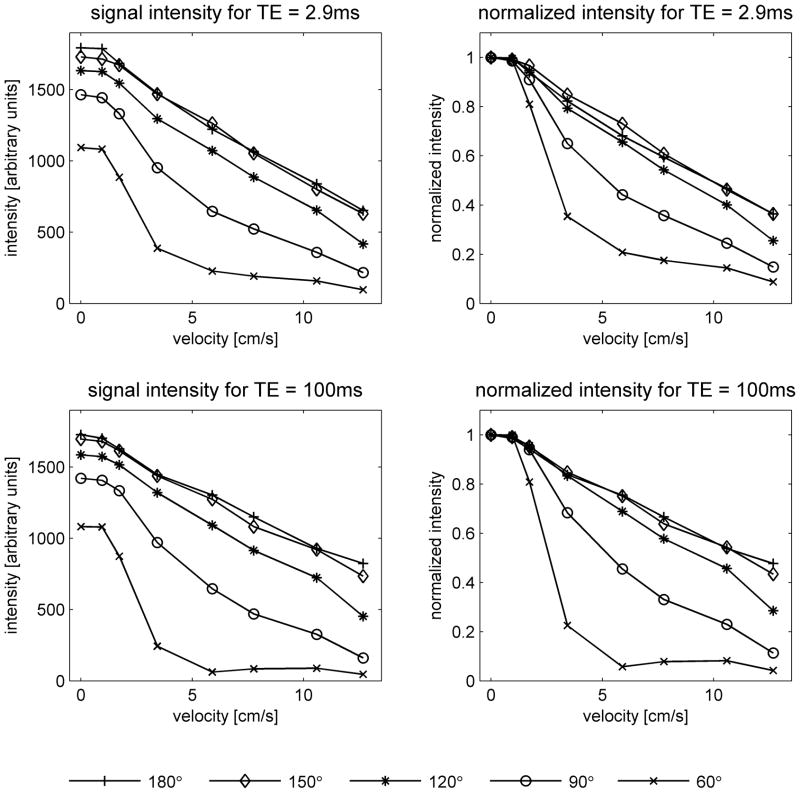
Figure 2 shows fast spin-echo images of the flow phantom for various flow rates and refocusing pulse flip angles, while Figure 3 displays the signal intensities at the center of the tubing. Note that at zero flow velocity the intensities increase with flip angle. The absolute signal intensities (left graphs of Figure 3) should not, however, be compared between the two echo times since the acquisitions had different TR. For all parameter settings the signal intensities decrease as the flow velocity increases. The rate of decrease is a measure of the flow sensitivity, and is more easily compared across sequence parameters using the graphs of normalized signal (right). It can be seen that the flow sensitivity depends strongly on flip angle, increasing markedly as the flip angle decreases. The data for FA = 150° and 180°, however, are almost identical. This is consistent with the results of the B1+ mapping, which show that the effective flip angles are 8% higher than the nominal flip angles. According to this finding, the effective flip angles for these acquisitions are 162° and 194° respectively, which are almost equidistant from 180°, and can therefore be expected to produce almost identical results. At the lowest flip angle studied (60°), it appears that the flow sensitivity is greater for long TE than short TE, while at higher flip angles, the effect of TE on flow sensitivity is not significant.
Figure 2.
Cropped images of the flow phantom acquired using the product fast spin-echo sequence with constant flip angle refocusing pulses and TE = 100ms. Images are shown for three nominal flip angles (60°, 120° and 180°) and flow rates of 0, 4, 8, 12 and 16ml/s, corresponding to measured velocities of 0, 3.4, 7.8, 10.6 and 12.7 cm/s respectively at the center of the lumen. A single slice through the center of the tube is displayed, and the same window levels are chosen for all images. Note that at zero flow the signal is lower for small flip angles. As the flow velocity increases, the signal drops faster (i.e. the flow sensitivity is greater) for small FA.
Figure 3.
Signal intensities in the phantom as a function of flow velocity. Values were measured at the center of the tubing on images acquired using the product fast spin-echo sequence with constant flip angle pulse trains. Data are shown for nominal flip angles of 60°, 90°, 120°, 150° and 180°, and echo times of TE = 2.9ms (top) and TE = 100ms (bottom). The graphs on the left show absolute signal intensity, while those on the right show the signal intensity normalized to its value at zero flow. Absolute intensity should not be directly compared between the two echo times, since the acquisitions had different TR. Note that the flow sensitivity increases as the flip angle is reduced.
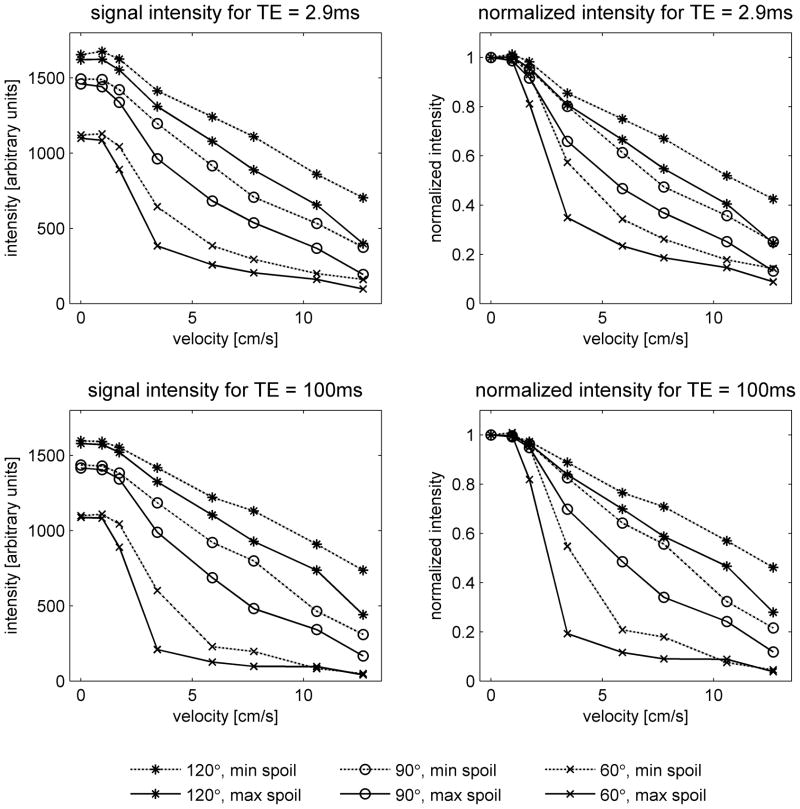
Figure 4 shows the effect of varying the spoiler gradients. The flow sensitivity increases with the area of the spoiler gradients, although the dependence is not as strong as that on flip angle. The results using the maximum spoilers are similar to those obtained with the product sequence (Figure 3). This is to be expected, since the area of the spoiler gradients in the product sequence is close to the maximum value.
Figure 4.
Results obtained in the flow phantom using a modified version of the fast spin-echo sequence, which allowed variation of the spoiler gradients in the readout direction. Acquisitions were performed with constant flip angle refocusing pulse trains, using nominal flip angles of 60°, 90° and 120°, the maximum and minimum spoilers (68.9 % and 14.3 % as defined in the text), and echo times of TE = 2.9ms (top) and TE = 100ms (bottom). As in Figure 3, absolute intensity should not be directly compared between the two TE values. Note that the spoiler influences the flow sensitivity, but its effect is not as great as that of flip angle.
For high flow rates and high flip angles, ghosts (i.e. replicas) of the tube lumen appeared at a distance of half the field of view in the phase-encoding direction (data not shown). Ghosting will be discussed further in the context of the human studies, where examples will be presented.
Human studies
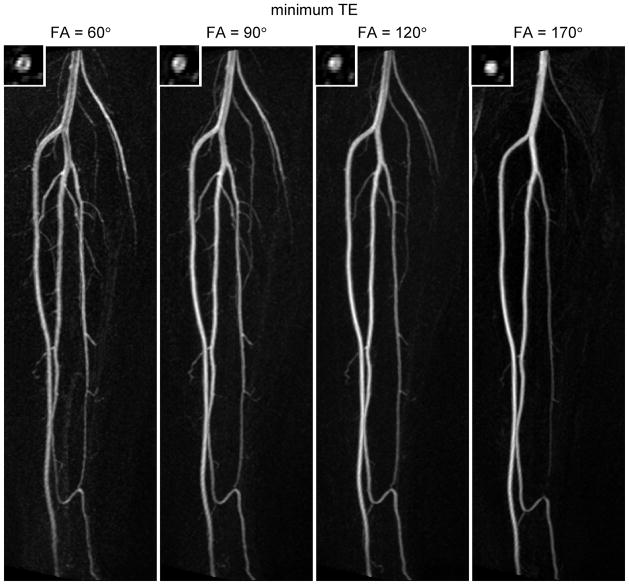
In all subjects the flip angle of the refocusing pulses strongly affected the depiction of the arteries. Figure 5 shows results at 1.5T comparing different flip angles at a short echo time. In order to conserve space, only the right leg is shown. The large vessels (e.g. the popliteal artery and tibioperoneal trunk) are better depicted with a high flip angle; at low flip angles they exhibit signal loss at the center of the lumen. Inspection of the corresponding source images revealed low signal at the center of these vessels in diastole. This can be explained by the faster flow at the center of the vessel in combination with the greater flow sensitivity of the sequence for low flip angles, resulting in partial dephasing even in diastole. It should be pointed out that the subject shown in Figure 5 had a relatively fast heart rate and high end-diastolic flow (93 ± 8 beats per minute and 6.7 ± 2.4 cm/s respectively, as recorded from phase contrast acquisitions on 3 separate days). The small branch vessels are better visualized at lower flip angle; at the highest flip angle tested (170°) many are not visible. Inspection of the source images for FA = 170° revealed high signal in these vessels in systole, suggesting that the peak flow velocities in the small branch arteries are not sufficient to cause dephasing at large flip angles.
Figure 5.
In vivo results in the right calf at 1.5T. Maximum intensity projections are shown for constant flip angle refocusing pulses of 60°, 90°, 120° and 170°. The echo time was set to its minimum value (TE = 20 ms for FA = 60°, 90° and 120°, and TE = 21ms for FA = 170°). The insets show axial cuts through the popliteal artery. Each image is individually windowed to use the full dynamic range. Note that the large vessels are better depicted at high flip angle, while the small branch vessels are better visualized at low flip angle.
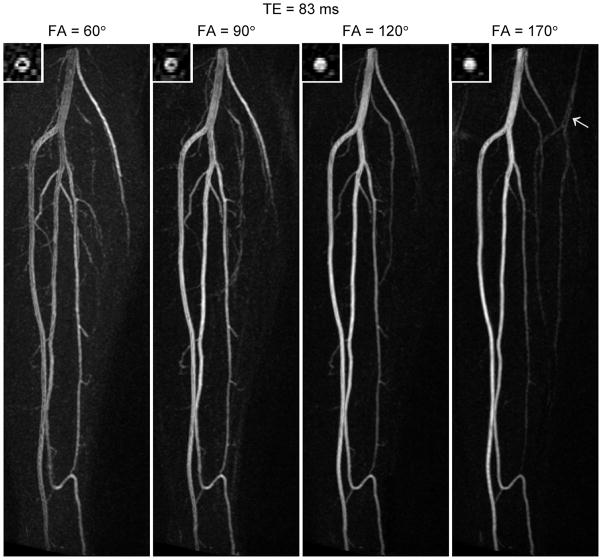
At longer echo time (TE = 83ms, Figure 6) many of the same features are apparent; the larger vessels are better depicted at higher flip angle while the smaller vessels are better visualized at lower flip angle. One notable difference from the shorter echo time (c.f. Figure 5) is the greater signal loss at the center of the vessels for low flip angles. This suggests greater flow sensitivity at the longer echo time, in agreement with the results of the phantom experiments. Also, the signal profile of the popliteal artery appears slightly different between the two echo times, possibly due to differences in the point-spread function.
Figure 6.
Maximum intensity projections acquired at 1.5T in the same subject as Figure 5, but with a longer echo time (TE = 83ms). The arrow in the image for 170° indicates an N/8 ghost (i.e. a replica of the vessel at a distance of N/8 pixels, where N is the number of pixels in the phase-encoding direction). Note that, for low flip angles, the signal loss is greater at the center of the popliteal artery in this figure (TE = 83ms) than in Figure 5 (TE = 20ms), suggesting a dependence of flow sensitivity on TE.
At the highest flip angle studied (170°) ghosts of the vessels occur in the phase-encoding direction (arrow). The distance between the ghosts is N/8 pixels, where N is the total number of pixels in the phase-encoding direction. Their appearance can be explained in terms of even-echo rephasing of spin-echo pathways, which causes a modulation of k-space in the phase-encoding direction. For our protocol, the modulation would have occurred with a period of 8 k-space lines, since we used an acceleration factor of 2 and acquired data over 2 echo trains per partition. This explains the distance of N/8 pixels between the ghosts in the image. The fact that they were not observed at lower flip angles is presumably because of the larger contribution of stimulated-echo pathways.
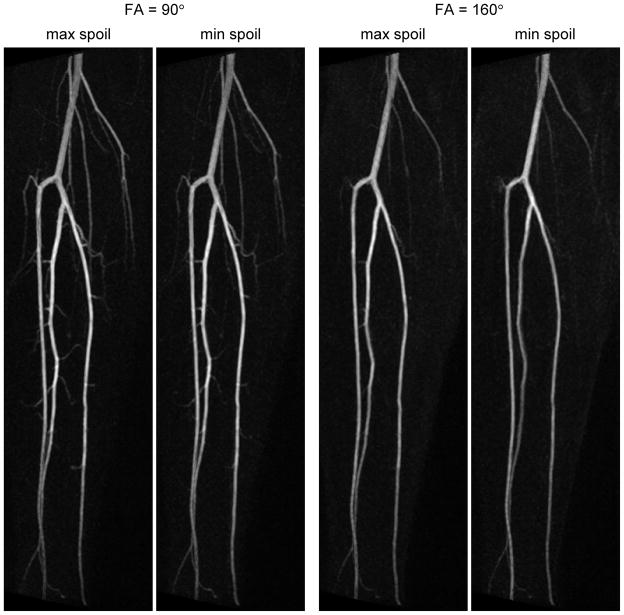
Studies in a different subject (Figure 7) show the effect of varying the spoiler gradients in the readout direction. For each flip angle tested, the small branch vessels are slightly better visualized with the higher spoiler, suggesting increased flow sensitivity. However the effect of the spoiler is minor compared with that of flip angle. In this subject, unlike the previous one (c.f. Figure 6), no signal loss was observed at the center of the popliteal artery for FA = 90°. This may be due to her slower heart rate and lower end-diastolic flow (74 ± 4 beats per minute and −0.4 ± 3.1 cm/s respectively). It was also found that a longer echo time produced better background suppression in this subject. This may be due to slight irregularities in her R-R interval, which would have caused variation in the signal of background tissue between diastole and systole, producing incomplete suppression on the subtracted images. Choosing a long TE reduces signal from background tissue, thereby mitigating this effect.
Figure 7.
Comparison of results at 1.5T using the maximum and minimum spoilers (67.9 % and 15.2 % respectively) for refocusing pulses of 90° and 160°. TE = 109ms in all cases. Note that increasing the spoiler improves the visualization of small branch vessels, but the effect is not as great as that obtained by reducing the flip angle.
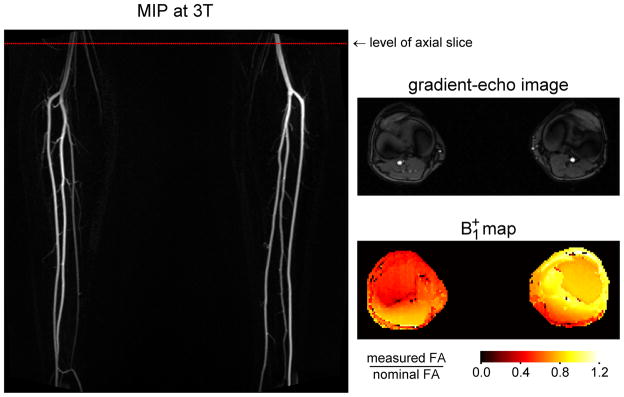
Figure 8 shows results obtained at 3T from the same subject as in Figure 1. The angiogram exhibits lower signal in the right popliteal artery than the left, in particular at the center of the vessel. This is suggestive of smaller flip angles, which would produce both lower signal and increased flow sensitivity. To test this hypothesis, B1+ mapping was performed in an axial plane at the level shown by the dotted line. The resulting map demonstrates lower B1+ at the location of the right popliteal artery than the left, which is consistent with the observation of signal loss on the non-contrast MRA.
Figure 8.
Results at 3T in the same subject as Figure 1. The non-contrast MRA was acquired using an ECG-gated 3D fast spin-echo sequence with a proton density weighted variable flip angle refocusing pulse train. Note that the signal is substantially lower in the right popliteal artery than the left. Also shown is a B1+ map acquired at the level indicated by the dotted red line on the angiogram. The location of the popliteal arteries can be identified from the gradient-echo image (a magnitude image from the phase-contrast acquisition) which was obtained in the same nominal slice as the B1+ map. Note that the value of B1+ is lower at the position of the right popliteal artery than the left, supporting the hypothesis that the signal loss on the MRA is due to locally reduced effective flip angles.
Discussion
This study explored the flow sensitivity of fast spin-echo imaging in the context of ECG-gated non-contrast MRA. We showed that the flow sensitivity must be adjusted appropriately to achieve optimal depiction of large and small arteries in a given subject. Results from phantom experiments and human studies demonstrated that the flow sensitivity depends on the flip angle of the refocusing pulses, the echo time, and the area of the spoiler gradients. Of these parameters, the flip angle was found to be the most important determinant; greater flow sensitivity was observed for lower flip angles, reflecting more mixing of spin-echo and stimulated-echo pathways. The flow sensitivity also increased slightly with the area of the spoiler gradients, and, for low flip angles, it increased with echo time. The echo spacing is also expected to influence flow sensitivity, but is typically kept as short as possible to minimize acquisition time.
While the qualitative relationships described above were reproducible, the quantitative signal values from the flow phantom experiments should be interpreted with caution. The transverse signal profile varied with distance along the tubing and between the two sections. This may be due to slight curvatures in the tubing, which would cause deviations from the well-known parabolic velocity profile [13], and to imperfect alignment between the axis of the tubing and the readout direction. While these factors may affect the quantitative signal values, we believe they do not invalidate the results, since they also occur in vivo.
It is possible that the T2 of the circulating fluid in the flow phantom did not accurately match that of blood, since estimates of T2 depend on the measurement technique used. We chose a spin-echo sequence rather than a multi-echo Carr-Purcell-Meiboom-Gill (CPMG) sequence in order to avoid stimulated echo contributions arising from imperfect 180° refocusing pulses, which would have introduced a degree of T1-weighting into the signal decay. However, diffusion also influences the signal decay, and its effects differ between spin-echo and CPMG techniques.
Human studies showed that larger vessels, such as the popliteal artery and tibioperoneal trunk, were better depicted with less flow sensitivity (e.g. a high flip angle), while small branch vessels were better visualized with greater flow sensitivity (e.g. a lower flip angle). This can be explained in terms of the range of flow velocities present in these vessels over the cardiac cycle. The end-diastolic flow velocity was found to be critical in determining the depiction of large vessels, since dephasing and signal loss could occur in diastole if the velocity was too high and the sequence too flow sensitive. We have observed in the course of these scans and earlier ones that the end-diastolic velocity in young healthy subjects tends to increase with heart rate. The optimal degree of flow sensitivity is therefore subject-dependent. Although the number of people included in this study was low, the subjects spanned a wide range of heart rates. The optimal flip angles in this group lay in the range 90° – 120° and provided adequate depiction of large and small arteries in the calf. Echo time and spoiler gradient area had relatively little effect. It is expected that a higher range of flip angles may be appropriate in the thigh, and that adjustments may be required in the presence of pathology. For example, less flow sensitivity may be preferable in the presence of hyperemia due to a non-healing wound, while greater flow sensitivity may be needed in a patient with reduced cardiac output. In practice, clinical history and phase contrast imaging through a large vessel could be used to determine qualitatively whether a subject has fast or slow flow compared to healthy controls. An appropriate flip angle could then be estimated with reference to the range given above. A rough estimate is expected to be adequate in most cases, since both large and small vessels are visualized over a fairly wide range of flip angles. If the initial estimate provided inadequate depiction of certain vessels, the flip angle could be adjusted appropriately and a second acquisition performed. Further work will be needed to determine whether the sequence parameters considered in this study provide sufficient control of flow sensitivity to achieve adequate image quality in all relevant types of pathology. Other possibilities, such as the use of flow compensation, may need to be explored. Alternative approaches to non-contrast MRA have been demonstrated that are less sensitive to the pulsatility of arterial flow or end-diastolic velocities. The flow-sensitive dephasing-prepared balanced SSFP technique [14] also involves subtraction of dark-artery systolic images from bright-artery diastolic images. However, the flow sensitivity is provided by a diffusion preparation module, which is applied only in systole. Thus the efficacy of the technique does not depend on end-diastolic velocities but only on peak systolic velocities. A new approach, Quiescent Interval Single-Shot (QISS) imaging [15], is an ECG-gated multislice 2D inflow-based technique, involving the application of traveling saturation bands to suppress background tissue and venous signal. Because of the relatively long quiescent period between the saturation pulses and the SSFP readout (228ms), even arteries with very slow flow can be visualized.
In conclusion, optimal performance of the fresh blood imaging technique depends on appropriate adjustment of the flow sensitivity of the underlying fast spin-echo sequence. The flow sensitivity is determined largely by the flip angle of the refocusing pulses and to a lesser extent by the spoiler gradients and echo time. These parameters should be tailored to the individual subject to achieve optimal depiction of the arterial system. It remains to be seen, however, whether they offer adequate control over flow sensitivity to provide accurate MR angiograms in other anatomic regions and in the presence of pathology.
Acknowledgments
This work was supported by an NIH grant R01 HL092439 (VSL).
References
- 1.Koelemay MJ, Lijmer JG, Stoker J, Legemate DA, Bossuyt PM. Magnetic resonance angiography for the evaluation of lower extremity arterial disease: a meta-analysis. JAMA. 2001 Mar 14;285(10):1338–45. doi: 10.1001/jama.285.10.1338. [DOI] [PubMed] [Google Scholar]
- 2.Grobner T, Prischl FC. Gadolinium and nephrogenic systemic fibrosis. Kidney Int. 2007 Aug;72(3):260–4. doi: 10.1038/sj.ki.5002338. Epub 2007 May 16. Review. [DOI] [PubMed] [Google Scholar]
- 3.Miyazaki M, Lee VS. Nonenhanced MR angiography. Radiology. 2008 Jul;248(1):20–43. doi: 10.1148/radiol.2481071497. Review. [DOI] [PubMed] [Google Scholar]
- 4.Miyazaki M, Sugiura S, Tateishi F, Wada H, Kassai Y, Abe H. Non-contrast-enhanced MR angiography using 3D ECG-synchronized half-Fourier fast spin echo. J Magn Reson Imaging. 2000 Nov;12(5):776–83. doi: 10.1002/1522-2586(200011)12:5<776::aid-jmri17>3.0.co;2-x. [DOI] [PubMed] [Google Scholar]
- 5.Miyazaki M, Takai H, Sugiura S, Wada H, Kuwahara R, Urata J. Peripheral MR angiography: separation of arteries from veins with flow-spoiled gradient pulses in electrocardiography-triggered three-dimensional half-Fourier fast spin-echo imaging. Radiology. 2003 Jun;227(3):890–6. doi: 10.1148/radiol.2273020227. [DOI] [PubMed] [Google Scholar]
- 6.Busse RF, Brau AC, Vu A, Michelich CR, Bayram E, Kijowski R, Reeder SB, Rowley HA. Effects of refocusing flip angle modulation and view ordering in 3D fast spin echo. Magn Reson Med. 2008 Sep;60(3):640–9. doi: 10.1002/mrm.21680. [DOI] [PMC free article] [PubMed] [Google Scholar]
- 7.Alsop DC. The sensitivity of low flip angle RARE imaging. Magn Reson Med. 1997 Feb;37(2):176–84. doi: 10.1002/mrm.1910370206. [DOI] [PubMed] [Google Scholar]
- 8.Hinks RS, Constable RT. Gradient moment nulling in fast spin echo. Magn Reson Med. 1994 Dec;32(6):698–706. doi: 10.1002/mrm.1910320604. [DOI] [PubMed] [Google Scholar]
- 9.Mugler JP, Wald LL, Brookeman JR. T2-weighted 3D spin-echo train imaging of the brain at 3 tesla: reduced power deposition using low flip-angle refocusing RF pulses. Proc Intl Soc Mag Reson Med. 2001;9:438. [Google Scholar]
- 10.Breton E, McGorty K, Wiggins GC, Axel L, Kim D. Image-guided radio-frequency gain calibration for high-field MRI. NMR Biomed. doi: 10.1002/nbm.1471. (in press) [DOI] [PMC free article] [PubMed] [Google Scholar]
- 11.Sandgren T, Sonesson B, Ahlgren AR, Länne T. Factors predicting the diameter of the popliteal artery in healthy humans. J Vasc Surg. 1998 Aug;28(2):284–9. doi: 10.1016/s0741-5214(98)70164-8. [DOI] [PubMed] [Google Scholar]
- 12.Stanisz GJ, Odrobina EE, Pun J, Escaravage M, Graham SJ, Bronskill MJ, Henkelman RM. T1, T2 relaxation and magnetization transfer in tissue at 3T. Magn Reson Med. 2005 Sep;54(3):507–12. doi: 10.1002/mrm.20605. [DOI] [PubMed] [Google Scholar]
- 13.Berger SA, Talbot L, Yao L-S. Flow in curved pipes. Ann Rev Fluid Mech. 1983;15:461–512. [Google Scholar]
- 14.Fan Z, Sheehan J, Bi X, Liu X, Carr J, Li D. 3D noncontrast MR angiography of the distal lower extremities using flow-sensitive dephasing (FSD)-prepared balanced SSFP. Magn Reson Med. 2009 Dec;62(6):1523–32. doi: 10.1002/mrm.22142. [DOI] [PMC free article] [PubMed] [Google Scholar]
- 15.Edelman RR, Sheehan JJ, Dunkle E, Schindler N, Carr J, Koktzoglou I. Quiescent-Interval Single-Shot Unenhanced Magnetic Resonance Angiography of Peripheral Vascular Disease: Technical Considerations and Clinical Feasibility. Magn Reson Med. doi: 10.1002/mrm.22287. In press. [DOI] [PMC free article] [PubMed] [Google Scholar]


