Abstract
A microfabricated device is described for the capture and injection of a single mammalian cell into a fused silica capillary for subsequent analysis by chemical cytometry. The device consists of a 500-micrometer diameter well made from polydimethylsiloxane on an indium-tin oxide coated microscope slide. The bottom of the well contains a 2-micrometer high aperture, which was designed to block passage of cells. A cellular suspension was allowed to settle on the device, and aspiration through the aperture was used to trap a single NG-108 cell. Untrapped cells were washed from the device, and a 150-micrometer outer diameter and 50-micrometer inner diameter capillary was placed in the well. To inject a cell, voltage was applied to the indium-tin oxide while simultaneously applying vacuum at the distal end of the capillary.
Cytometry uses instrumental means to characterize the composition of single cells. Classic techniques of image cytometry and flow cytometry use stains and dyes to visualize specific molecular species. Both techniques require a fluorescent probe to target an analyte. However, only a relatively few species can be monitored simultaneously because of the spectral overlap of the dyes.1
Chemical cytometry uses ultra-sensitive instrumentation to obtain qualitative and quantitative information on the contents of a single cell.2 The first report of single cell analysis analyzed ribosomal RNA using electrophoresis on a silk fiber.3 Jorgenson started the modern era of single cell analysis by using capillary chromatography to analyze amino acids in a single giant neuron from a snail.4
High throughput chemical cytometry is required to gain cellular information at a statistically relevant level. To be able to analyze hundreds-to-thousands of single cells each day, the cells must be easily trapped and integrated to the chemical cytometer. We have described a first-generation device that employed 150-μm diameter and 50-μm deep wells to trap cells for subsequent injection into a fused silica capillary.5 A cell suspension was added to the device and cells were allowed to settle into the wells. The wells were much larger than a single cell, and more than one cell can physically fit within the well. We employed a cell concentration that resulted in the introduction of an average of one cell per well. However, the number of cells was Poisson distributed; some wells contained no cells and other wells contained more than one cell.
In this paper, we describe a new device that employs a small aperture at the bottom of a polydimethylsiloxane (PDMS) well. By application of vacuum to the aperture, a single cell is trapped at the bottom of the well. After washing excess cells, that cell is available for analysis. To assist transfer of cells from the device to the capillary for analysis, we employed an indium-tin oxide (ITO) coating at the glass substrate containing the device. ITO was chosen because it is both electrically conductive and transparent, which allows the visualization of the cell, and the subsequent application of a voltage to assist injection of the cell into the grounded analysis capillary.
2. Materials and methods
2.1 Reagents
The synthesis of tetramethylrhodamine-labeled GM1 is described in detail elsewhere.6 Dulbecco’s phosphate buffered saline (PBS) was obtained from Mediatech, Inc., Manassas, VA.
2.2 Fabrication of ITO-PDMS Device
Briefly, the device was constructed by using standard sandwich methods. After the final photolithography steps, the wafer was developed. PDMS was cast onto the master and cured using a sandwich method. The PDMS film was then transferred and bound to an ITO-coated slide to create the final device. We provide more details below.
Master Fabrication
A prime 3-inch silicon wafer (UltraSil Corp., Hayward, CA) was used to fabricate the master mold. The wafer was baked at 200 °C for 20 min to remove any residual surface water, which would otherwise hinder photoresist adhesion. The wafer was cooled to room temperature, and negative photoresist SU-8 2002 (MicroChem Corp, Newton, MA) was spun at 3000 rpm on the wafer to yield feature heights of 2 μm (the final height of the alignment marks and trapping apertures). Immediately after spinning, the coated wafer was placed on a hot plate at room temperature, which was ramped to 65 °C at 300 °C/hr, held for 2 min, then ramped to 95 °C, held for 2 min, and let cool to room temperature. The wafer was exposed to collimated UV light through a dark-field photomask printed at 65,000 dpi (Fineline Imaging, Colorado Springs, CO) on a contact aligner. Afterwards, the wafer was placed on a hot plate at room temperature, where it was ramped at 300 °C/hr to 65 °C, held for 2 min, and then the hot plate was ramped to 95 °C at 300 °C/hr, held at 95 °C for 2 min, and let cool to room temperature. The wafer was developed and hard baked.
The vacuum channels were produced by spinning SU-8 2075 at 4,000 rpm on the patterned wafer to produce 60 μm features. The coated wafer was placed on a hot plate at room temperature, where it was then ramped to 65 °C at 300 °C/hr, held for 4 min, then ramped to 95 °C at 300 °C/hr, held for 15 min, and let cool to room temperature. Then, the wafer was exposed to collimated UV light through a photomask on a contact aligner. The contact aligner also provided alignment to accurately match the masks that generated the apertures, vacuum channels, and cell chambers. Afterwards, the wafer rested on a hot plate that was initially at room temperature and then ramped at 300 °C/hr to 65 °C, where it was held for 4 min. Afterwards, the hot plate was ramped to 95 °C at 300 °C/hr, held at 95 °C for 15 min, and let cool to room temperature.
Once the wafer cooled, the cell chambers were produced by spinning SU-8 2075 at 1,000 rpm on the wafer to produce 220 μm features. The coated wafer was placed on a hot plate at room temperature, where it was then ramped to 65 °C at 300 °C/hr, held for 15 min, then ramped to 95 °C at 300 °C/hr, held for 2 hrs, and let cool to room temperature. Then, the wafer was exposed to collimated UV light through a photomask on a contact aligner. Afterwards, the wafer rested on a hot plate that was initially at room temperature and then ramped at 300 °C/hr to 65 °C, where it was held for 10 min for vacuum channels. Afterwards, the hot plate was ramped to 95 °C at 300 °C/hr, held at 95 °C for 30 min, and let cool to room temperature.
The wafers were next developed in SU-8 developer (MicroChem) at room temperature. After drying with a gentle stream of air and hard-baking the master at 200 °C for 2 hrs, the masters were derivatized with (tridecafluoro-1,1,2,2-tetrahydrooctyl)-1-trichlorosilane (United Chemical Technologies Inc., Bristol, PA) in a desiccator under vacuum.
Assembly
The device was assembled using standard soft lithography techniques.7 The polydimethylsiloxane (PDMS) (Dow Corning, Midland, MI) was prepared by mixing PDMS base with cross-linker at a 10:1 ratio, degassed, and poured over the master. Using the sandwich molding technique, the tallest features of the master will form holes in the PDMS replica. The sandwich was assembled with the PDMS-covered master and it was baked at 70 °C for at least 2 hrs. The resulting PDMS film was peeled off the SU-8 master and was placed on the ITO-coated glass slide, where it was secured by contact (and vacuum when using the device). Liquid PDMS was also applied around the edges of the film to ensure the adhesion. A small piece of PDMS was attached to the vacuum line to facilitate connection.
2.3 Cell culture, fluorescent GM1 uptake, and cell preparation
NG-108 cells were purchased from American Type Culture Collection (ATCC, Mannassas, VA) and grown in DMEM (DMEMH10F5) with 10 % horse serum in the presence of antibiotics. The cells were incubated at 37 °C with 5 % CO2. Fluorescent tetramethylrhodamine-labeled GM1 was taken up by the cells using a procedure described previously.8–9 Briefly, tetramethylrhodamine-tagged GM1 was added to the medium that contained defatted bovine serum albumin. The cells were incubated for 50 hours in this medium. Following the incubation, the cells were detached from the dish using 1X Trypsin/EDTA and washed five times with PBS.
To prepare the cells for single cell analysis, they were fixed using a solution of 4 % formaldehyde in PBS at room temperature for 12 min. After removal of the formalin solution, the reaction was quenched by adding PBS, which was supplemented with 10 mM glycine, to the cell suspension. The suspension was rinsed five times with fresh PBS and stored in the dark at 4 °C. On the same day as analysis, the cells were rinsed twice with PBS.
To prepare the cellular homogenate, the cells were spun down and the PBS removed. To lyse the cells were mixed with 50 μL of a 1% SDS solution. The cell suspension was sonicated at a 60 % duty cycle for ~30 minutes. The homogenate was stored at 4 °C prior to analysis.
2.4 Cell seeding, aspiration and lysing
A suspension of fixed, fluorescently-labeled NG-108 cells was gently pipetted on the ITO-PDMS device, which was submerged in PBS. Keeping the cell suspension in the dark, the cells were allowed to settle for ~10 minutes. Then, a siphon was applied by pulling on the plunger of a syringe that was connected to the vacuum lines to draw the cells towards the apertures. Free cells were rinsed off the device with PBS.
The device was connected to a high voltage power supply and transferred to an inverted microscope to visualize the trapped cells. Using a micromanipulator, the capillary was positioned as close to the desired cell as possible. Hydrodynamic and electrokinetic injections were performed to simultaneously lyse and aspirate the cell: 1 kV for 2 s was applied at the same time that the sheath flow at the terminal end of the capillary was exposed to an 87 cm water drop for 2 s.8 Simply using hydrodynamic injection does not always facilitate complete injection of the trapped cell; an applied field applied to the ITO was used to ensure the contents of the trapped cell were introduced to the separation capillary. Then, the capillary tip was rinsed with water and placed in a container of running buffer prior to electrophoresis.
2.5 Capillary electrophoresis
Analytes were detected by laser-induced fluorescence using a sheath-flow cuvette detection system. The sheath-flow cuvette system was previously described.2, 10–13 Briefly, a diode-pumped 10 mW 532 nm laser (CrystaLaser, Reno, NV) was used for excitation. Fluorescence was collected with a 60 X, 0.7 NA microscope objective and was filtered with a 575DF25 nm bandpass filter, imaged onto a GRIN-lens coupled fiber optic, and detected by a single-photon counting avalanche photodiode. The signal was recorded with a PC and data were processed using MatLab.
Separations were performed with bare 27 cm long, 150 μm o.d., 50 μm i.d. fused-silica capillary (Polymicro Technologies, Phoenix, AZ). The running buffer was composed of 10 mM sodium tetraborate, 35 mM sodium deoxycholate, and 5 mM methyl-β-cyclodextrin. The running voltage was 10 kV.
3. Results and discussion
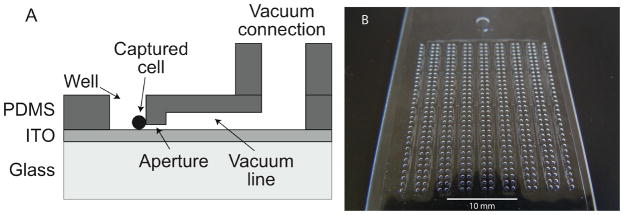
Figure 1a is a schematic of a single well that is used to capture a cell. The aperture is 2-μm high, 5-μm wide, and 50-μm long, and connected to vacuum channels that are 60-μm high and 50-μm wide. The well is 500-μm diameter and 220-μm deep. Figure 1b is a photograph of a device that contains 512 wells. The vacuum channels connect to a main inlet, where vacuum is applied to draw and trap the cells at the 2-μm high aperture.
Figure 1.
Device for capturing single cells. 1a - Schematic of a single well. Cells are trapped against the aperture by applying vacuum to the device. 1b – photograph of the 512 well device.
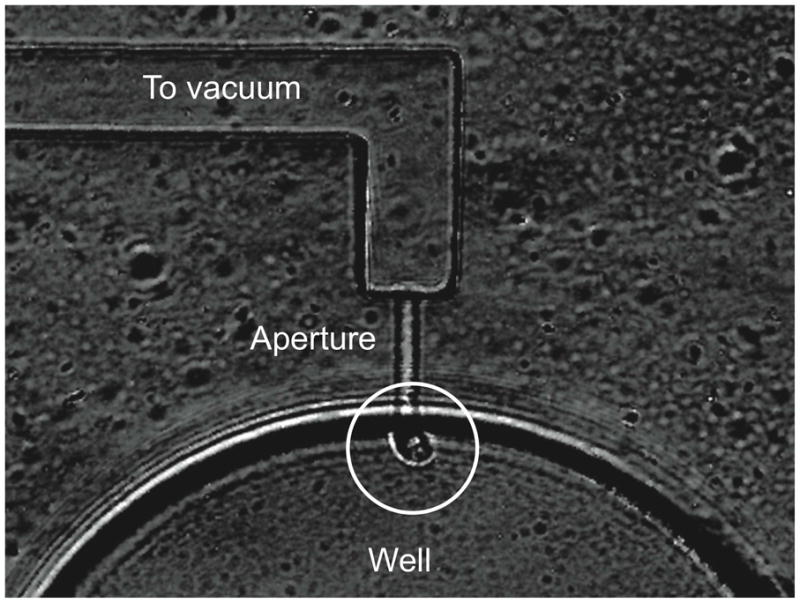
Cells are allowed to settle onto the chip while applying vacuum. Gentle rinsing is used to remove cells that have not been captured in a well. The small dimension of the aperture ensures that no more than one cell is captured in the device. Figure 2 presents a micrograph of a cell captured in the well.
Figure 2.

Micrograph of a single cell captured in a well. The cell is at the center of the circle.
We used formalin-fixed cells in this experiment. Formalin treated cells tend to be quite sticky on most surfaces, and a combination of both an electric field and hydrodynamic flow were used to aspirate the cell into the capillary. A 1 kV potential was applied to the indium-tin oxide for 2 s and, at the same time, the sheath flow at the distal end of the capillary was connected to an 87-cm water drop for 2 s. The combination presumably drew the cell into the capillary, where it came into contact with the surfactant contained in the separation buffer, which caused the cell lysis.
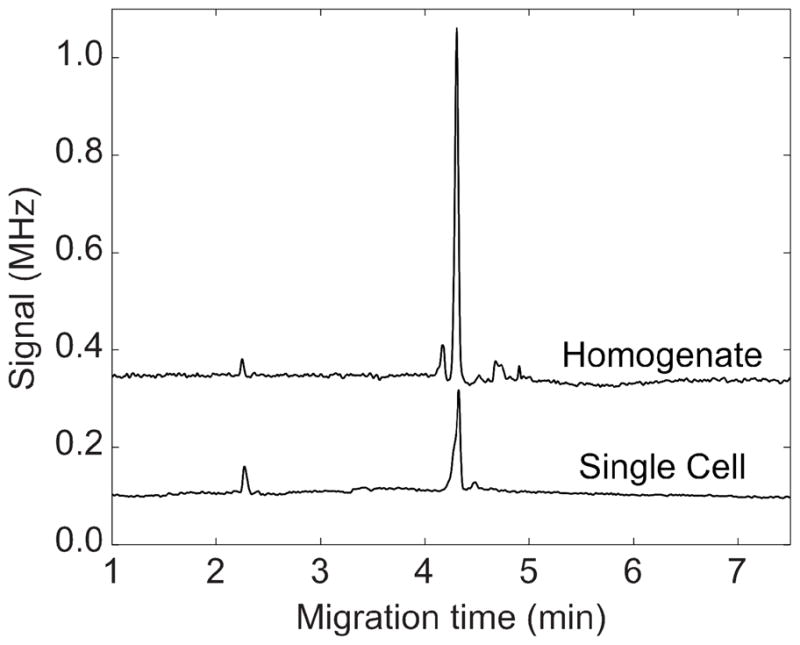
We also performed capillary electrophoresis on a cellular homogenate prepared from the same culture. The electropherograms (Figure 3) showed two peaks. The first peak at 2.25 minutes was a system peak and was consistently observed while introducing a blank solution. The main peak at 4.3 minutes was due to the fluorescently labeled GM3. This culture did not generate metabolites, but was useful for testing the performance of the device.
Figure 3.

Electropherograms generated from a single cell captured by the device and transferred to an electrophoresis capillary, and from a homogenate prepared from the same cell culture. The homogenate was injected by applying 1 kV for 1 s. The traces were offset vertically for clarity.
The migration times were remarkably reproducible; no shifting was required to bring the two electropherograms into alignment. The electrophoresis peaks were also reasonably sharp, generating 25,000 theoretical plates. The signal-to-noise ratio was 100 for the single cell peak, reflecting the outstanding performance of the fluorescence detector.
4. Concluding remarks
We described a simple microfluidic device for the trapping of a single cell for subsequent transfer to an electrophoresis capillary for analysis. The device contains 512 wells, and can be used to simultaneously capture a very large number of cells for subsequent analysis. It will be of interest to interface this cell capture device with a multiple capillary electrophoresis instrument. We have described a number of such instruments. In particular, we described a two-dimensional capillary array that can be expanded to several thousand capillaries;14 such a device would allow extremely high throughput analysis of single cells for characterization of complex cellular populations.
Acknowledgments
We gratefully acknowledge support from the National Institutes of Health (R01NS061767 – NJD).
References
- 1.Shapiro H. Practical Flow Cytometry. 4. Chapter 7 John Wiley & Sons; Hoboken: 2003. [Google Scholar]
- 2.Dovichi NJ, Hu S. Curr Opin Chem Biol. 2003;7:603–608. doi: 10.1016/j.cbpa.2003.08.012. [DOI] [PubMed] [Google Scholar]
- 3.Edstrom JE. Nature. 1953;172:908. doi: 10.1038/172809a0. [DOI] [PubMed] [Google Scholar]
- 4.Kennedy RT, Oates MD, Cooper BR, Nickerson B, Jorgenson JW. Science. 1989;246:57–63. doi: 10.1126/science.2675314. [DOI] [PubMed] [Google Scholar]
- 5.Boardman AK, McQuaide SC, Zhu C, Whitmore CD, Lidstrom ME, Dovichi NJ. Anal Chem. 2008;80:7631–7634. doi: 10.1021/ac800890b. [DOI] [PMC free article] [PubMed] [Google Scholar]
- 6.Larsson EA, Olsson U, Whitmore CD, Martins R, Tettamanti G, Schnaar RL, Dovichi NJ, Palcic MM, Hindsgaul O. Carbohydr Res. 2007;342:482–489. doi: 10.1016/j.carres.2006.10.002. [DOI] [PMC free article] [PubMed] [Google Scholar]
- 7.Xia Y, Whitesides GM. Annu Rev Mater Sci. 1998;28:153–184. [Google Scholar]
- 8.Pagano R, Martin OC. Biochemistry. 1988;27:4439–4445. doi: 10.1021/bi00412a034. [DOI] [PubMed] [Google Scholar]
- 9.Whitmore CD, Hindsgaul O, Palcic MM, Schnaar RL, Dovichi NJ. Anal Chem. 2007;79:5139–5142. doi: 10.1021/ac070716d. [DOI] [PubMed] [Google Scholar]
- 10.Krylov SN, Starke DA, Arriaga EA, Zhang Z, Chan NW, Palcic MM, Dovichi NJ. Anal Chem. 2000;72:872–877. doi: 10.1021/ac991096m. [DOI] [PubMed] [Google Scholar]
- 11.Cheng YF, Dovichi NJ. Science. 1988;242:562–564. doi: 10.1126/science.3140381. [DOI] [PubMed] [Google Scholar]
- 12.Wu SL, Dovichi NJ. J Chromatogr. 1989;480:141–155. doi: 10.1016/s0021-9673(01)84284-9. [DOI] [PubMed] [Google Scholar]
- 13.Le XC, Zhang Y, Dovichi NJ, Compston CA, Palcic MM, Beever RJ, Hindsgaul O. J Chromatogr A. 1997;781:515–522. doi: 10.1016/s0021-9673(97)00607-9. [DOI] [PubMed] [Google Scholar]
- 14.Zhang J, Yang M, Puyang X, Fang Y, Cook LM, Dovichi NJ. Anal Chem. 2001;73:1234–1239. doi: 10.1021/ac001001c. [DOI] [PubMed] [Google Scholar]


