

Abstract
Background
Traditional electrocardiographic reference ranges were derived from studies in communities or clinical trial populations. The distribution of ECG parameters in a large population presenting to a healthcare system has not been studied.
Objective
The objective of this study is to define the contribution of age, race, gender, height, body mass index (BMI), and type 2 diabetes mellitus (T2D) to normal electrocardiographic parameters in a population presenting to a healthcare system.
Methods
Study subjects were obtained from the Vanderbilt Synthetic Derivative, a de-identified image of the electronic medical record (EMR), containing more than 20 years of records on 1.7 million subjects. We identified 63,177 unique subjects with an ECG read as ‘normal’ by the reviewing cardiologist. Using combinations of natural language processing, laboratory and billing code queries, we identified a subset of 32,949 subjects without cardiovascular disease, interfering medications, or abnormal electrolytes. The ethnic makeup was 77% Caucasian, 13% African American, 1% Hispanic, 1% Asian, and 8% unknown.
Results
The range that included 95% of normal PR intervals was 125–196 msec; QRS 69–103 msec; QTcB 365–458 msec; and HR 54–96 bpm. Linear regression modeling of patient characteristic effects reproduced known age and gender effects and identified novel associations with race, BMI, and T2D. A web-based application for patient-specific normal ranges has been made available online at http://biostat.mc.vanderbilt.edu/ECGPredictionInterval.
Conclusion
Analysis of a large set of EMR-derived normal ECGs reproduced known associations, found new relationships, and established patient-specific normal ranges. Such knowledge informs clinical and genetic research and may improve understanding of normal cardiac physiology.
Keywords: electrocardiogram, cardiac conduction, electronic medical record, natural language processing
INTRODUCTION
Differentiating normal from abnormal electrocardiograms (ECGs) is a cornerstone of clinical care. In 1956, Simonson described normal electrocardiographic standards using precise characterization of populations by age, sex, body weight, and race.1 In 1961, Pipberger et al. found that African Americans have a shorter QRS duration using small studies on homogenous populations, laying the foundation for the Washington code, an ECG classification system with different criteria for gender and race.2,3 The Atherosclerosis Risk in Communities (ARIC) study confirmed that African Americans have a shorter QRS duration and found that they also have a shorter QTc interval.4 More recently, Mason et al. analyzed 46,129 ECGs from patients enrolled in non-cardiovascular pharmaceutical treatment trials, demonstrating the age and gender effects on ECG measures.5 Despite these known relationships, textbooks typically cite gender and race-neutral normal intervals, defining the PR interval as 120–200 msec, QRS duration as 80–120 msec, QTc as less than 460 msec.6
While the effect of diabetes on the QTc interval and cardiovascular death is well established, the effect of diabetes on other ECG parameters is less known.7–9 Further, little is known regarding the effect of obesity on many ECG measures. Knowledge of the effect of non-genetic parameters is important for discovery of genetic influences and interpretation of other clinical factors affecting ECG measures.10–15 The advent of large electronic medical record (EMR) systems affords the possibility of gathering data on a large number of real-world patients presenting for clinical care. Previous work has validated this approach as an effective tool for research.16
This study describes the contribution of age, race, gender, height, body mass index (BMI), and type 2 diabetes (T2D) to electrocardiographic parameters (HR, PR interval, QRS duration, and QTc interval) in a large, cross-sectional population gathered from electronic medical records. To our knowledge, this is the first study deriving parameters for modern electrocardiography from a practice-based setting.
METHODS
Identifying Normal Subjects
Study subjects were obtained from the Vanderbilt Synthetic Derivative, a de-identified image of the EMR, containing more than 20 years of data on 1.7 million individuals. The EMR captures patient data in all inpatient and outpatient settings associated with Vanderbilt. The resource contains data that are de-identified in accordance with provisions of 45 CFR 46 that define criteria for investigations that are considered ‘non-human subjects’ research.17 We selected records with an ECG read as ‘normal’ by the original cardiologist regardless of the machine reported intervals, then further screened using natural language processing (NLP) of clinical notes, queries of laboratory and billing data to exclude heart disease, abnormal electrolytes, and interfering medications.18–20 ECGs with heart rates below 50 and above 100 were also excluded. All ECGs were reviewed by board certified cardiologists as part of routine clinical care, and their interpretations recorded in the EMR. Table 1 includes a partial list of exclusions used in the algorithm; the complete algorithm is available at http://gwas.org/index.php/Library_of_Phenotype_Algorithms. The first normal ECG for each subject was used for analysis. For all analyses, patients on tricyclic antidepressants, lithium, and antiarrhythmics were removed. For analyses of the QT interval, we removed patients on QT prolonging medications including those “Drugs with Risk of Torsades de Pointes” as listed on the Arizona Center for Education and Research on Therapeutics site http://torsades.org, and for analyses of the PR interval and HR we removed patients on medications affecting atrioventricular conduction (Table 1).21 This algorithm was previously validated on a subset of the Synthetic Derivative that included 2,334 records with DNA derived from BioVU, the Vanderbilt DNA databank.22 The algorithm had a positive predictive value of 97% compared to a gold standard of dual physician review.
Table 1.
Algorithmic exclusions to define normal electrocardiograms.*
| Abnormal Lab values | Disease exclusions** | Medication exclusions from all models | Additional PR, HR medication exclusions | Additional QT medication exclusions |
|---|---|---|---|---|
| Potassium Magnesium Calcium |
Arrhythmias Heart failure Cardiomyopathies Myocardial ischemia/infarct Cardiac conduction defects |
Tricyclic antidepressants (e.g. amitriptyline) Lithium Antiarrhythmics (e.g. sotalol) |
Digoxin Non-dihydropyridine calcium channel blockers (e.g. diltiazem) Beta blockers (e.g., metoprolol) |
Antibiotics (e.g. clarithromycin) Antipsychotics (e.g. haloperidol) Antihistamines (e.g. astemizole) Other (e.g. cisapride, methadone, arsenic) |
Complete algorithm available at http://gwas.org/index.php/Library_of_Phenotype_Algorithms
Subjects were excluded if matching either an ICD9 code or disease mention (detected via natural language processing) of all clinical documentation.
Collection of numerical data
Electrocardiograms were obtained as part of routine clinical care and analyzed using Philips TraceMaster ECG software. The main ECG system model in use was the Philips Pagewriter Touch, with sample rate 1000 per second, main filter 0.5 Hz to 150 Hz, rhythm filter 0.15 Hz to 100 Hz, and signal amplitude resolution of 5uV. The algorithm to determine the end of the QT interval uses the maximum vertical length from an ancillary line and the ECG signal to determine the end of the T wave, then an alpha-trimming technique and measure of central tendency to determine the median QT value of the eight most reliable leads; this algorithm was robust and accurate tested against the Common Standards for Electrocardiography Database.23,24 The QT interval is corrected for rate using Bazett’s formula (QTcB).25 Data were stored electronically as part of the subject’s EMR and underwent de-identification for deposit into the Synthetic Derivative. This process replaces names and other identifiers (e.g., social security numbers, dates), but does not alter structured numerical data such as those recorded in an ECG.17 Values of PR, QRS, QTcB, and HR were extracted as recorded in the Synthetic Derivative.
Subjects with T2D were identified using a published algorithm that required the presence of a T2D ICD9 code and the presence of an oral hypoglycemic at some point in their medication record.16 The positive predictive value for the T2D algorithm was 100% in a prior evaluation.16 The BMI was calculated with the weight measured closest to and within five years of the date of the ECG, and with the height measured closest to the date of the ECG and occurring after the age of 18 years. Race was determined from the EMR, previously shown to have a high degree of concordance with genetic ancestry determined by ancestry informative markers.26
Statistical Analyses
Statistical analyses sought to characterize the relationship between four ECG features (QRS, PR, QTcB, and HR) and patient characteristics. For each feature, a multiple linear regression model was fitted using as independent variables: age, gender, race (white, black, Asian, Hispanic, other, or unknown), height, BMI, and prior diagnosis of T2D at the time of the ECG (yes or no). Continuous predictors were modeled with restricted cubic splines to allow for non-linear relationships, and knots were located at 25, 45, 65, and 80 years for age; 20, 28, 36, and 45 kg/m2 for body mass index; and at 1.5, 1.63, 1.77, and 1.9 meters for height.
Either weight and/or height were unavailable in approximately 50 percent of subjects. To avoid disregarding subjects due to the missing data, we used multiple imputation. Imputation techniques use all available data to construct a model to fill in missing values. Analyses are then based on the completed dataset containing the available and the imputed data. To account for the uncertainty associated with using imputed data in analyses, we applied multiple imputation, which repeats the imputation protocol multiple times, and then integrates the results.27,28 We used a generalized additive model for constructing the imputation models, and results were integrated across five completed datasets. Reference ranges were calculated from the resulting models and reported as ranges including 95% of observed values, therefore 2.5% of observed values below these ranges and 2.5% of observed values above these ranges. A web-based application has been developed to provide ECG parameter reference ranges corresponding to user inputted patient characteristics. The R programming language and the Hmisc package were used for analyses.29,30
RESULTS
We identified 63,177 unique subjects with an ECG read as ‘normal’ by the reviewing cardiologist. The algorithm identified a subset of 32,949 subjects without prior cardiovascular disease, abnormal electrolytes, or interfering medications. Figure 1 shows the identification of subjects used in analyses for each ECG parameter.
Figure 1.
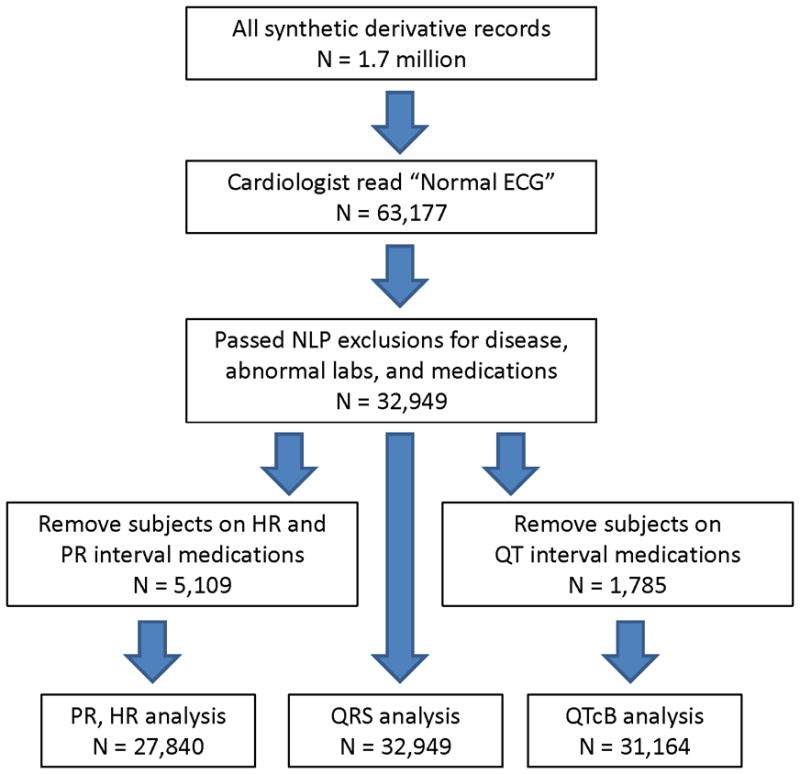
Identification of Subjects.
Subjects included in the analyses had a median age of 47 years, with 60% female and 77% Caucasian (Table 2). Seven percent of subjects were of unknown race, as race is not always recorded in the EMR. Concomitant medications affecting the PR and QT intervals were identified in 16% and 5% of subjects respectively. Type 2 diabetes was identified in 8% of subjects.
Table 2.
Subject Characteristics.
| N | Percentiles | |
|---|---|---|
| 2.5 5 10 25 50 75 90 95 97.5 | ||
| Age (years) | 32949 | 19 21 25 35 47 58 67 72 77 |
| Height (m) | 16407 | 1.52 1.54 1.57 1.63 1.68 1.75 1.83 1.85 1.88 |
| BMI | 16398 | 18.9 20.0 21.5 24.0 27.6 32.3 38.2 42.0 45.1 |
| Gender: | ||
| Female | 19815 | 60% |
| Male | 13134 | 40% |
| Race | ||
| Caucasian | 25347 | 77% |
| African American | 4169 | 13% |
| Hispanic | 415 | 1% |
| Asian | 290 | 1% |
| Other | 465 | 1% |
| Unknown | 2263 | 7% |
| Type II Diabetes | 2783 | 8% |
| PR medication | 5109 | 16% |
| QT medication | 1785 | 5% |
Figure 2 shows cumulative distribution functions for each ECG parameter; the median values for PR, QRS, QTcB and HR were 156 msec, 84 msec, 410 msec and 72 msec, respectively. Given known incomplete correction for HR by Bazett’s formula, gender and HR specific distribution functions for QTcB are shown in Figure 3.31,32
Figure 2.

Cumulative distribution functions for each ECG parameter.
Figure 3.

Gender and HR specific cumulative distribution functions for QTcB.
Figure 4 displays the effects of independent variables on PR, QRS, QTcB, and HR. All effects shown in the figure are adjusted in that a single multiple linear regression model corresponds to each row of panels. Thus, the top row of panels shows results from the model with PR interval as the dependent variable and BMI, height, age, gender, race, and T2D diagnosis as independent variables. For example, the average PR interval for an 80 year old is approximately 12.7 msec (95% CI: 11.6 to 13.8 msec) longer than for a 50 year old (row 1, column 3). Similarly, the average QTcB intervals were 13.5 msec (95% CI: 12.7 to 14.3 msec) longer in females than in males. BMI, height, age, and race were associated with PR interval, and age and gender were associated with QTcB interval. Due to the large sample size, we were also able to detect small and perhaps clinically unimportant effects. For example, the impact of age on QRS duration was highly statistically significant, but as the third panel in the second row demonstrates, this difference of 2 msec across all ages is extremely small and thus unlikely to be clinically important.
Figure 4.

Multiple linear regression model for each ECG parameter.
We developed an interactive, web-based application (http://biostat.mc.vanderbilt.edu/wiki/Main/ECGPredictionInterval) to allow users to input patient characteristics and to receive normal ranges for the four ECG measures PR, QRS, QTcB, and HR. As many different HR corrections exist, if HR is known, it can also be used as a predictor in the model and in addition to QTcB, QT corrections by the Fridericia, Framingham, and Hodges formulas are also given.33–35 As HR is a predictor in the model and partially defines the response, it should be interpreted with caution.
These ranges are based on the predictive distribution from the models used to derive results shown in Figure 4. In addition to obtaining normal ranges, this tool can be used to examine the impact that combinations of patient characteristics can have on ECG measures and on their references ranges. For example, using the tool we see that a 20 year old white female without T2D, with BMI of 20, and who is 1.5 m tall, is expected to have PR interval of 142 msec with a 95% reference range from 109 to 175 msec. In comparison, an 80 year old black male with T2D, a BMI of 45 kg/m2, and a height of 1.9 m is expected to have a PR interval of 176 msec with a 95% reference range from 144 to 209 msec. This result is a median difference of 34 msec between the PR intervals of these two individuals with normal ECGs and no known heart disease.
DISCUSSION
We determined the effect of age, gender, race, height, BMI, and T2D on electrocardiographic parameters in a large, clinically relevant population. We found significant variability in ECG parameters (including such variables as race and gender), suggesting a role for genetic influences in these parameters as has been highlighted in recent genetic analyses.10–15 The most important covariate for PR interval was age, for QRS duration was gender, for QTcB interval was gender, and for HR was diagnosis of T2D. This study replicated known associations with age, gender, and race, demonstrated new associations with BMI (PR, QRS) and T2D (HR), and better characterized ECG parameters for patients of Asian and Hispanic race. Such covariates should be taken into account in clinical trials and other research studies, and may reflect differences in normal ranges.
When considering all subjects, the range that included 95% of normal PR intervals was 125–196 msec; QRS duration 69–103 msec; QTcB intervals 365–468 msec; and HR 54–96 bpm. Therefore, 2.5% of values for each parameter were below these ranges and 2.5% of values above these ranges. Compared to textbook ranges PR 120–200 msec, QRS 80–120 msec, QTc less than 460 msec, the majority of modern electronically recorded ECGs have a more narrow PR interval range and shorter QRS interval.6 Adjusting normal ranges to reflect such data may more accurately identify outliers in a population. Taking into account the factors in this study, one can see a range of expected intervals ranging 103 msec from shortest to longest median PR and 53 msec from shortest to longest QRS duration. Recent reports cite shortened QRS intervals as a marker of arrhythmogenic risk; these data may be useful to identify true outliers in the QRS measurement.36
Table 3 summarizes the results of this study in comparison with several prior studies. This study replicates previous associations with age and gender performed in community populations not seeking medical care described by Macfarlane and Lawrie and clinical trial populations characterized by Mason et al.37,5 Comparisons to Vitelli et al.’s study in African Americans and Macfarlane et al.’s study in Asians are shown.4,38 Many of the effect sizes in the current study were similar to prior published work. Given the large sample size in this study, most results are statistically significant, but clinical significance is to be determined by the user. With the addition of height, BMI, and T2D, this study is one of the most comprehensive to date and may provide a new standard for comparison.
Table 3.
Summary of effects on ECG intervals in prior studies and in the current analysis.
| Study | PR interval (msec) | QRS duration (msec) | QTcB interval (msec) | Heart Rate (bpm) | |
|---|---|---|---|---|---|
| Increasing Age | Macfarlane and Lawrie29 | ↑ | ↓ | ↑ | ↑ |
| Mason et al.5 | ↑ | ↔ | ↑ | ↓ | |
| Current study | ↑ | ↔ | ↑ | ↔ | |
| Female Gender | Macfarlane and Lawrie29 | 7.5 ↓ | 7.1 ↓ | 15.2 ↑ | ↑ |
| Mason et al.5 | 6 ↓ | 6 ↓ | 13 ↑ | 2 ↑ | |
| Current study | 0.5 ↓* | 3.5 ↓ | 13.5 ↑ | ||
| AA race (n = 4169) | Vitelli et al/ARIC4 | 8.5 ↑ | 1.8 ↓ | 1.9 ↓ | 0.3 ↓ |
| Current study | 5.2 ↑ | 3.3 ↓ | 2.5 ↓ | 0.6↑ | |
| Asian race (n = 290) | Macfarlane et al.30 | ↔ | ↔ | ↔ | ↔ |
| Current study | 5.3 ↑ | ↔ | ↔ | 2.8 ↓ | |
| Hispanic race (n = 415) | Current study | ↔ | ↔ | ↔ | ↔ |
| Increasing Height | Current study | ↑ | ↑ | ↔ | ↔ |
| Increasing BMI | Current study | ↑ | ↑ | ↔ | ↑ |
| Diabetes | Current study | 0.8↑ | 0.4 ↓ | 1.8 ↑ | 3.3 ↑ |
non-significant at alpha 0.05
Figure 4 shows effects on each ECG parameter per clinical measurement corrected for all of the other variables in the multiple linear regression. PR interval is most influenced at the extremes of age, with a 20 msec difference between a 20 year old and 80 year old regardless of BMI, height, gender, race, or T2D. Asian and African American race impart a 5 msec increase in PR interval. The largest effect on QRS interval was by gender where females’ QRS interval was 3.5 msec shorter than males, followed by the effect of race where African Americans’ QRS interval was 3.3 msec shorter than Caucasians. Modeling effects on the QT interval corrected by Bazett’s formula reproduced the well-known gender effect with female having a 13.5 msec longer QTcB than males. Also, African American QTcB was 2.5 msec longer than Caucasians.
Regarding T2D, our findings agree with previously observed increase in QTcB interval, by 1.8 msec in this study, hypothesized to contribute to the increased burden of sudden cardiac death.7–9 While this effect is independent of BMI which is included in the original regression model, HR is not included. The effect of HR on QTcB remains despite Bazett’s correction (Figure 3). However, when we added HR to the regression model, the effect of T2D on QTcB diminished (not shown). Interestingly, adding HR to models of PR and QRS did not change the effect of T2D favoring a longer PR interval and a slightly shorter QRS interval. As the correction for QT interval by HR remains a debated topic, on the website we have included functionality to predict three additional QT corrected intervals (Framingham, Fridericia, and Hodges), and we have allowed users to input HR, if known, to predict all normal ranges.25,33–35 However, it is important to consider all corrected QT intervals with caution when HR is known as HR is then an independent variable and also part of the dependent variable.
Limitations of the study include lack of standardized recording of parameters such as height and weight and the absence of research parameters such as chest diameter, which was found to be a significant variable in earlier studies.2,39 Also, designation as “normal” by clinical cardiologists may include a selection bias, such as patients with low HR automatically designated as abnormal when they may represent physiologic bradycardia. Thus, groups such as young athletes may be underrepresented. Given the known overcorrection of QTc by the Bazett formula at lower heart rates, the lower bounds of QTcB may be too strict in defining a short QTcB. In addition, some subjects in our study may have undiagnosed cardiovascular disease or be taking undocumented medications that affect an ECG measurement. The impact of such variables would likely be small given the large number of subjects and overall high positive predictive value of the algorithm. Finally, this study used the original interpretations and intervals as calculated when the ECG was entered into the EMR instead of overreading the images using a research protocol.
CONCLUSION
This study includes a well-characterized cohort, free of documented cardiovascular disease and medications affecting ECG parameters. Since subjects represented all patients having an ECG meeting those conditions, the study suffers from fewer biases than may be found in clinical trials or more homogeneous populations. While large reference tables of normal values are impractical, individualized normal ranges generated from equations as done in our web application could be used to integrate personalized normal ranges into electronic ECG readouts. Future definitions of “out of range” values could take into account such personalized information. The quantification of these effects can be used to control for confounding in studies seeking genetic or clinical determinants of conduction parameters.
Acknowledgments
The dataset used for the analyses described were obtained from Vanderbilt University Medical Center’s Synthetic Derivative, which is supported by institutional funding and by the Vanderbilt CTSA grant 1UL1RR024975 from NCRR/NIH. Additional support was provided by U01 HG04603, “VGER: Vanderbilt Genome-Electronic Records Project”, a node in the NHGRI-supported eMERGE (Electronic Records and Genomics) Network.
Abbreviation Glossary
- BMI
Body Mass Index
- bpm
beats per minute
- ECG
Electrocardiogram
- EMR
Electronic Medical Record
- HR
Heart Rate
- msec
milliseconds
- NLP
Natural Language Processing
- QTcB
QT interval corrected with Bazett’s formula
- T2D
Type 2 diabetes
Footnotes
Publisher's Disclaimer: This is a PDF file of an unedited manuscript that has been accepted for publication. As a service to our customers we are providing this early version of the manuscript. The manuscript will undergo copyediting, typesetting, and review of the resulting proof before it is published in its final citable form. Please note that during the production process errors may be discovered which could affect the content, and all legal disclaimers that apply to the journal pertain.
References
- 1.SIMONSON E. Principles for determination of electrocardiographic normal standards. Am Heart J. 1956;52(2):163–166. doi: 10.1016/0002-8703(56)90255-1. [DOI] [PubMed] [Google Scholar]
- 2.Pipberger HV, Goldman MJ, Littmann D, et al. Correlations of the orthogonal electrocardiogram and vectorcardiogram with consitutional variables in 518 normal men. Circulation. 1967;35(3):536–551. doi: 10.1161/01.cir.35.3.536. [DOI] [PubMed] [Google Scholar]
- 3.Pipberger HV, Simonson E, Lopez EA, Araoye MA, Pipberger HA. The electrocardiogram in epidemiologic investigations. A new classification system. Circulation. 1982;65(7):1456–1464. doi: 10.1161/01.cir.65.7.1456. [DOI] [PubMed] [Google Scholar]
- 4.Vitelli LL, Crow RS, Shahar E, et al. Electrocardiographic findings in a healthy biracial population. Atherosclerosis Risk in Communities (ARIC) Study Investigators. Am J Cardiol. 1998;81(4):453–459. doi: 10.1016/s0002-9149(97)00937-5. [DOI] [PubMed] [Google Scholar]
- 5.Mason JW, Ramseth DJ, Chanter DO, et al. Electrocardiographic reference ranges derived from 79,743 ambulatory subjects. J Electrocardiol. 2007;40(3):228–234. doi: 10.1016/j.jelectrocard.2006.09.003. [DOI] [PubMed] [Google Scholar]
- 6.Libby P. BRAUWALD’S HEART DISEASE: A Texbook of Cardiovascular Medicine. 8. Philadelphia PA: Saunders Elsevier; 2008. pp. 19103–2899. [Google Scholar]
- 7.Brown DW, Giles WH, Greenlund KJ, Valdez R, Croft JB. Impaired fasting glucose, diabetes mellitus, and cardiovascular disease risk factors are associated with prolonged QTc duration. Results from the Third National Health and Nutrition Examination Survey. J Cardiovasc Risk. 2001;8(4):227–233. doi: 10.1177/174182670100800407. [DOI] [PubMed] [Google Scholar]
- 8.van Noord C, Sturkenboom MCJM, Straus SMJM, et al. Serum glucose and insulin are associated with QTc and RR intervals in nondiabetic elderly. Eur J Endocrinol. 2010;162(2):241–248. doi: 10.1530/EJE-09-0878. [DOI] [PubMed] [Google Scholar]
- 9.Stern S, Sclarowsky S. The ECG in diabetes mellitus. Circulation. 2009;120(16):1633–1636. doi: 10.1161/CIRCULATIONAHA.109.897496. [DOI] [PubMed] [Google Scholar]
- 10.Holm H, Gudbjartsson DF, Arnar DO, et al. Several common variants modulate heart rate, PR interval and QRS duration. Nat Genet. 2010;42(2):117–122. doi: 10.1038/ng.511. [DOI] [PubMed] [Google Scholar]
- 11.Newton-Cheh C, Guo C, Wang TJ, et al. Genome-wide association study of electrocardiographic and heart rate variability traits: the Framingham Heart Study. BMC Med Genet. 2007;8 (Suppl 1):S7. doi: 10.1186/1471-2350-8-S1-S7. [DOI] [PMC free article] [PubMed] [Google Scholar]
- 12.Smith JG, Lowe JK, Kovvali S, et al. Genome-wide association study of electrocardiographic conduction measures in an isolated founder population: Kosrae. Heart Rhythm. 2009;6(5):634–641. doi: 10.1016/j.hrthm.2009.02.022. [DOI] [PMC free article] [PubMed] [Google Scholar]
- 13.Pfeufer A, van Noord C, Marciante KD, et al. Genome-wide association study of PR interval. Nat Genet. 2010;42(2):153–159. doi: 10.1038/ng.517. [DOI] [PMC free article] [PubMed] [Google Scholar]
- 14.Newton-Cheh C, Eijgelsheim M, Rice KM, et al. Common variants at ten loci influence QT interval duration in the QTGEN Study. Nat Genet. 2009;41(4):399–406. doi: 10.1038/ng.364. [DOI] [PMC free article] [PubMed] [Google Scholar]
- 15.Pfeufer A, Sanna S, Arking DE, et al. Common variants at ten loci modulate the QT interval duration in the QTSCD Study. Nat Genet. 2009;41(4):407–414. doi: 10.1038/ng.362. [DOI] [PMC free article] [PubMed] [Google Scholar]
- 16.Ritchie MD, Denny JC, Crawford DC, et al. Robust replication of genotype-phenotype associations across multiple diseases in an electronic medical record. Am J Hum Genet. 2010;86(4):560–572. doi: 10.1016/j.ajhg.2010.03.003. [DOI] [PMC free article] [PubMed] [Google Scholar]
- 17.Roden DM, Pulley JM, Basford MA, et al. Development of a large-scale de-identified DNA biobank to enable personalized medicine. Clin Pharmacol Ther. 2008;84(3):362–369. doi: 10.1038/clpt.2008.89. [DOI] [PMC free article] [PubMed] [Google Scholar]
- 18.Denny JC, Miller RA, Johnson KB, Spickard A. Development and evaluation of a clinical note section header terminology. AMIA Annu Symp Proc. 2008:156–160. [PMC free article] [PubMed] [Google Scholar]
- 19.Denny JC, Miller RA, Waitman LR, Arrieta MA, Peterson JF. Identifying QT prolongation from ECG impressions using a general-purpose Natural Language Processor. Int J Med Inform. 2009;78 (Suppl 1):S34–42. doi: 10.1016/j.ijmedinf.2008.09.001. [DOI] [PMC free article] [PubMed] [Google Scholar]
- 20.Denny JC, Smithers JD, Miller RA, Spickard A. “Understanding” medical school curriculum content using KnowledgeMap. J Am Med Inform Assoc. 2003;10(4):351–362. doi: 10.1197/jamia.M1176. [DOI] [PMC free article] [PubMed] [Google Scholar]
- 21.Arizona Center for Education and Research on Therapeutics. [Accessed September 20, 2010];Drugs with Risk of Torsades de Pointes. Available at: http://www.azcert.org/medical-pros/drug-lists/list-01.cfm?sort=Generic_name.
- 22.Denny JC, Ritchie MD, Crawford DC, et al. Identification of genomic predictors of atrioventricular conduction: Using electronic medical records as a tool for genome science. Circulation. doi: 10.1161/CIRCULATIONAHA.110.948828. In Revision. [DOI] [PMC free article] [PubMed] [Google Scholar]
- 23.Zhou SH, Helfenbein ED, Lindauer JM, Gregg RE, Feild DQ. Philips QT interval measurement algorithms for diagnostic, ambulatory, and patient monitoring ECG applications. Ann Noninvasive Electrocardiol. 2009;14 (Suppl 1):S3–8. doi: 10.1111/j.1542-474X.2008.00258.x. [DOI] [PMC free article] [PubMed] [Google Scholar]
- 24.Willems JL, Arnaud P, van Bemmel JH, et al. Assessment of the performance of electrocardiographic computer programs with the use of a reference data base. Circulation. 1985;71(3):523–534. doi: 10.1161/01.cir.71.3.523. [DOI] [PubMed] [Google Scholar]
- 25.Bazett H. An analysis of the time relations of electrocardiograms. Heart. 1920;7:353–70. [Google Scholar]
- 26.Dumitrescu L, Ritchie MD, Brown-Gentry K, et al. Assessing the accuracy of observer-reported ancestry in a biorepository linked to electronic medical records. Genet Med. 2010;12(10):648–650. doi: 10.1097/GIM.0b013e3181efe2df. [DOI] [PMC free article] [PubMed] [Google Scholar]
- 27.Schafer JL. Multiple imputation: a primer. Stat Methods Med Res. 1999;8(1):3–15. doi: 10.1177/096228029900800102. [DOI] [PubMed] [Google Scholar]
- 28.Donders ART, van der Heijden GJMG, Stijnen T, Moons KGM. Review: a gentle introduction to imputation of missing values. J Clin Epidemiol. 2006;59(10):1087–1091. doi: 10.1016/j.jclinepi.2006.01.014. [DOI] [PubMed] [Google Scholar]
- 29.The R Project for Statistical Computing. [Accessed July 9, 2010];The R Project for Statistical Computing. Available at: http://www.r-project.org/
- 30.Harrell FE., Jr CRAN - Package Hmisc. [Accessed July 9, 2010];Hmisc: Harrell Miscellaneous. R package version 37-0. Available at: http://cran.r-project.org/web/packages/Hmisc/index.html.
- 31.Luo S, Michler K, Johnston P, Macfarlane PW. A comparison of commonly used QT correction formulae: the effect of heart rate on the QTc of normal ECGs. J Electrocardiol. 2004;37 (Suppl):81–90. doi: 10.1016/j.jelectrocard.2004.08.030. [DOI] [PubMed] [Google Scholar]
- 32.Kobza R, Roos M, Niggli B, et al. Prevalence of long and short QT in a young population of 41,767 predominantly male Swiss conscripts. Heart Rhythm. 2009;6(5):652–657. doi: 10.1016/j.hrthm.2009.01.009. [DOI] [PubMed] [Google Scholar]
- 33.Sagie A, Larson MG, Goldberg RJ, Bengtson JR, Levy D. An improved method for adjusting the QT interval for heart rate (the Framingham Heart Study) Am J Cardiol. 1992;70(7):797–801. doi: 10.1016/0002-9149(92)90562-d. [DOI] [PubMed] [Google Scholar]
- 34.Fridericia L. Die Systolendauer im Elektrokardiogramm bei normalen Menschen und bei Herzkranken. Acta Med Scand. 1920;53:460–486. [Google Scholar]
- 35.Hodges M, Salerno D, Erlien D. Bazett’s QT correction reviewed- Evidence that a linear QT correction for heart rate is better. J Am Coll Cardiol. 1983;1:694. [Google Scholar]
- 36.Wolpert C, Veltmann C, Schimpf R, et al. Is a narrow and tall QRS complex an ECG marker for sudden death? Heart Rhythm. 2008;5(9):1339–1345. doi: 10.1016/j.hrthm.2008.05.019. [DOI] [PMC free article] [PubMed] [Google Scholar]
- 37.Macfarlane P, Lawrie T. Comprehensive Electrocardiology: The normal electrocariogram and vectorcardiogram. Oxford, U.K: Pergamon; 1989. [Google Scholar]
- 38.Macfarlane PW, McLaughlin SC, Devine B, Yang TF. Effects of age, sex, and race on ECG interval measurements. J Electrocardiol. 1994;27 (Suppl):14–19. doi: 10.1016/s0022-0736(94)80039-1. [DOI] [PubMed] [Google Scholar]
- 39.Nemati M, McCaughan D, Doyle JT, Pipberger HV. The influence of constitutional variables on orthogonal electrocardiograms of normal women. Circulation. 1977;56(6):989–996. doi: 10.1161/01.cir.56.6.989. [DOI] [PubMed] [Google Scholar]