

Summary
Purpose
To analyze activity of identified dentate gyrus granular cells and interneurons during pathological high frequency oscillations.
Methods
Pilocarpine treated epileptic mice were anesthetized with urethane and ketamine. Their heads were fixed in a stereotaxic frame. Extracellular unit activity was recoded with glass micropipettes while multiunit and local field activity was simultaneously recorded with attached tungsten microelectrodes. After electrophysiological experiments recorded cells were labeled by neurobiotin and visualized by immunohistochemical methods.
Results
Pathological high frequency oscillations (pHFOs) containing more than 3 waves were recorded in our experiments, but pathological single population spikes also occurred. Identified granular cells discharged preferentially in synchrony with pHFOs and single population spikes while interneurons decreased their discharge frequency during this time.
Discussion
These experiments provide additional confirmation that pHFOs in the dentate gyrus represent single or recurrent population spikes, which in turn reflect summated hypersynchronous discharges of principal cells.
Keywords: pathological high frequency oscillations, epilepsy, pilocarpine, mice
Introduction
There is increasing interest in pathological high-frequency oscillations (pHFOs) as biomarkers of the epileptogenic region in patients with focal epilepsy (Staba et al., 2004, Le Van Quyen et al., 2006, Rampp and Stefan, 2006, Ochi et al., 2007, Staba et al., 2007, Worrell et al., 2008, Engel et al., 2009, Jacobs et al., 2009, Schevon et al., 2009), and as a reflection of the fundamental neuronal disturbances underlying epileptogenicity, as studied in animal models (Bragin et al., 1999, Ponomarenko et al., 2003, Dzhala and Staley, 2004, Foffani et al., 2007). Whereas normal ripple frequency oscillations (100–200 Hz) are believed to represent summated inhibitory postsynaptic potentials (IPSP) (Ylinen et al., 1995), several lines of evidence suggest that pathological fast ripple (FR) frequency oscillations (200–600 Hz) are generated by action potentials of synchronously bursting principal cells and therefore represent recurrent population spikes (Bragin et al., 2002, Dzhala and Staley, 2004, Bragin et al., 2007). Direct support for this hypothesis, however, is absent. The present experiments use tungsten and micropipette microelectrodes to simultaneously record field potentials and unit activity, in parallel with juxtacellular labeling, to characterize the neuronal generators of pathological epileptiform electrographic events in the dentate gyrus (DG) of the pilocarpine mouse model of mesial temporal lobe epilepsy. Because normal ripple oscillations do not occur in the DG of mice, all oscillations above 100 Hz are pHFOs in this model, and spontaneously occurring single population spikes in the DG are also considered to be pathological epileptiform events (Bragin et al., 1995a, Csicsvari et al., 2003).
Methods
All procedures described here were approved by the University of California, Los Angeles, Institutional Animal Care and Use Committee.
Status Epilepticus induction
Status Epilepticus (SE) was induced in adult male C57B6/J mice (15–30g; Harlan, Indianapolis, IN) through pilocarpine hydrochloride injection (320mg/kg, s.c.; Sigma, St. Louis, MO). Thirty min before, animals received a single injection of methyl-scopolamine bromide (1mg/kg, s.c.; Sigma) to limit pilocarpine peripheral toxic effects. Status epilepticus was terminated after two hours by three subcutaneous injection of diazepam (5.0 mg/kg) at 30 minutes intervals.
Seizure Monitoring
Beginning 24 h after injection, animals were video monitored for seizure detection 24 h/day. Due to necessity to change video-tapes every day and limited personnel, monitoring was performed 5 days/week and only mice that showed clear behavioral seizures (stages 3–5, Racine scale) were selected for experiments.
Microelectrode preparation
Glass microelectrode pipettes were pulled from borosilicate capillaries (ID=0.84mm, OD=1.5mm; WPI, Sarasota, FL). Under the microscope, a bipolar tungsten microelectrode (20 μm in diameter; California Fine Wire Company, Grover Beach, CA) with 1.0-mm vertical tip separation was glued to the pipette with the longer wire being placed ≤500 μm from the tip of the pipette. The impedance of tungsten microelectrodes was between 80Kom and 150Kom in the physiological solution,
Electrophysiological Recordings and Labeling
One to four months after status epilepticus mice that showed spontaneous behavioral seizures (n=86) were taken for electrophysiological experiments. They were anesthetized with urethane (1.25g/kg, i.m.) and their heads were fixed in a stereotaxic frame for in vivo electrophysiological recordings followed by juxtacellular labeling. Supplemental doses of ketamine and xylazine (20 and 2 mg/kg, i.m.; respectively) were administered as needed. Body temperature was maintained with a heating pad. Electrophysiological activity was recorded from the DG of dorsal (AP = −2.0mm from bregma, L = 1.5mm) and ventral hippocampus (AP = −3.0mm from bregma, L = 2.5mm). Electrode depth was adjusted based on perforant path evoked response profiles (AP = −4.0mm from bregma, L = 3.0mm, DV = −3.5mm).
Simultaneous local field potentials were recorded by the tungsten microelectrode and extracellular unit activity by the glass pipette (15–25MΩ) filled with 1.5% neurobiotin (Vector Laboratories, Burlingame, CA) in 0.5M NaCl. Field potentials were recorded from 0.1 Hz to 1.0 kHz frequency band and units from 0.1 Hz to 5.0 kHz (both sampled at 20kHz). Following recordings, the microelectrode was advanced towards the cell, which was juxtacellularly labeled by a positive current 50% duty cycle of 200 ms for 20 min. The current intensity was slowly increased (usually ≤10ηA) until the recorded neuron began discharging in response to the stimulation.
To exclude interference between multiple labeling only one neuron was labeled in each mouse during each electrophysiological experiment.
Tissue processing
Approximately 2 hours after labeling, animals received an overdose of pentobarbital and, once profoundly anesthetized, were transcardially perfused with 50 ml physiological saline (NaCl 0.9%) followed by 100 ml of 4% paraformaldehyde. Brains were removed and postfixed at 4°C overnight. They were then embedded in 3% agarose and sliced at 60 μm coronal sections in a vibrating microtome (Leica, Heidelberg, Germany).
Immunofluorescence
Non-specific binding was blocked by 10% normal donkey serum (NDS, Jackson ImmunoResearch Laboratiories, West Grove, PA) for 2h before overnight incubation with the primary antibodies: rabbit anti-Prox1 (5–10 ug/ml) and mouse anti-GAD67 (1:1000, Chemicon International, Temecula, CA). After having been rinsed, secondary antibodies Alexa Fluor 594-conjugated donkey anti-rabbit IgG and Alexa Fluor-conjugated 488 donkey anti-mouse IgG (Molecular Probes, Eugene, OR) were applied at a dilution of 1:3000 for 4h. Neurobiotin-loaded neurons were revealed by 1:3000 Alexa Fluor 350-streptavidin conjugate (Molecular Probes). After having been rinsed, sections were mounted under cover slips with Vectashield mounting medium (Vector Laboratories).
Immunohistochemistry
Slices were demounted and thoroughly washed in phosphate-buffered saline (PBS). Endogenous peroxidase activity was quenched by hydrogen peroxide for 30min. and non-specific binding was blocked by 10% normal goat serum (NGS, Jackson ImmunoResearch Laboratiories, West Grove, PA) for 2h. Neurobiotin-loaded neurons were developed using the Vectastain Elite ABC kit (Vector Laboratories) and revealed by diaminobenzidine/nickel. Sections were also counterstained with Cresyl Violet and slides were dehydrated and embedded in Permount mounting medium (Fisher Scientific, Pittsburgh, PA).
Slides were viewed and analyzed with the Zeiss microscope and AxioVision (version 4.6) software (Zeiss, Gottingen, Germany).
Data Analysis
Analysis of electrophysiological data
Raw electrographic data were separated by digital filtering of electrical activity for pHFOs – 100–600 and multiunit activity >600 Hz. From these records pHFOs were detected by setting the threshold as 3 standard deviations from the mean amplitude of the record. For multiunit activity all units with amplitude higher than 2 standard deviations from the mean amplitude of the record were taken for analysis. Detected pHFOs on the filtered records were compared with the same raw data file. Activity that contained spontaneous population spikes similar to the population spikes evoked by perforant path stimulation were considered pathological because spontaneous population spikes have never been described in naive animals (Bragin et al., 1995b, Penttonen et al., 1997) (see Fig. 2 for details).
Fig. 2.

Discharges of an identified dentate gyrus granular cell during single population spikes and pathological high frequency oscillations (pHFOs). A – an example of two single population spikes (diamonds) and pHFOs (bracket) accompanied by discharges of the granular cell. A1 – raw data recorded with 0.1Hz – 5.0kHz frequency band. A2 – the same data filtered with frequency band 200–500Hz. A3 – discharges of the granular cell (labeled in B) recorded by the glass microelectrode with the tip located 200 μm from the tungsten microelectrode which recorded the field potentials in A1. A4 – color coded power spectrogram of the pHFO. Numbers on the color bar indicate energy in μV2.
B – the granular cell labeled by neurobiotin after the completion of the electrophysiological experiments. Some dendritic branches are enhanced with Photoshop. C – an evoked field potential in response to perforant path stimulation. The beginning of a population EPSP indicated by the arrow is followed by two population spikes (diamonds). D. Perievent histogram of the granular cell discharges during 232 population spikes (red) where “0” is the beginning of the population spike.
Electrophysiological characteristics of neuron discharges including rate of spontaneous discharges and pattern of discharges were compared during pHFOs and between pHFOs. Spike width was measured from the negative to the positive peak of the spike and averaged for 100 events. Significance of the data was calculated using the Student’s t-test criteria.
The probability of single units discharging within or outside the period of the population spike was calculated within three time windows: 20 ms up to 5 ms before of the peak of population spike; within the period of the population spike, which was 5 ms before up to 5 ms after the peak; and finally 5 ms up to 20 ms after the termination of the population spike. Records with simultaneous recordings of identified granular cells or interneurons and local field potentials containing at least 200 pHFOs were selected for further analysis.
These results were further correlated with neuron morphology identified by immunohistochemical methods (see Fig. 1 and 2 for details).
Fig. 1.

Examples of granular cells (a, b, c) and interneurons (d, e, f) labeled during electrophysiological experiments. Dashed lines indicate the border of the granular cell layer (g) and the hilus (h). Calibration marks are 50 μm
Analysis of neurons labeled during juxtacellular experiments
Neurons labeled during electrophysiological experiments were identified microscopically. Initially GABA-ergic neurons were separated from granular cells on the basis of immunohistochemical reaction under the fluorescent microscope. Slides were viewed and analyzed with a Zeiss microscope and AxioVision software.
Separation between granular cells and interneurons
Granular cells and interneurons were characterized by the shape of their soma and arborization of their axons and dendrites and their location within the layers of the DG. Units were identified electrophysiologically as granular cells or interneurons by their response to perforant path stimulation and also by mean firing rate, which is less than 0.5Hz for granular cells and 3 Hz or higher for interneurons.
Results
The experiments were carried out on 86 mice that showed behavioral spontaneous seizures. Sixty seven mice with single labeled neurons were selected for further analysis of the data. pHFOs and single population spikes were observed in 45% of animals (n=30). Twenty six granular cells (Fig. 1a,b,c) and 4 interneurons were identified by juxtacellular labeling. All 4 interneurons were presumed basket cells because they were located near the granular layer (Fig. 1d,e,f). Similar to what has been described in rats (Penttonen et al., 1997), granular cells fired rhythmic single or occasionally multiple spikes at 0.1–0.2 Hz usually in association with the extracellular slow rhythm. The rate of interneuron discharges varied from 1 Hz to 12 Hz (mean 4.3±3.0). Granular cell mean spike width was 353 ± 64 μsec, interneuron spike was width 329± 45 μsec. Differences were not significant (p>0.05). There was no significant differences in the in the spike width when cells discharged during or outside of pHFOs.
Two types of pathological dentate gyrus field electrical activity patterns were identified in the epileptic pilocarpine treated mice: pHFOs which contained more than 3 waves based on consecutive cycles that crossed the threshold level and spontaneous single population spikes. These oscillations were similar to those already described in epileptic rats in our earlier publications (Bragin et al., 1999, Bragin et al., 2007). Examples of these pathological events are presented in the Figure 2.
Evoked responses to electrical stimulation (Fig. 2C) indicate that the tungsten microelectrode recorded local field potential is located in the granular layer and the picture in Fig. 2B indicates that the neuron recorded in Fig. 2A is a granular cell. Spontaneous population spikes occurred as single events and also as oscillations (Fig. 2A1). The granular cell preferentially discharged during single population spikes as well as during the pHFO. This indicates that spontaneous single population spikes and pHFOs in the frequency range 100–500 Hz have similar mechanisms of generation. Analysis of responses of all labeled neurons (n=26) showed that the probability of a granular cell discharging during pHFOs varied between 20% to 50%. The involvement of granular cell discharges did not depend on the amplitude of the pHFO. Granular cells may discharge during low amplitude pHFOs and not during high amplitude events. In some pHFOs a given granular cell can discharge at the end of the event and in other events at very beginning.
Another example illustrating that pHFOs consist of bursts of population spikes is presented in Figure 3. The wide band activity was recorded from the granular layer and filtered off line. 370 pHFOs were detected on the basis of the first negative peak of the band pass filtered oscillations and then raw data and multiunit activity (high pass 700Hz signal) were averaged. The figure illustrates that within the granular layer, pHFOs are superimposed on the positive wave which on the basis of existing publications (Bragin et al., 1995b, Ylinen et al., 1995) and the data presented in Figure 2 is a population EPSP. The averaged multiunit activity also forms an oscillation like pattern (Fig. 3b3) and a perievent histogram (Fig. 3b4) illustrates that the synchrony of multiunit discharges has its maximum during pHFOs.
Fig. 3.
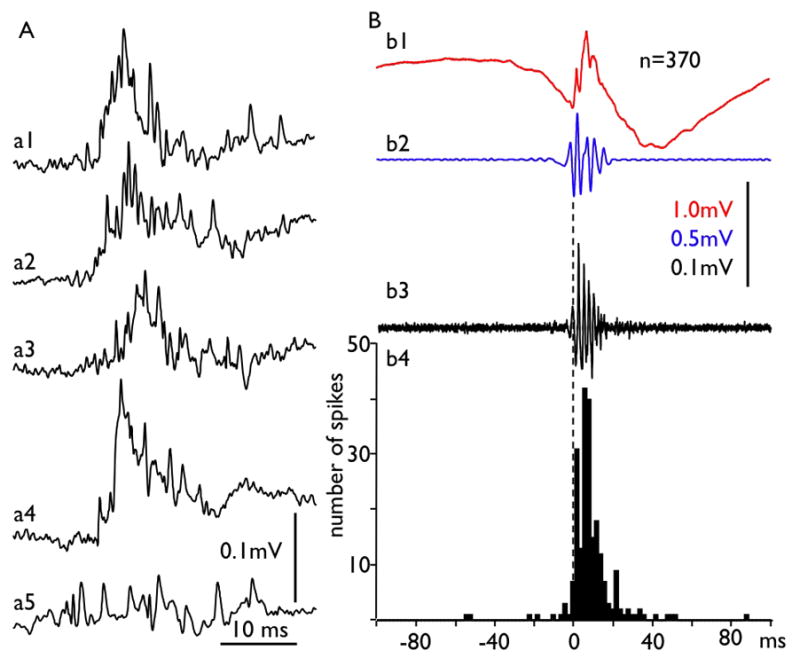
Multiunit discharges and pHFOs. Examples of multiunit discharges from a single mouse are presented in part A (a1–a5) recorded with frequency band 0.1 to 5000 Hz to illustrate their “chaotic” nature. B. Average of 370 pHFOs (b1) recorded from the same experiment in wide band mode. The detection was performed at the first negative peak of the oscillation filtered with frequency band 100–500Hz (b2 and dashed line). b3 is the average of multiunit discharges. b4 – perievent histogram of mutiunit activity. The time bin for the histogram is 2 ms. Notice that in spite of the chaotic feature of the multiunit discharges (part A), on average both raw data records and high pass filtered multiunit discharges show rhytmicity in the pHFO frequency band. This figure confirms the hypothesis that pHFOs represent a field of hypersynchronized action potentials of multiple neuron discharges.
All interneurons decreased their firing frequency during pHFOs as illustrated in the Figure 4. In 4A an average of 24 local field potentials containing pHFOs (red line) is presented with a histogram of multiunit activity which represents discharges of granular cells. The frequency of multiunit discharges increased during the initial part of the local field potential. The interneuron, however, decreased its discharge frequency at the same time (Fig. 4B). The response to electrical perforant path stimulation (Fig. 4C) indicates that both the glass microelectrode recorded interneuron activity and the tungsten microelectrode recorded multiunit activity are located within the granular layer. Figure 4D illustrates a single event with an interneuron discharging before the onset of a pHFO and a burst of multiunit discharges. Power spectral analysis (Figure 4E) illustrates that the pHFOs contain oscillations up to 500 Hz.
Fig. 4.

Suppression of discharges of an identified interneuron (Fig. 1d) during pHFOs. A. Perievent histogram of the interneuron triggered at the peak of the local field potentials (n=24, dashed line). B. Perievent histogram of simultaneously recorded multiunit activity that predominantly represents discharges of granular cells. C. Examples of an evoked potential in response to perforant path stimulation recorded for an interneuron by a glass microelectrode (top trace) and multiunit activity and local field potential by a tungsten microelectrode, located 500 μm apart within the granular layer. The shape of the evoked potential confirms, in addition to the histology, that both electrodes are located within the granular layer. D. Examples of discharges of an interneuron (int) and multiunit activity (mua) during a single pHFO. E. Color coded map of the local field potentials power in the frequency band 100Hz to 500 Hz.
In order to analyze the pattern of granular cell and interneuron firing during population spikes, simultaneously recorded local field potentials from the dentate gyrus granular layer containing at least 200 pHFOs and activity of ten identified granular cells and 4 interneurons were selected. pHFOs containing 2133 population spikes were detected and perievent histograms of identified granular cell unit discharges were merged in two windows 20 milliseconds before and 20 milliseconds after the peak of the population spike (Fig. 5A). Similarly the unit activity of interneurons was merged for pHFOs containing 1975 population spikes (Fig. 5B). The analysis showed that the probability of granular cell firing during the population spike window was more than twice as high as in the window preceding the population spike and in window of 20 msec before and after the peak of population spike.
Fig. 5.

Averaged discharges for 10 granular cells and 4 interneurons before, during (gray strip) and after a population spike recorded in the vicinity of the neurons. A and B represent perievent histograms of probabilities for granular cells and interneurons, where the zero point was the maximum amplitude of the population spike registered from the granular layer. Note that the peak reduction in the probability of interneuron firing (left dashed line) precedes the peak increase in probability of granular cell firing (right dashed line) by 2–3 msec.
At the same time the probability interneuron firing decreased during the population spike. Interestingly, the minimum of interneuron firing during the population spike occurred 2–3 ms earlier (Fig. 5, left dashed line) than the peak of granular cell firing (Fig. 5, right dashed line).
Discussion
This study describes, for the first time, the properties of pHFOs and single population spikes in the dentate gyrus of pilocarpine treated mice. The results of this study confirm our previously published data suggesting that pHFOs reflect bursts of population spikes (Bragin et al., 2007). In this study we have provided more definitive evidence that pHFOs are field potentials of hypersynchronized action potentials of principal cells and that presumed basket cells do not discharge during pHFOs. As shown previously in voltage-depth profile analyses of pHFOs, their shape changes significantly in both directions outside of the cellular layer (Bragin et al., 2007).
Another pathological characteristic of dentate gyrus electrical activity is the occurrence of spontaneous single population spikes. Although numerous findings have characterized evoked population spikes recorded in the dentate gyrus of rats and mice evoked by electrical stimulation (Bernard and Wheal, 1996, Meier and Dudek, 1996, Buckmaster and Dudek, 1997, Patrylo et al., 1999), spontaneous population spikes or bursts of population spikes have never been described in the dentate gyrus in normal animals.
Our data confirm that pHFOs and spontaneous single population spikes reflect similar neuronal mechanisms. Spontaneous population spikes, however, do not necessary coincide with “interictal spikes” as used in the clinical EEG literature. The latter, defined as any event with duration of less than 70 ms, could include many other electrographic phenomena. Although some components of EEG interictal spikes may contain population spikes reflecting spatial hypersynchronization of action potentials, their generation can be much more variable and complex (de Curtis and Avanzini, 2001).
Why pathological epileptiform discharges occur as both pHFOs and single population spikes in the DG is unclear. Both reflect a high degree of synchronous activity of DG granular cells, but only pHFOs reflect neuronal bursting. While hypersynchrony and bursting are both characteristics of epileptogenicity they presumably result from different pathophysiological mechanisms that can be dissociated.
Single population spikes have not been described in freely moving animals or patients with epilepsy. It is possible that single population spikes occur only under anesthesia, as shown in the present study, and not under freely moving conditions. Additional studies are needed to resolve this issue.
Our data demonstrated that granular cell and interneuron networks discharge differently during pHFOs. While granular cells increase discharge frequency during pHFOs and their discharges are locked to the occurrence of population spikes (see figures 2, 3 and 5), basket cell interneurons decrease their discharge frequency during population spikes (Fig. 4, 5).
Although the timing of increased granular cell and decreased interneuron discharge with respect to spontaneous population spikes and pHFOs was variable for the single cell analyses, it is intriguing that the averaged perievent histogram suggests that interneurons decrease firing before granular cells increase firing. This could reflect a disinhibitory role in the generation of these abnormal events, as suggested by the fact that bicuculline increases the spatial extend of pHFO generating tissue (Bragin et al., 2002).
During ripple oscillations in normal hippocampus, basket cells increase their discharge frequency while axo-axonic and oriens–lacunosum-moleculare cells decrease firing (Klausberger et al., 2003). These data demonstrate a diversity of functions of interneurons, innervating distinct domains of principal cells on the coordination of the activity of the latter. There are no HFO oscillations in the normal dentate gyrus. Our data show that basket cells in the dentate gyrus behave differently during pHFOs than they do during normal ripple oscillations in the CA1 area of hippocampus. In the first case they decrease firing while in the second they increase firing and drive the oscillations (Ylinen et al., 1995). The mechanisms of suppression of basket cell discharges during pHFOs are not known. Elucidation could provide important insights into the neuronal mechanisms of epileptic burst firing.
Acknowledgments
We would like to thank Michel Le van Quyen, Tony Fields and Josephine Ruidera for their excellent assistance with the experiments and data analysis described in this paper. We confirm that we have read the Journal’s position on issues involved in ethical publication and affirm that this report is consistent with those guidelines.
Supported by NIH grants NS 02808 and NS 33310
Footnotes
Disclosure: None of the authors has any conflict of interest related to this paper to disclose.
References
- Bernard C, Wheal HV. A role for synaptic and network plasticity in controlling epileptiform activity in CA1 in the kainic acid-lesioned rat hippocampus in vitro. J Physiol (Lond) 1996;495:127–142. doi: 10.1113/jphysiol.1996.sp021579. [DOI] [PMC free article] [PubMed] [Google Scholar]
- Bragin A, Engel J, Jr, Wilson CL, Fried I, Mathern GW. Hippocampal and entorhinal cortex high-frequency oscillations (100–500 Hz) in human epileptic brain and in kainic acid-treated rats with chronic seizures. Epilepsia. 1999;40:127–137. doi: 10.1111/j.1528-1157.1999.tb02065.x. [DOI] [PubMed] [Google Scholar]
- Bragin A, Jando G, Nadasdy Z, Hetke J, Wise K, Buzsaki G. Gamma (40–100 Hz) oscillation in the hippocampus of the behaving rat. J Neuroscie. 1995a;15:47–60. doi: 10.1523/JNEUROSCI.15-01-00047.1995. [DOI] [PMC free article] [PubMed] [Google Scholar]
- Bragin A, Jando G, Nadasdy Z, van Landeghem M, Buzsaki G. Dentate EEG spikes and associated interneuronal population bursts in the hippocampal hilar region of the rat. J Neurophysiol. 1995b;73:1691–1705. doi: 10.1152/jn.1995.73.4.1691. [DOI] [PubMed] [Google Scholar]
- Bragin A, Mody I, Wilson CL, Engel J., Jr Local Generation of Fast Ripples in Epileptic Brain. J Neuroscience. 2002;22:2012–2021. doi: 10.1523/JNEUROSCI.22-05-02012.2002. [DOI] [PMC free article] [PubMed] [Google Scholar]
- Bragin A, Wilson CL, Engel J. Voltage Depth Profiles of High-frequency Oscillations after Kainic Acid-induced Status Epilepticus. Epilepsia. 2007;48:35–40. doi: 10.1111/j.1528-1167.2007.01287.x. [DOI] [PubMed] [Google Scholar]
- Buckmaster PS, Dudek FE. Network properties of the dentate gyrus in epileptic rats with hilar neuron loss and granule cell axon reorganization. J Neurophysiol. 1997;77:2685–2696. doi: 10.1152/jn.1997.77.5.2685. [DOI] [PubMed] [Google Scholar]
- Csicsvari J, Jamieson B, Wise KD, Buzsaki G. Mechanisms of Gamma Oscillations in the Hippocampus of the Behaving Rat. Neuron. 2003;37:311–322. doi: 10.1016/s0896-6273(02)01169-8. [DOI] [PubMed] [Google Scholar]
- de Curtis M, Avanzini G. Interictal spikes in focal epileptogenesis. Prog Neurobiol. 2001;63:541–567. doi: 10.1016/s0301-0082(00)00026-5. [DOI] [PubMed] [Google Scholar]
- Dzhala VI, Staley KJ. Mechanisms of Fast Ripples in the Hippocampus. J Neurosci. 2004;24:8896–8906. doi: 10.1523/JNEUROSCI.3112-04.2004. [DOI] [PMC free article] [PubMed] [Google Scholar]
- Engel JJ, Bragin A, Staba R, Mody I. High-frequency oscillations: What is normal and what is not? Epilepsia. 2009;50:598–604. doi: 10.1111/j.1528-1167.2008.01917.x. [DOI] [PubMed] [Google Scholar]
- Foffani G, Uzcategui YG, Gal B, Menendez de la Prida L. Reduced Spike-Timing Reliability Correlates with the Emergence of Fast Ripples in the Rat Epileptic Hippocampus. Neuron. 2007;55:930–941. doi: 10.1016/j.neuron.2007.07.040. [DOI] [PubMed] [Google Scholar]
- Jacobs J, LeVan P, Chatillon C-E, Olivier A, Dubeau F, Gotman J. High frequency oscillations in intracranial EEGs mark epileptogenicity rather than lesion type. Brain. 2009;132:1022–1037. doi: 10.1093/brain/awn351. [DOI] [PMC free article] [PubMed] [Google Scholar]
- Klausberger T, Magill PJ, Marton LF, Roberts JD, Cobden PM, Buzsaki G, Somogyi P. Brain-state- and cell-type-specific firing of hippocampal interneurons in vivo. Nature. 2003;421:844–848. doi: 10.1038/nature01374. [DOI] [PubMed] [Google Scholar]
- Le Van Quyen M, Khalilov I, Ben-Ari Y. Nature and nurture in brain development and neurological disorders. Trends in Neurosciences. 2006;29:419–427. doi: 10.1016/j.tins.2006.06.001. [DOI] [PubMed] [Google Scholar]
- Meier C, Dudek F. Spontaneous and stimulation-induced synchronized burst after discharges in the isolated CA1 of kainate-treated rats. J of Neurophysiol. 1996;76:2231–2239. doi: 10.1152/jn.1996.76.4.2231. [DOI] [PubMed] [Google Scholar]
- Ochi A, Otsubo H, Donner EJ, Elliott I, Iwata R, Funaki T, Akizuki Y, Akiyama T, Imai K, Rutka JT, Snead OC. Dynamic Changes of Ictal High-Frequency Oscillations in Neocortical Epilepsy: Using Multiple Band Frequency Analysis. Epilepsia. 2007;48:286–296. doi: 10.1111/j.1528-1167.2007.00923.x. [DOI] [PubMed] [Google Scholar]
- Patrylo PR, Schweitzer JS, Dudek FE. Abnormal responses to perforant path stimulation in the dentate gyrus of slices from rats with kainate-induced epilepsy and mossy fiber reorganization. Epilepsy Res. 1999;36:31–42. doi: 10.1016/s0920-1211(99)00022-4. [DOI] [PubMed] [Google Scholar]
- Penttonen M, Kamondi A, Sik A, Acsady L, Buzsaki G. Feed-forward and feed-back activation of the dentate gyrus in vivo during dentate spikes and sharp wave bursts. Hippocampus. 2003;7:437–450. doi: 10.1002/(SICI)1098-1063(1997)7:4<437::AID-HIPO9>3.0.CO;2-F. 1997. [DOI] [PubMed] [Google Scholar]
- Ponomarenko AA, Korotkova TM, Haas HL. High frequency (200 Hz) oscillations and firing patterns in the basolateral amygdala and dorsal endopiriform nucleus of the behaving rat. Behav Brain Res. 141:123–129. doi: 10.1016/s0166-4328(02)00327-3. [DOI] [PubMed] [Google Scholar]
- Rampp S, Stefan H. Fast activity as a surrogate marker of epileptic network function? Clinical Neurophysiol. 2006;117:2111–2117. doi: 10.1016/j.clinph.2006.02.023. [DOI] [PubMed] [Google Scholar]
- Schevon CA, Trevelyan AJ, Schroeder CE, Goodman RR, McKhann G, Jr, Emerson RG. Spatial characterization of interictal high frequency oscillations in epileptic neocortex. Brain. 2009;132:3047–3059. doi: 10.1093/brain/awp222. [DOI] [PMC free article] [PubMed] [Google Scholar]
- Staba RJ, Frighetto L, Behnke EJ, Mathern GW, Fields T, Bragin A, Ogren J, Fried I, Wilson CL, Engel J. Increased Fast ripple to ripple Ratios Correlate with Reduced Hippocampal Volumes and Neuron Loss in Temporal Lobe Epilepsy Patients. Epilepsia. 2007;48:2130–2138. doi: 10.1111/j.1528-1167.2007.01225.x. [DOI] [PubMed] [Google Scholar]
- Staba RJ, Wilson CL, Bragin A, Jhung D, Fried I, Engel J., Jr High-frequency oscillations recorded in human medial temporal lobe during sleep. Ann Neurol. 2004;56:108–115. doi: 10.1002/ana.20164. [DOI] [PubMed] [Google Scholar]
- Worrell GA, Gardner AB, Stead SM, Hu S, Goerss S, Cascino GJ, Meyer FB, Marsh R, Litt B. High-frequency oscillations in human temporal lobe: simultaneous microwire and clinical macroelectrode recordings. Brain. 2008;131:928–937. doi: 10.1093/brain/awn006. [DOI] [PMC free article] [PubMed] [Google Scholar]
- Ylinen A, Bragin A, Nadasdy Z, Jando G, Szabo I, Sik A, Buzsaki G. Sharp wave-associated high-frequency oscillation (200 Hz) in the intact hippocampus: network and intracellular mechanisms. J Neurosci. 1995;15:30–46. doi: 10.1523/JNEUROSCI.15-01-00030.1995. [DOI] [PMC free article] [PubMed] [Google Scholar]