

Abstract
Imaging is essential in accurately detecting, staging, and treating primary liver cancer (hepatocellular carcinoma (HCC)), one of the most prevalent and lethal malignancies. We developed a novel multifunctional nanoparticle (NP) specifically targeting glypican-3 (GPC3), a proteoglycan implicated in promotion of cell growth that is over-expressed in most HCCs. Quantitative real-time PCR was performed to confirm the differential GPC3 expression in two human HCC cells, Hep G2 (high) and SK-HEP-1 (negligible). These cells were treated with biotin-conjugated GPC3 monoclonal antibody (αGPC3) and subsequently targeted using superparamagnetic iron oxide NPs conjugated to streptavidin and Alexa Fluor 647. Flow cytometry demonstrated that only GPC3-expressing Hep G2 cells were specifically targeted using this αGPC3-NP conjugate (4-fold mean fluorescence over non-targeted NP), and magnetic resonance imaging (MRI) experiments showed similar findings (3-fold R2 relaxivity). Confocal fluorescence microscopy localized the αGPC3-NPs only to the cell surface of GPC3-expressing Hep G2 cells. Further characterization of this construct demonstrated a negatively charged, monodisperse, 50 nm NP, ideally suited for tumor targeting. This GPC3-specific NP system, with dual imaging capability, may enhance pretreatment MRI, enable refined intra-operative HCC visualization by NIR fluorescence, and may be potentially used as a carrier for delivery of tumor-targeted therapies, improving patient outcomes.
Keywords: glypican-3, hepatocellular carcinoma, iron oxide nanoparticle, magnetic resonance imaging, near-infrared fluorescence imaging
Introduction
With over 660,000 new cases and 630,000 resultant deaths estimated in 2009, primary liver cancer, or hepatocellular carcinoma (HCC) is the fifth most prevalent malignancy and the third leading cause of cancer-related deaths worldwide [1,2,3]. Although 80% of cases occur in regions where hepatitis B infection is endemic, the incidence of HCC in the United States is rising at epidemic proportions as a result of the rampant spread of hepatitis C in the 1950’s and 60’s [2,3,4]. HCC is a highly lethal disease as demonstrated by the equal annual incidence and mortality, and the dismal 8-month median survival without treatment [5] is improved only by a modest 3 months when the best chemotherapy available, Sorafenib is employed [6]. On the contrary, when HCC is detected at an early stage, curative treatments such as surgical resection, liver transplantation, and ablative therapies can be utilized, achieving 5-year survival rates of up to 75%, highlighting the importance of early detection [7,8,9].
Diagnosis of early stage HCC is heavily reliant on quality multiphase, contrast-enhanced computed tomography (CT) and magnetic resonance (MR) imaging, current gold standards [10]. While characteristic arterial enhancement with portal venous washout of a liver lesion on CT or MR is diagnostic for HCC, indeterminate lesions are frequently detected [10,11], prompting costly repeat imaging or biopsies with bleeding or tumor seeding risks [12,13], all resulting in delay of diagnosis and treatment. Furthermore, eligibility for surgical resection or liver transplantation based on suboptimal scans either leads to early recurrences and poor outcomes, or missed treatment opportunities.
Several nanoparticle (NP) systems are being investigated for use in cancer diagnostics and therapeutics [14,15,16,17]. HCC targeting with NPs remains challenging, as Kupffer cells, specialized macrophages dispersed throughout liver sinusoids that comprise an elaborate reticuloendothelial system (RES), take up these particles and interfere with imaging or delivery of therapeutic payloads [17,18,19]. Much effort has been devoted to optimizing selective delivery of NPs to tumors while evading the RES, using surface modification of NPs with anti-fouling polymers such as polyethylene glycol and various tissue-specific ligands [20,21]. Strategies that identify HCC-specific cell surface moieties to conjugate to have superior specificity hold the most promise. Vascular endothelial growth factor, epidermal growth factor receptor, aptamers, and small molecules such as galactose have been reported as potential targeting moieties for specific delivery of NPs and drugs to HCC cells [22,23,24,25]. However, the demand for novel targeting ligands for HCC-specific delivery remains high, as no single receptor is uniformly expressed by the heterogeneous population of HCCs, and the efficiency of existing HCC-targeting ligands are less than ideal. Furthermore, a two-step pre-targeting approach to further enhance the signal for antibody-targeted imaging and treatment has been reported [26,27].
Glypican-3 (GPC3) was selected as a novel molecular target in this study for HCC based on qualities crucial to successful targeting and promising for future applications. GPC3 is a heparan sulfate proteoglycan essential in regulating embryonal cell growth, as evidenced by its mutation causing the Simpson-Golabi-Behmel overgrowth syndrome [28]. While its expression is absent in normal adult tissues, GPC3 is significantly over-expressed in up to 80% of human HCC’s [29,30,31]. Attached to the cell membrane via a glycosyl-phosphatidylinositol anchor, GPC3 is readily accessible for antibody-mediated targeting and binding [29,32]. Moreover, GPC3 has been shown to promote HCC growth by stimulating the canonical Wnt signaling pathway, exhibiting potential as an important therapeutic target [32,33]. These auspicious attributes make GPC3 an ideal biomarker for HCC targeting.
In this report, we developed a novel dual imaging modality NP system designed to specifically target liver cancer cells expressing GPC3. For dual near-infrared fluorescence (NIRF) and MR imaging, NIR fluorophore, Alexa Fluor 647 was covalently conjugated to iron oxide NPs. Biotinylated monoclonal antibody against GPC3 (αGPC3) used to pre-target GPC3-expressing HCC cells was subsequently targeted using NP via non-covalent streptavidin-biotin interaction. Size, surface charge, and morphology of resulting αGPC3-NP were characterized by dynamic light scattering and transmission electron microscopy, respectively. Differential intracellular expression level of GPC3 was quantitatively analyzed by real-time PCR for human HCC cells, Hep G2 (high in GPC3) and HLF (low in GPC3). Targeted delivery of αGPC3-NP to GPC3-expressing Hep G2 cells was examined quantitatively by flow cytometry and MR imaging. The enhanced intracellular extent of NIR fluorophore by specific uptake of αGPC3-NP in GPC3 expressing HCC cells was visualized using confocal fluorescence imaging.
Materials and Methods
Preparation of Iron Oxide NPs and Surface Modification
Iron oxide NPs were prepared as previously described [34]. Oleic acid-coated NPs synthesized by thermal decomposition of iron oleate complex were reacted with triethoxysilylpropylsuccinic anhydride (SAS, Gelest, Morrisville, PA) using ligand-exchange and condensation to form hydrophilic SAS-coated NPs. Amine-functionalized polyethylene-glycol (PEG) was attached via N,N-dicyclohexylcarbodiimide (DCC)-mediated coupling. The NP concentration was adjusted to 4 mg/mL in 150 mM boric acid, pH 8.0. SIA (4 mg, Invitrogen) dissolved in 100 μL DMSO was added to 1 mL NP solution in an amber glass vial and reacted at room temperature (RT) overnight on a rotator. A Sephracyl-200 column (GE Healthcare, Piscataway, NJ) was eluted with 25 mL 150 mM boric acid, pH 8.0, and the iodoacetate functionalized NPs were purified using the column. Streptavidin (AV) (5 mg, lyophilized in 10 mM phosphate buffered saline (PBS), pH 7.4, Invitrogen) was dissolved in 1 mL deionized (DI) water. Alexa Fluor 647 (0.5 mg, Invitrogen) was dissolved in 100 μL DMSO and 50 μL was added to the AV. The reaction was covered in foil and placed on a shaker for 1 hr at RT. A PD-10 desalting column (GE Healthcare) was eluted with 25 mL 50 mM Na Bicarbonate, pH 8.5, and the fluorophore labeled AV was purified. 60 μL of N-Succinimidyl-S-acetylthioacetate (SATA, Invitrogen) dissolved in DMSO at 1 mg/mL was added to the purified fluorophore (Alexa Fluor 647) labeled AV (AV-APC) and reacted on a shaker for 2 hrs at RT. To a 1 mg aliquot of purified AV-APC, 55 μL of deprotection solution (0.5 M hydroxylamine, 25 mM EDTA, pH 7.2) was added, reacted for 40 min, and then Zeba spin column purified. The NP-SIA concentration was adjusted to 2 mg/mL and then added to the purified AV-APC in an amber vial and reacted overnight on a shaker at RT. The AV-APC labeled NP (NP-AV-APC) was purified with a Sephracyl-200 column. The Fe concentration was determined by inductively coupled plasma atomic emission spectroscopy (ICP-AES, Thermo Jarrell Ash Corporation, Franklin, MA). Figure 1A illustrates the synthesis of NP-AV-APC.
Figure 1.

Schematic of NP synthesis and illustration of cell targeting. (A) Synthesis of NP-AV-APC. (B) Biotinylation of αGPC3. (C) Two-step pre-targeting approach of cell labeling.
NP Characterization and Transmission Electron Microscopy
The fluorescence spectra of NP, AV-APC and NP-AV-APC were measure with an excitation wavelength of 600 nm using the SpectraMax M2 microplate reader (Molecular Devices, Sunnyvale, CA). The surface charge and hydrodynamic size of the NPs was measured in PBS using a Zetasizer Nanoseries dynamic light scattering particle size analyzer (Malvern, Worcestershire, UK). The αGPC3-NP were loaded onto a grid and then dried in a dessicator at room temperature for transmission electron microscopy (TEM) analysis. TEM samples were observed on a Phillips CM100 TEM (Phillips, Eindhoven, The Netherlands) operating at 100 kV with a Gatan 689 digital slow scan camera.
Cell Culture
Human HCC cell lines, Hep G2 (ATCC, Manassas, VA) and HLF (Japanese Collection of Research Bioresources, Shinjuku, Japan) were maintained in Eagle’s minimum essential medium (MEM) and Dulbecco’s modified essential medium (DMEM), respectively, supplemented with 10% (v/v) fetal bovine serum (FBS, Atlanta Biologicals, Lawrenceville, GA) and 100 units/ml penicillin/streptomycin (Invitrogen, Carlsbad, CA). The cell cultures were incubated at 37°C atmosphere supplemented with 5% CO2, and subcultivated at a ratio of 1:4 twice weekly using TrypLE (Invitrogen). Hep G2 cells were passed through a 25 G needle to minimize clumping. For experiments, the cells were detached using Versene-EDTA 1:5000 (Invitrogen) to minimize enzymatic cleavage of the GPC3 expressed on the cell surface.
Quantitative Real-time PCR
Cells were detached using TrypLE (Invitrogen), and homogenized by passing through QIAshredder columns (Qiagen, Valencia, CA). Total RNA was isolated from Hep G2 and HLF cells in triplicate using RNeasy (Qiagen), and 30 ng of total RNA for each sample was converted to cDNA using the iScript cDNA Synthesis Kit (Bio Rad, Hercules, CA) following the manufacturer’s instructions. iQ SYBR Green Supermix (Bio Rad) was used for template amplification with a primer for each of the transcripts examined. Thermocycling for all targets were carried out in a solution of 30 μl containing 0.3 μM primers (Integrated DNA Technologies, San Diego, CA) and 4 pg cDNA from the reverse transcription reaction under following conditions: 15 sec at 94°C, 30 sec at 55°C, and 30 sec at 72°C. The reaction was monitored in real-time using a CFX96 (BioRad). Two sets of GPC3 primers with gene product sizes of 250 and 430 base-pairs without any gene sequence overlap were used to confirm the presence of this gene. Primer nucleotide sequences were as follows: GPC3 250 sense 5’-GATACAGCCAAAAGGCAG-3’, antisense 5’-ATCATTCCATCACCAGAG-3’, GPC3 430 sense 5’-GCAAGTATGTCTCCCTAAGG-3’, antisense 5’-AGGTCACGTCTTGCTCCTC-3’. GPC3 expression was normalized to expression of the house keeping gene GAPDH sense 5’-TCGACAGTCAGCCGCATCTTCTTT-3’, antisense 5’-ACCAAATCCGTTGATCCGACCTT-3’.
Bioconjugation of GPC3 Antibody to Biotin
Purified mouse anti-human monoclonal IgG2A antibody to GPC3 (αGPC3, 100 μg lyophilized, R&D Systems, Mineapolis, MN) was resuspended in 100 μL 0.1 M NaHCO3 (Sigma-Aldrich, St. Louis, MO). 6-((6-((Biotinoyl)amino)hexanoyl)amino) hexanoic acid, succinimidyl ester, a biotin moiety with a 14-atom spacer consisting of two aminohexanoic acid chains (Biotin-XX, SE, MW: 567.70, 8.4 mg, Invitrogen) was dissolved in 200 μL DMSO (Sigma-Aldrich), and then diluted with addition of 800 μL DI H2O. 1.85 μL of the biotin-XX-DMSO solution was added to the αGPC3 and incubated at RT for 15 min. A desalting spin column (Zeba 0.5 mL, 7K MW exclusion limit, ThermoScientific, Rockford, IL) was equilibrated with 300 μL 0.1 M NaHCO3 washes at 4000 rpm for 1 min, and then the biotinylated αGPC3 was passed through the column. 25 μL of the purified product was diluted to 1 mL with FACS buffer (MEM with 2% FBS and 0.04% human IgG (Invitrogen)) for cell labeling experiments. Figure 1B illustrates this conjugation scheme.
Cell Labeling
Hep G2 and HLF cells were detached using Versene, resuspended in MEM with 10% (v/v) FBS, and counted with Trypan blue exclusion, confirming viability. Cells were centrifuged at 650 rcf for 7 min and the pellets were resuspended in FACS buffer at a cell concentration of 4 × 10⁶ cells/mL for flow cytometry, or 1 × 10⁷ cells/mL for MRI experiments, and incubated on ice for 15 min with periodic gentle mixing. For the NP-AV-APC/αGPC3 group, purified biotinylated αGPC3 was added to the cells in a pre-targeting step and incubated on ice for 60 min with periodic gentle mixing. Cells were then washed with FACs buffer and centrifuged at 650 rcf for 7 min. Pellets were resuspended in FACS buffer containing NP-AV-APC and incubated on ice for 30 min with periodic gentle mixing. For the αGPC3-APC group, 40 μL of Allophycocyanin (APC) labeled αGPC3 (R&D Systems) was added to the cells and incubated on ice for 30 min with periodic gentle mixing. For the control NP-AV-APC group, untreated cell pellets were resuspended in FACS buffer containing NP-AV-APC and incubated on ice for 30 min with periodic gentle mixing. All cell group samples were washed twice with FACS buffer and centrifugation, then resuspended in FACS buffer and fixed with equal volume of 4% formaldehyde. All experiments were performed in triplicate. The pre-targeting scheme for the NP-AV-APC/αGPC3 group is illustrated in Figure 1C.
Flow Cytometry
GPC3-targeted labeling of the cells was quantified using flow cytometry. Fixed cells (4 × 10⁵) were analyzed with a BD FACSCanto flow cytometer (Becton Dickinson Biosciences, Franklin Lakes, NJ) equipped with a 633 nm red diode laser for excitation of Alexa Fluor 647 and APC fluorophores, appropriate band-pass filters to collect the emission wavelengths, and a digital instrument using FACSDiva software. A minimum of 30,000 cells was analyzed for each sample, and triplicate samples were evaluated for each treatment group. Data analysis was performed on FlowJo Version 8.8.6 (Tree Star, Ashland, OR).
In vitro Fluorescence Microscopy Imaging
Cells from the four treatment groups (Cells only, αGPC3-APC, NP-AV-APC/αGPC3, and NP-AV-APC) were plated on sterile 24 mm glass cover slides (5 ×10⁵ per slide) and grown for 24 hrs at 37°C in humidified atmosphere with 5% CO2. Cells were washed with PBS three times, and fixed in 4% formaldehyde/PBS solution (methanol free, Polysciences Inc., Warrington, PA) for 30 min. The fixative was then removed, and cells were washed again with PBS three times. Cell membranes were then labeled with Alexa Fluor 555 wheat germ agglutinin (Invitrogen) according to the manufacturer’s instructions. The slides were then mounted with 4′,6-diamidino-2-phenylindole (DAPI)-containing Prolong Gold antifade solution (Invitrogen) for cellular nuclei staining and fluorescence preservation. The slides were examined by fluorescence microscopy using a Zeiss LSM 510 Meta confocal fluorescence microscope (Zeiss, Peabody, MA) equipped with 405 nm diode, 458 nm, 488 nm, 514 nm Argon/2, and 633 nm HeNe laser lines for excitation, and appropriate band-pass filters for collection of DAPI, Alexa Fluor 555, and NIRF (Alexa Fluor 647 and APC) emission signals. In all fluorescence images the DAPI signal is depicted in blue, Alexa Fluor 555 signal in green, and the NIRF signal in red.
In vitro MRI
Cell pellets (106 cells) were suspended in 50 μL of 1% agarose casts. T2 relaxation measurements were performed on a 4.7-T Bruker magnet (Bruker Medical Systems, Karlsruhe, Germany) equipped with Varian Inova spectrometer (Varian, Inc., Palo Alto, CA). A 5-cm volume coil and spin-echo imaging sequence were used to acquire T2-weight images. Images were acquired using a repetition time (TR) of 3000 ms and echo times (TE) of 14.0, 20.0, 40.0, 60.0, 100.0 and 150.0 ms. The spatial resolution parameters were: acquisition matrix of 256 × 128, field-of-view of 35 × 35 mm, section thickness of 1 mm and two averages. The T2 map was generated by ImageJ software (National Institute of Health, Bethesda, MD; http://rsb.info.nih.gov/ij/) based on the equation, SI = A · exp(−TE/T2) + B, where SI is the signal intensity, TE is the echo time, A is the amplitude, and B is the offset. The R2 map was generated by taking the reciprocal of the T2 map.
Results
NP Development and Characterization
Physiochemical properties of NPs such as size and surface charge are important factors that determine the pharmacokinetics and cellular uptake of NPs [35]. In this study, fluorophore labeled streptavidin (AV-APC) immobilized on the surface of iron oxide NPs (NP-AV-APC) was used to identify and bind to the biotinylated targeting moiety, GPC3 antibody. Streptavidin (AV), a tetrameric protein with an isoelectric point value of 5, is well known for its strong non-covalent binding to biotin with a dissociation constant of 4 × 10⁻¹⁴ M [36]. The immobilization of streptavidin on the surface of the NP was confirmed by fluorescence measurements of NP, AV-APC and NP-AV-APC after purification (Figure 2A). While naked NPs show no fluorescent emission, both AV-APC and NP-AV-APC have a strong emission peak centered at ~665 nm, confirming the presence of AV-APC on the surface of NP-AV-APC. The zeta potential and hydrodynamic size of NP-AV-APC was measured. The NP-AV-APC construct had a zeta potential of −30.4 mV ± 12.4 in DI water at pH 7.0 (Figure 2B). This negative charge is a targeting advantage, since decreased surface charge of NPs are reported to reduce non-specific uptake by cells (typically negatively charged) and may increase deep tissue penetration by reduced electrostatic attraction to extracellular matrices [37]. The mean hydrodynamic size measured in PBS was 50.4 nm with a polydispersity index (PDI) of 0.13 (Figure 2C). NP diameters between 20 and 150 nm are preferred, as diameters less than 20 nm have been shown to be susceptible to renal clearance while NPs with diameters less than 150 nm can extravasate from vasculature into the tumor microenvironment via enhanced permeability and retention (EPR) effect and avoid clearance by the RES [38]. The hydrodynamic size corresponds well with the NP core diameter (~12.5 nm) determined by TEM (Figure 2D). Differences in the hydrodynamic size and the core size measured by TEM are attributed to hydration of the polyethylene glycol (PEG) coating and the addition of streptavidin on the polymer layer. In addition to core diameter, TEM also demonstrates relative monodispersity of the NP and a lack of particle aggregation, due to both the anti-fouling PEG conjugation and the electrostatic repulsion between highly negatively charged NPs.
Figure 2.
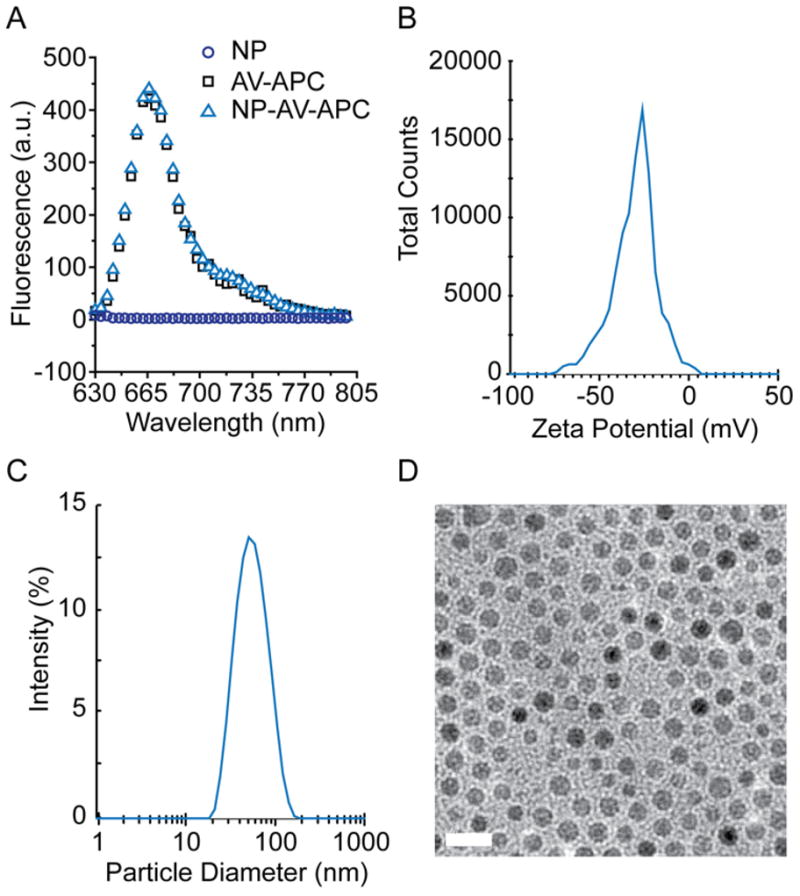
Physicochemical properties of the NP-AV-APC. (A) Fluorescence spectra of NP, AV-APC and NP-AV-APC (B) Zeta potential of NP-AV-APC at pH 7.0. (C) Hydrodynamic size of NP-AV-APC in PBS, determined by dynamic light scattering. (D) TEM image of oleic-acid coated NPs. Scale bar = 20 nm
GPC3 Expression in Hep G2 and HLF Cells
GPC3 was chosen as a molecular target for HCC based on the accessibility of its cell surface configuration to antibody-mediated targeting and its differential over-expression in most HCC cells compared to its absence in normal adult tissues. Immunohistochemical diagnosis of HCC using monoclonal GPC3 antibody staining has been effective in differentiating HCC from benign processes and other malignancies with 97% specificity [28,29]. Microarray genomic profiling studies have confirmed considerable up-regulation of GPC3 expression in most human HCC specimens, implicating its role in pathogenesis and potential as an important biomarker and therapeutic target [39]. The differential levels of GPC3 expression in Hep G2 (high) and HLF (negligible) cells has previously been reported, and consequently the Hep G2 and HLF cell lines have been used as GPC3-positive and GPC3-negative lines, respectively [30]. Quantitative Real-time PCR was performed to confirm this finding in our cells. Two distinct PCR primer sets for GPC3 resulting in two non-sequence-overlapping PCR products measuring 250 base-pairs and 430 base-pairs, respectively, were used to validate the results. Figure 3 demonstrates the expression level of the GPC3 gene in both cell lines normalized to the expression level of the housekeeping gene GAPDH. GPC3 expression in Hep G2 cells was significantly elevated (320,000-fold increase) compared to that of the housekeeping gene GAPDH, whereas GPC3 expression in the HLF cells was equivalent to that of GAPDH. Both 250 and 430 base-pair PCR primer sets produced equivalent results (Hep G2 vs. HLF, P < 0.0001), further validating these results. These findings substantiated the use of these cells for the ensuing targeting experiments.
Figure 3.
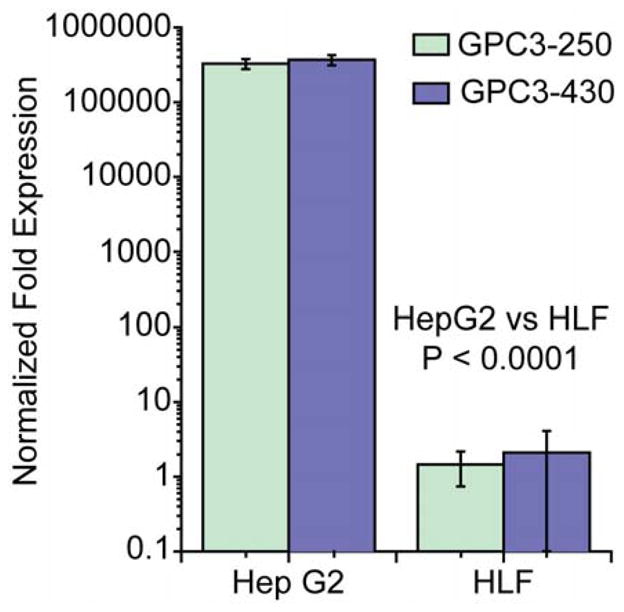
Relative GPC3 expression in Hep G2 and HLF cells determined by Real-time PCR for two non-sequence-overlapping PCR products measuring 250 and 430 base-pairs.
Flow Cytometry Experiments
Specific targeting of the GPC3-positive Hep G2 cells using αGPC3 was demonstrated using flow cytometry. First, Hep G2 and HLF cells were treated with αGPC3-APC to establish feasibility of cell surface targeting using this antibody. As illustrated in Figure 4, the level of fluorescence, expressed as the normalized geometric mean, is significantly higher in the GPC3-positive Hep G2 cells compared to the GPC3-negative HLF cells (P < 0.0001), confirming the results of the PCR experiment. These findings suggest that the GPC3 expressed on the cell surface of Hep G2 cells can clearly be targeted and labeled by αGPC3 indicating its high affinity to GPC3. The GPC3 negative HLF cells are not labeled by αGPC3-APC, denoting this monoclonal antibody’s specificity towards GPC3. In the group designated NP-AV-APC/αGPC3, the cell surface marker GPC3 was first labeled using the biotinylated αGPC3 in a pre-targeting step, then subsequently the biotin was targeted using the streptavidin iron oxide NP construct. This two-step pre-targeting approach to enhance targeting efficiency of antibody-mediated imaging and therapy has been previously described [24,25]. We utilized this two-step pre-targeting approach sequentially employing biotinylated αGPC3 followed by streptavidin-conjugated NP’s to specifically target GPC3-expressing HCC cells (Figure 1), and refine the targeting signal. In our preliminary studies, pre-conjugated NP-AV-APC/biotin-αGPC3 particles showed negligible targeting effect for Hep G2 cells, compared to the two-step pre-targeting approach. This finding may be attributed to the NP-AV-APC/biotin-αGPC3 complexes being subject to significant electrostatic repulsion due to the highly negative charged NP-AV-APC and cell surface interactions, which in turn could limit the interaction of αGPC3 with GPC3 on the cell membrane. Additionally, steric hindrance between bulky groups such as NPs (MW 2.8 × 10⁶ based on its 12 nm core diameter) and streptavidin (MW 6 × 10⁴) near the antibody could also inhibit antibody-antigen interactions [40]. However, biotin-streptavidin interactions are much stronger than that between antibody-antigen, which could overcome the interfering charge repulsion limiting the opportunity of interaction between NPs and the cell surface. As shown in Figure 4, in Hep G2 cells, there was clear demonstration of GPC3-specific targeting by the NP as evidenced by a four-fold increase in the mean fluorescence in the targeted NP-AV-APC/αGPC3 group compared to the non-targeted NP-AV-APC control group (P < 0.0001) using the pre-targeted approach. No difference in mean fluorescence was observed between the targeted NP-AV-APC/αGPC3 group and NP-AV-APC control group for the GPC3-negative HLF cells.
Figure 4.
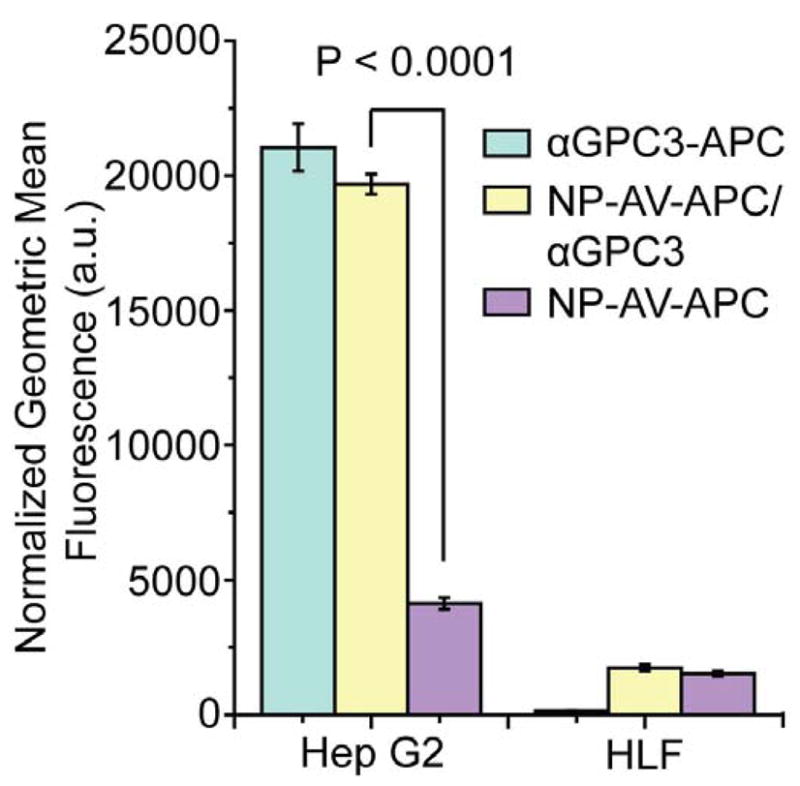
Normalized geometric mean fluorescence of Hep G2 and HLF cells treated with either αGPC3-APC, NP-AV-APC/αGPC3 or NP-AV-APC, determined by flow cytometry.
Confocal Fluorescence Imaging
In this study, NIR fluorophore was immobilized onto NPs as a dual imaging agent, which could endow enhanced image resolution for clinical application. Targeted cellular labeling using αGPC3 and cellular localization of either αGPC3-APC or NP-AV-APC/αGPC3 was visualized by confocal fluorescence microscopy. Fluorescence images of Hep G2 (Figure 5A) and HLF (Figure 5B) cells further confirmed the results of the flow cytometry studies. The GPC3-positive Hep G2 cells treated with αGPC3-APC demonstrated cell membrane labeling, whereas the GPC3-negative HLF cells did not. Hep G2 cells treated with biotinylated αGPC3 followed by NP-AV-APC demonstrated cell membrane labeling with fluorophore. Hep G2 cells treated with the control NP-AV-APC demonstrated negligible fluorescence, indicating that the NP-AV-APC itself exhibited low non-specific uptake or binding by these cells. The HLF cells were not labeled by either the αGPC3-APC or the biotinylated αGPC3 bound by NP-AV-APC particles. In summary, the fluorophore labeling seen on imaging by either the APC-labeled αGPC3 or the biotinylated αGPC3 bound to NP-AV-APC was specific to the GPC3-expressing Hep G2 cells.
Figure 5.

Confocal fluorescence imaging of GPC3 targeting for (A) Hep G2 cells and (B) HLF cells either untreated or treated with αGPC3-APC, NP-AV-APC/αGPC3 or NP-AV-APC.
In vitro MRI
To ensure that the NP-AV-APC construct retains sufficient magnetism after cell surface labeling, and to test the potential use of these particles as a GPC3-specific MRI contrast agent for HCC, the magnetic properties of the NP-AV-APC was studied. R2 relaxation was evaluated at 4.7 T by acquiring phantom MR images of agarose with 1 × 10⁶ cells per each of the four treatment groups for both Hep G2 and HLF cells. The colorized R2 maps in Figure 6A and quantitative R2 calculations in Figure 6B demonstrate significantly increased relaxivity measurements for Hep G2 cells treated with biotinylated αGPC3 followed by NP-AV-APC particles compared to other conditions and to HLF cells. For Hep G2 cells in the NP-AV-APC/αGPC3 group, there was a three-fold increase in R2 values over untreated cells and a significant increase over cells treated with non-targeted NP-AV-APC. HLF cells in the NP-AV-APC/αGPC3 group demonstrated an increase in R2 value over those in the cells only group. However, the uptake was not significantly different than the R2 value in the non-targeted NP-AV-APC group. These results suggest that a greater number of magnetic NPs bound to the cell surface of Hep G2 cells in the NP-AV-APC/αGPC3 group compared to the non-targeted NP-AV-APC group. Additionally, a greater number of magnetic NPs bound to the Hep G2 cells in the NP-AV-APC/αGPC3 group compared to the HLF groups treated with NP-AV-APC/αGPC3 and NP-AV-APC, confirming GPC3-specific targeting and demonstrating the potential of this NP construct as an effective MRI contrast agent.
Figure 6.

In vitro MR imaging of GPC3 targeted NP uptake. (A) R2 color maps and (B) quantitative R2 values for Hep G2 and HLF cells untreated or treated with αGPC3-APC, NP-AV-APC/αGPC3 or NP-AV-APC.
Discussion
This study is the first proof-of-concept demonstration that GPC3, a surface receptor over-expressed in most HCCs, can be employed as a novel molecular target to specifically identify HCC cells using a multifunctional NP. Various nano-scale constructs and targets have been evaluated for specific targeting of HCC with limited efficacy. This novel NP construct has a number of advantages in its design and application. First, the target ligand GPC3 is a proteoglycan expressed on the cell surface of most HCCs, potentially making it widely applicable to most HCC patients. In contrast, normal adult human cells and tissues, and even dysplastic nodules found in cirrhotic livers that often account for indeterminate lesions encountered on conventional CT or MR imaging, lack GPC3 expression, making GPC3 a potentially powerful tool to discriminate between these benign entities and HCC [41]. Our study clearly illustrates the ability of the αGPC3 to target GPC3-expressing HCC cells with high specificity. Secondly, the characteristics of the NP construct are optimal for targeted delivery to the cells of interest, and an ideal target-specific imaging contrast agent. The hydrodynamic size of 50 nm is large enough so that it will not be quickly filtered out through the glomeruli, while small enough that it can evade the RES clearance by the EPR effect. A negative zeta potential also minimizes unwanted non-specific binding and uptake by surrounding tissues, and allows for deeper tissue penetration to the target [37]. The NP construct also has the unique advantage of dual modality imaging; targeted MR imaging which can be used for pretreatment staging/planning, and targeted NIRF imaging which can be used in the operating theater to ensure adequate surgical margins during tumor resection. It also offers the potential utilization as a nanocarrier for HCC-targeted therapeutics, delivering drugs and other payloads. For all of these reasons, this GPC3 targeted NP system may potentially improve the diagnosis of indeterminate liver lesions, which in turn will enhance the accuracy of staging and surgical risk stratification of the HCC patient.
Acknowledgments
This work is supported in part by NIH grants (R01CA119408, R01EB006043, and R01CA134213). J.P. acknowledges the support of the American Surgical Association Foundation Research Fellowship. O.V. and F.K. acknowledge support of the NCI training grant (T32CA138312). C. F. acknowledges the support of the NCI/NSF IGERT Fellowship. We acknowledge Haobo Chen for his assistance with cell culture and experiments. We also thank the Animal Bioimaging Center, the Center for Nanotechnology, the Diagnostic Imaging Sciences Center, the Department of Immunology Cell Sorting Facility, and Keck Microscopy Imaging Facility at the University of Washington for use of equipment and resources.
References
- 1.Sherman M. Hepatocellular carcinoma: epidemiology, surveillance, and diagnosis. Semin Liver Dis. 2010;30(1):3–16. doi: 10.1055/s-0030-1247128. [DOI] [PubMed] [Google Scholar]
- 2.Ferenci P, et al. Hepatocellular carcinoma (HCC): a global perspective. J Clin Gastroenterol. 2010;44(4):239–45. doi: 10.1097/MCG.0b013e3181d46ef2. [DOI] [PubMed] [Google Scholar]
- 3.Caldwell S, et al. The epidemiology of hepatocellular cancer: from the perspectives of public health problem to tumor biology. J Gastroenterol. 2009;44(Suppl XIX):96–101. doi: 10.1007/s00535-008-2258-6. [DOI] [PubMed] [Google Scholar]
- 4.Altekruse S, et al. Hepatocellular carcinoma incidence, mortality, and survival trends in the United States from 1975 to 2005. J Clin Oncol. 2009 doi: 10.1200/JCO.2008.20.7753. [DOI] [PMC free article] [PubMed] [Google Scholar]
- 5.Cabibbo G, et al. A meta-analysis of survival rates of untreated patients in randomized clinical trials of hepatocellular carcinoma. Hepatology. 2010;51(4):1274–83. doi: 10.1002/hep.23485. [DOI] [PubMed] [Google Scholar]
- 6.Llovet J, et al. Sorafenib in advanced hepatocellular carcinoma. N Engl J Med. 2008;359(4):378–90. doi: 10.1056/NEJMoa0708857. [DOI] [PubMed] [Google Scholar]
- 7.Bruix J, et al. Major achievements in hepatocellular carcinoma. Lancet. 2009;373(9664):614–6. doi: 10.1016/S0140-6736(09)60381-0. [DOI] [PubMed] [Google Scholar]
- 8.Massarweh N, et al. Trends in the utilization and impact of radiofrequency ablation for hepatocellular carcinoma. J Am Coll Surg. 2010;210(4):441–8. doi: 10.1016/j.jamcollsurg.2009.12.026. [DOI] [PMC free article] [PubMed] [Google Scholar]
- 9.Bruix J, et al. Management of hepatocellular carcinoma. Hepatology. 2005;42(5):1208–36. doi: 10.1002/hep.20933. [DOI] [PubMed] [Google Scholar]
- 10.Ayyappan A, et al. CT and MRI of hepatocellular carcinoma: an update. Expert Rev Anticancer Ther. 2010;10(4):507–19. doi: 10.1586/era.10.24. [DOI] [PubMed] [Google Scholar]
- 11.Sangiovanni A, et al. The diagnostic and economic impact of contrast imaging techniques in the diagnosis of small hepatocellular carcinomas in cirrhosis. Gut. 2010;59(5):638–44. doi: 10.1136/gut.2009.187286. [DOI] [PubMed] [Google Scholar]
- 12.Silva M, et al. Needle track seeding following biopsy of liver lesions in the diagnosis of hepatocellular cancer: a systematic review and meta-analysis. Gut. 2008;57(11):1592–6. doi: 10.1136/gut.2008.149062. [DOI] [PubMed] [Google Scholar]
- 13.Saborido B, et al. Does preoperative fine needle aspiration-biopsy produce tumor recurrence in patients following liver transplantation for hepatocellular carcinoma? Transplant Proc. 2005;37(9):3874–7. doi: 10.1016/j.transproceed.2005.09.169. [DOI] [PubMed] [Google Scholar]
- 14.Veiseh O, et al. Specific targeting of brain tumors with an optical/magnetic resonance imaging nanoprobe across the blood-brain barrier. Cancer Res. 2009;69(15):6200–7. doi: 10.1158/0008-5472.CAN-09-1157. [DOI] [PMC free article] [PubMed] [Google Scholar]
- 15.Fang C, et al. Multifunctional magnetic nanoparticles for medical imaging applications. J Materials Chem. 2009;19(35):6258–66. doi: 10.1039/b902182e. [DOI] [PMC free article] [PubMed] [Google Scholar]
- 16.Kievit F, et al. PEI-PEG-chitosan copolymer coated iron oxide nanoparticles for safe gene delivery: synthesis, complexation, and transfection. Adv Funct Mater. 2009;19(14):2244–51. doi: 10.1002/adfm.200801844. [DOI] [PMC free article] [PubMed] [Google Scholar]
- 17.Ruoslahti E, et al. Targeting of drugs and nanoparticles to tumors. J Cell Biol. 2009;188(6):759–768. doi: 10.1083/jcb.200910104. [DOI] [PMC free article] [PubMed] [Google Scholar]
- 18.Harris T, et al. Protease-triggered unveiling of bioactive nanoparticles. Small. 2008;4(9):1307–12. doi: 10.1002/smll.200701319. [DOI] [PMC free article] [PubMed] [Google Scholar]
- 19.Moghimi S, et al. Long-circulating and target-specific nanoparticles: theory to practice. Pharmacol rev. 2001;53:283–318. [PubMed] [Google Scholar]
- 20.Schipper M, et al. Particle size, surface coating, and PEGylation influence the biodistribution of quantum dots in living mice. Small. 2009;5(1):126–34. doi: 10.1002/smll.200800003. [DOI] [PMC free article] [PubMed] [Google Scholar]
- 21.Lee H, et al. Antibiofouling polymer-coated superparamagnetic iron oxide nanoparticles as potential magnetic resonance contrast agents for in vivo cancer imaging. J Am Chem Soc. 2006;128(22):7383–9. doi: 10.1021/ja061529k. [DOI] [PubMed] [Google Scholar]
- 22.Chen J, et al. Using anti-VEGF McAb and magnetic nanoparticles as double-targeting vector for the radioimmunotherapy of liver cancer. Cancer Lett. 2006;231(2):169–75. doi: 10.1016/j.canlet.2005.01.024. [DOI] [PubMed] [Google Scholar]
- 23.Liu p, et al. Preparation of EGFR monoclonal antibody conjugated nanoparticles and targeting to hepatocellular carcinoma. J Mater Sci Mater Med. 2010;21(2):551–6. doi: 10.1007/s10856-009-3925-8. [DOI] [PubMed] [Google Scholar]
- 24.Kou G, et al. Development of SM5-1-conjugated ultrasmall superparamagnetic iron oxide nanoparticles for hepatoma detection. Biochem Biophys Res Commun. 2008;374(2):192–7. doi: 10.1016/j.bbrc.2008.06.126. [DOI] [PubMed] [Google Scholar]
- 25.Kim T, et al. Galactosylated chitosan/DNA nanoparticles prepared using water-soluble chitosan as a gene carrier. Biomaterials. 2004;25(17):3783–92. doi: 10.1016/j.biomaterials.2003.10.063. [DOI] [PubMed] [Google Scholar]
- 26.Sharkey R, et al. Signal amplification in molecular imaging by pretargeting a multivalent, bispecific antibody. Nat Med. 2005;11:1250–5. doi: 10.1038/nm1322. [DOI] [PubMed] [Google Scholar]
- 27.Goldenberg D, et al. Antibody pretargeting advances cancer radioimmunodetection and radioimmunotherapy. J Clin Oncol. 2006;24:823–34. doi: 10.1200/JCO.2005.03.8471. [DOI] [PubMed] [Google Scholar]
- 28.Pilia G, et al. Mutations in GPC3, a glypican gene, cause the Simpson-Golabi-Behmel overgrowth syndrome. Nat Genet. 1996;12:241–7. doi: 10.1038/ng0396-241. [DOI] [PubMed] [Google Scholar]
- 29.Hsu H, et al. Cloning and expression of a developemntally regulated transcript MXR7 in hepatocellular carcinoma: biological significance and temporospatial distribution. Cancer Res. 1997;57:5179–84. [PubMed] [Google Scholar]
- 30.Capurro M, et al. Glypican-3: a novel serum and histochemical marker for hepatocellular carcinoma. Gastroenterology. 2003;125:89–97. doi: 10.1016/s0016-5085(03)00689-9. [DOI] [PubMed] [Google Scholar]
- 31.Nakatsura T, et al. Glypican-3, overexpressed specifically in human hepatocellular carcinoma, is a novel tumor marker. Biochem Biophys Res Commun. 2003;306:16–25. doi: 10.1016/s0006-291x(03)00908-2. [DOI] [PubMed] [Google Scholar]
- 32.Capurro M, et al. Glypican-3 promotes the growth of hepatocellular carcinoma by stimulating canonical Wnt signaling. Cancer Res. 2005;65(14):6245–54. doi: 10.1158/0008-5472.CAN-04-4244. [DOI] [PubMed] [Google Scholar]
- 33.Ishiguro T, et al. Anti-glypican 3 antibody as a potential antitumor agent for human liver cancer. Cancer Res. 2008;68(23):9832–8. doi: 10.1158/0008-5472.CAN-08-1973. [DOI] [PubMed] [Google Scholar]
- 34.Fang C, et al. Functionalized nanoparticles with long-term stability in biological media. Small. 2009;5(14):1637–41. doi: 10.1002/smll.200801647. [DOI] [PMC free article] [PubMed] [Google Scholar]
- 35.Fang C, et al. Multifunctional magnetic nanoparticles for medical imaging applications. J Mater Chem. 2009;19:6258–66. doi: 10.1039/b902182e. [DOI] [PMC free article] [PubMed] [Google Scholar]
- 36.Mok H, et al. PEGylated and MMP-2 specifically dePEGylated quantum dots: comparative evaluation of cellular uptake. Langmuir. 2009;25:1645–50. doi: 10.1021/la803542v. [DOI] [PubMed] [Google Scholar]
- 37.Kim B, et al. Tuning payload delivery in tumour cylindroids using gold nanoparticles. Nat Nanotech. 2010 doi: 10.1038/nnano.2010.58. [DOI] [PMC free article] [PubMed] [Google Scholar]
- 38.Choi H, et al. Renal clearance of quantum dots. Nat Biotech. 2006;25:1165–70. doi: 10.1038/nbt1340. [DOI] [PMC free article] [PubMed] [Google Scholar]
- 39.Baumhoer D, et al. Glypican 3 expression in human nonneoplastic, preneoplastic, and neoplastic tissues. A tissue microarray analysis of 4387 tissue samples. Am J Clin Pathol. 2008;129:899–906. doi: 10.1309/HCQWPWD50XHD2DW6. [DOI] [PubMed] [Google Scholar]
- 40.Fonseca M, et al. Design of immuno-enzysomes with maximum enzyme targeting capability: effect of the enzyme density on the enzyme targeting capability and cell binding properties. Biochim Biophys Acta. 1999;1419(2):272–82. doi: 10.1016/s0005-2736(99)00073-5. [DOI] [PubMed] [Google Scholar]
- 41.Llovet J, et al. A molecular signature to discriminate dysplastic nodules from early hepatocellular carcinoma in HCV cirrhosis. Gastroenterology. 2006;131:1758–67. doi: 10.1053/j.gastro.2006.09.014. [DOI] [PubMed] [Google Scholar]