

Abstract
Background
Thymic malignancies are rare tumors. The IGF-1/IGF-1R system is involved in the development of the thymus. IGF-1R expression in thymic epithelial malignancies is unknown.
Methods
We investigated the expression of insulin-like growth factor 1 receptor (IGF-1R) and phospho-AKT Ser-473 (p-AKT) by immunohistochemistry and the clinicopathological correlations in a retrospective single institution surgical series of 132 thymic epithelial malignancies.
Results
Earlier stages, less aggressive histological types, and complete resections were significant positive prognostic factors for disease-related survival and progression-free survival, and female gender was a better prognostic factor for disease-related survival. IGF-1R and p-AKT proteins were expressed in 20% and 36% of thymic tumors, respectively. They were both more commonly expressed in relapsed than in primary tumors, in more aggressive subtypes and more advanced stages. There was a trend for better survival and progression-free survival in IGF-1R or p-AKT expression negative cases in the whole series; considering the 91 primary tumors only, IGF1R expression was associated with worse progression-free survival (p<0.001).
Conclusion
This retrospective analysis demonstrates stage, histology, gender and resection type as major prognostic factors. The expression of IGF-1R and p-AKT in thymic tumors suggests IGF-1R as a potential target for treatment.
Keywords: thymoma, IGF-1R, expression, immunohistochemistry, prognosis
Introduction
Thymic epithelial malignancies (TEM) are rare tumors with an overall incidence of 0.15 per 100,000 persons-year, yet they are the most common anterior mediastinal malignancies in adults, representing 50% of anterior mediastinal masses 1, 2. They can invade through the capsule and infiltrate the surrounding organs and great vessels and, albeit rarely, they can metastasize to distant organs. The epithelial cells represent the tumor cells whereas the lymphocytes are considered benign infiltrating cells. The World Health Organization (WHO) classifies TEM into five histological subtypes (A, AB, B1, B2, B3, C) 3. Surgery is the mainstay of localized tumors. However, late relapses are not uncommon, especially when either resection is not complete or in the more aggressive histological types. The major prognostic factors are the stage of the disease, the completeness of resection and the histological classification 4–6. There is a recognized major difference in prognosis and clinical behavior between thymomas, which are relatively indolent tumors, and thymic carcinomas, which have a much more aggressive behavior.
The biology of these rare tumors is still largely unknown, and the systemic therapy of advanced TEM has basically not changed in the last 10–20 years and includes platinum-based chemotherapy 7. Chemotherapy, although active, is not curative in patients with advanced stages of the disease, and targeted therapies so far have not been successful 6, 8, 9. Development of novel agents is important, especially for the more aggressive tumor types, where chemotherapy is less effective.
Insulin-like growth factor-1 receptor (IGF-1R) is a receptor tyrosine kinase, a trans-membrane hetero-tetrameric protein, encoded by the IGF-1R gene located on chromosome 15q25–q26. IGF-1R has been shown to have roles in promoting oncogenic transformation, growth and survival of cancer cells 10–13. IGF-1R is expressed on multiple immune cell types including marrow lymphocyte precursors, thymocytes, thymic epithelial cells, and mature lymphocytes. Using T-cell-specific IGF-1R knock-out mice, Gress et al. demonstrated that IGF-1 enhances thymopoiesis mainly through an expansion of thymic epithelial cells 14. These observations suggest an important role of the IGF/IGF-R system in the development and maturation of the thymus. IGF-1R transduces proliferative and anti-apoptotic stimuli to the cell mainly through activation of the MAPK and AKT pathways. Phosphorylation of AKT is a downstream event of the activation of many tyrosine kinase membrane receptors such as EGFR, Her2 and c-Kit, and it represents an indirect index of IGF-1R activation since 80% of activated AKT is suggested to be caused by IR/IGF-1R activation15.
Recently both monoclonal antibodies and small molecule kinase inhibitors have been developed against IGF-1R 16, and promising anticancer activity has been reported in Ewing sarcoma and lung cancer. Interestingly, in phase I trials of CP-751,871 and IMC-A12, two monoclonal antibodies against IGF-1R, prolonged stabilizations for over one year have been reported in 2 patients with metastatic thymomas 17, 18. No data exists on IGF-1R expression and related PI3K-AKT pathway activation in TEM. The aim of the present study was to evaluate the protein expression of IGF-1R and p-AKT in tumor samples, in relation to clinical characteristics, survival and known prognostic factors, in a relatively large series of resected TEMs treated at a single institution.
Materials and methods
Patients and samples
Patients were consecutively operated on at the Istituto Clinico Humanitas (Rozzano, Milan, Italy) between 1996 and 2008, either for a primary tumor or a local relapse. For the relapsed tumors, the date of the first surgery was taken into consideration, extending the observation period from 1976 to 2008. The formalin-fixed paraffin-embedded surgical specimens were retrieved in each case. Case selection was based on a diagnosis of thymoma or thymic carcinoma and the availability of tumor tissue. Tissue slides were reviewed and classified according to the World Health Organization (WHO) classification 3. Tumor staging was determined according to the revised Masaoka system 19. The completeness of resection was classified as R0=complete resection, R1=microscopic residual disease infiltrating resection margins and R2=macroscopic residual disease, as previously described 20. This study was conducted in agreement with the Declaration of Helsinki and was approved by the institutional ethical review boards (ClinicalTrials.gov ID: NCT00965627).
Construction of tissue micro-array
Formalin-fixed paraffin-embedded tumor specimens were assessed for quality and adequacy of fixation and storage. A tissue microarray block containing 132 TEM cases was generated. In brief, three punches of 0.36 mm2 (0.6mm in diameter) were taken from different intratumoral areas in each tumor sample and arranged in the recipient tissue array block. A pathologist (H.S.L.) verified the presence of tumor tissue on a hematoxylin-eosin stained TMA slide. Cases were considered adequate if tumor occupied one or more cores of three punches.
Immunohistochemistry
IGF-1R and p-AKT expression was analyzed by immunohistochemistry. Formalin fixed paraffin-embedded tissue microarrays (TMA) were cut at 4 μm, deparaffinized with xylene and rehydrated in graded ethanol. Antigen retrieval was performed by heating the slides at 95 °C for 20 minutes in 10 mM sodium citrate buffer (pH 6.0) for both antibodies. Endogenous peroxidase blocking solution (EnVision+ System HRP (DAB), Dako, CA) was applied on the tissue for 10 minutes followed by incubation in protein-free T20 (TBS) blocking buffer (Thermo Scientific, IL) for 1 hour. Samples were then incubated with either rabbit polyclonal antibody IGF-1 Receptor β (dilution 1:100, Cell Signalling Technology, Danvers, MA) or rabbit monoclonal anti-phospho-Akt (Ser-473) (dilution 1:50, Cell Signalling Technology, Danvers, MA) overnight in a humid chamber at 4°C. After several washes with TBST buffer, the slides were incubated for 30 min with labelled polymer-HRP as a secondary antibody and then immune reactions were visualized with 3′,3′-diaminobenzidine as the chromogen (EnVision+ System HRP (DAB), Dako, CA). The slides were counterstained with hematoxylin, dehydrated, and mounted. During all the runs, negative control specimens were included by replacing the primary antibodies with buffer solution. As positive controls, specimens of human prostatic adenocarcinoma and formalin fixed paraffin-embedded Rh4 rhabdomyosarcoma xenograft cell line with a high level of IGF-1R were used for p-AKT and IGF-1R respectively, according to the vendor’s instructions and as reported previously 21.
The sections were reviewed and scored by a pathologist that was blinded to patient’s information and clinical outcome. The analysis of the specific protein staining (IGF-1R: membranous and cytoplasmic; p-AKT: cytoplasmic and nuclear) took into consideration both the percentage and the staining intensity of positive tumor cells 22. The staining intensity was scored as negative (0), weak (1), moderate (2) or strong (3). The percentage of positive cells was scored as 0 for 0–5% positive cells, 1 for 6–26%, 2 for 26–50%, 3 for 51–75% and 4 for 76–100%. The IHC score was obtained by multiplying intensity by percentage of positive cells. For IGF1R we scored as G0 (negative) IHC score 0–2, G1 3–5, G2 6–8 and G3 9–12. For p-AKT we scored as G0 (negative) samples with IHC score 0–1, as G1 2–3 as G2 3–4, and as G3 6–12.
Statistical analysis
Clinical and biological characteristics were compared using the Fisher’s exact or χ2 tests when appropriate. Correlations were considered significant at the <0.05 level (two tailed). Survival curves were generated using the Kaplan-Meier method, and differences between curves were analyzed using the log-rank test. Survival was calculated from the date of the primary surgery to death. Overall survival, disease related survival and progression free survival were calculated. Disease-related survival was calculated excluding patients who died of causes other than progression of TEM. A Cox Regression multivariate analysis of prognostic factors was performed. All tests were done using the SPSS version 17 (SPSS Inc. Chicago, IL).
Results
Patient outcome
Data from 132 patients were collected. The main patient and tumor characteristics are summarized in Table 1. Most of the samples were collected at the primary surgery. The median age was 55 years and the male : female ratio was of 1:1. Most of the patients had an early stage of the disease (59% stage I and II) and underwent a radical resection (R0, 59.8%). Survival was assessable in all patients, and median follow up was 7 years (84.5 months; 95%CI 72.1–96.9). Thirty-one patients (23.5%) were reported dead at the update performed in June 2009. The median overall survival (OS) was 31.5 years (377.8 months; 95%CI 112.5–634.2) with a 10-year OS of 70% (Figure 1A). Only 13 patients (9.8%) died of disease progression, 2 patients died of myasthenia gravis and 4 of a secondary cancer (3 hepatocellular carcinomas and 1 non-small cell carcinoma of the lung). The median Disease-Related Survival (DRS) was not reached after 32 years follow-up. The 10-year DRS was 87% (Figure 1B). A total of 131 patients were evaluable for Progression-Free Survival (PFS); for 1 patient no updated information on the progression date was available. Thirty-six patients developed progression during the period of study. The median PFS was 12.3 years (147 months; 95%CI 121.6–172.4), and the 10-year PFS rate was 69% (Figure 1C). Of the potential clinical prognostic factors analyzed staging, histology, and resection type had significant influence on DRS (Figure 1D) and PFS (Table 2), but not on OS, by univariate analysis. Thymic carcinomas had a worse DRS and PFS than thymomas (LogRank p=0.002; p=0.021 respectively). The 10-year DRS was 91% for thymomas and 60% for thymic carcinomas, whereas the 10-year PFS was 72% and 43%, respectively. Gender was a significant prognostic factor for DRS (p=0.046) with a more favourable outcome for female. Patients older than 55 years had a worse OS than patients aged 55 or younger, but this was not reflected by a worse DRS or PFS. Information on the presence of paraneoplastic syndromes was available in 125 patients: 32 (25.6%) developed myasthenia gravis during the course of the disease, one patient developed autoimmune encephalopathy and one patient developed autoimmune glomerulonephritis. Paraneoplastic syndromes did not have a significant impact on survival.
Table 1.
Patient characteristics (n=132)
| Sex | Male/female | 67/65 |
|---|---|---|
| Median age (range), years | 55 (20–86) | |
| Primary surgery | 108 (81.8%) | |
| Surgery at relapse | 24 (18.2%) | |
| Paraneoplastic Syndromes | Myasthenia Gravis | 32 (25.6%) |
| Other Syndromes | 2 (1.6%) | |
| WHO histotype | A | 15 (11.4%) |
| AB | 28 (21.2%) | |
| B1 | 24 (18.2%) | |
| B1,B2 | 6 (4.5%) | |
| B2 | 8 (6.1%) | |
| B2,B3 | 11 (8.3%) | |
| B3 | 24 (18.2%) | |
| C | 14 (10.6%) | |
| Other* | 2 (1.5%) | |
| Stage | I | 35 (26.5%) |
| IIA | 26 (19.7%) | |
| IIB | 17 (12.9%) | |
| IIIA | 16 (12.1%) | |
| IIIB | 3 (2.3%) | |
| IVA | 5 (3.8%) | |
| IVB | 12 (9.1%) | |
| na** | 18 (13.6%) | |
| Type of Resection | R0 | 79 (59.8%) |
| R1 | 23 (17.4%) | |
| R2 | 10 (7.6%) | |
| na*** | 20 (15.1%) |
One micronodular and 1 cystic thymoma. Na=not assessable :
For 18 patients the stage at the diagnosis was not assessable.
For 20 patients there was insufficient information to assess the completeness of resection of the first surgery.
Figure 1.
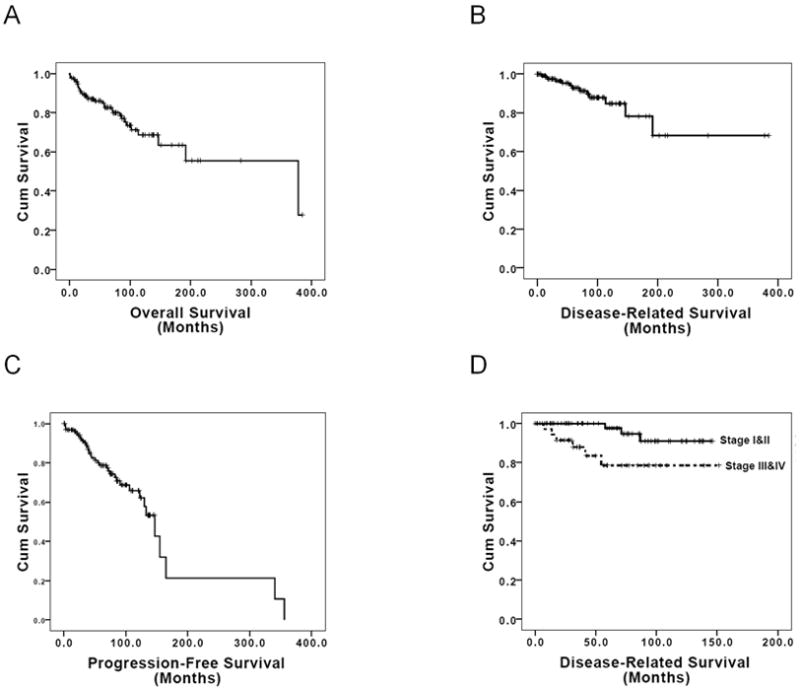
Kaplan-Meier survival estimate curves for A) Overall Survival, B) Disease-Related Survival, C) Progression-Free Survival, D) Disease-Related Survival for patients with stages I and II versus stages III and IV.
Table 2.
Univariate analysis of potential prognostic factors.
| Parameter | 10-year OS* | SE | OS LogRank | 10-year DRS* | SE | DRS LogRank | 10-year PFS* | SE | PFS LogRank |
|---|---|---|---|---|---|---|---|---|---|
| Sex | 0.544 | 0.046 | 0.151 | ||||||
| Male | 68% (16) | 0.07 | 80% (16) | 0.06 | 65% (13) | 0.07 | |||
| Female | 73% (11) | 0.07 | 95% (11) | 0.04 | 73% (7) | 0.07 | |||
| Stage I&II vs III&IV | 0.087 | 0.017 | 0.003 | ||||||
| I&II | 77% (13) | 0.06 | 94% (13) | 0.04 | 85% (11) | 0.05 | |||
| III&IV | 55% (2) | 0.1 | 73% (2) | 0.09 | 53% (1) | 0.1 | |||
| Histology | 0.326 | 0.049 | 0.005 | ||||||
| A | NR | NR | NR | ||||||
| AB | 84% (7) | 0.09 | 100% (6) | 0 | 94% (6) | 0.06 | |||
| B1 | 71% (5) | 0.11 | 93% (5) | 0.06 | 80% (3) | 0.1 | |||
| B1,B2 | NR | NR | NR | ||||||
| B2 | 71% (4) | 0.17 | 85% (4) | 0.14 | 57% (3) | 0.19 | |||
| B2,B3 | 86% (2) | 0.13 | 86% (2) | 0.13 | 73% (2) | 0.16 | |||
| B3 | 60% (8) | 0.11 | 78% (8) | 0.1 | 40% (4) | 0.11 | |||
| C | 52% (2) | 0.15 | 60% (2) | 0.15 | 43% (2) | 0.15 | |||
| Resection type | 0.439 | 0.049 | 0.028 | ||||||
| R0 | 73% (11) | 0.06 | 89% (11) | 0.04 | 83% (10) | 0.05 | |||
| R1 | 67% (2) | 0.12 | 92% (2) | 0.07 | 66% (1) | 0.12 | |||
| R2 | 47% (1) | 0.18 | 57% (1) | 0.19 | 47% (1) | 0.18 | |||
| Paraneoplastic syndromes | 0.203 | 0.714 | 0.421 | ||||||
| Yes | 79% (17) | 0.08 | 85% (17) | 0.07 | 67% (12) | 0.09 | |||
| No | 68% (9) | 0.06 | 90% (9) | 0.04 | 74% (8) | 0.06 | |||
| Age ≤55 vs >55 | 0.007 | 0.801 | 0.289 | ||||||
| ≤55 | 79% (19) | 0.6 | 85% (19) | 0.05 | 60% (12) | 0.07 | |||
| >55 | 61% (8) | 0.7 | 90% (8) | 0.05 | 79% (8) | 0.06 | |||
| Age<40 vs 40–65 vs >65 | 0.15 | 0.735 | 0.110 | ||||||
| <40 | 71% (7) | 0.11 | 76% (7) | 0.01 | 57% (6) | 0.12 | |||
| 40–65 | 79% (18) | 0.06 | 88% (18) | 0.05 | 65% (12) | 0.07 | |||
| >65 | 52% (2) | 0.1 | 94% (2) | 0.05 | 89% (2) | 0.07 | |||
| IGF-1R | 0.762 | 0.310 | 0.083 | ||||||
| Positive | 73% (4) | 0.11 | 79% (4) | 0.11 | 49% (4) | 0.12 | |||
| Negative | 71% (19) | 0.06 | 93% (19) | 0.03 | 78% (14) | 0.05 | |||
| p-AKT cytoplasmic | 0.606 | 0.106 | 0.335 | ||||||
| Positive | 74% (15) | 0.7 | 83% (15) | 0.06 | 67% (14) | 0.08 | |||
| Negative | 69% (7) | 0.8 | 97% (7) | 0.03 | 75% (3) | 0.08 | |||
| p-AKT nuclear | 0.845 | 0.245 | 0.915 | ||||||
| Positive | 73% (12) | 0.7 | 85% (12) | 0.06 | 68% (10) | 0.08 | |||
| Negative | 65% (9) | 0.7 | 94% (9) | 0.04 | 74% (6) | 0.02 |
SE= standard error; NR= not reached : the 5-year OS was 71% for type A and 100% for type B1,B2; the 5-year DRS was 100% for type A and 100% for type B1,B2; the 5 year PFS was 100% for type A and 78% for B1,B2. OS= overall survival; DRS= disease-related survival; PFS= progression-free survival.
the numbers in parenthesis represent the number of patients alive or not progressing at 10 years.
Of 109 patients resected for their primary tumor, for whom information on further treatment is available, only 12 patients received chemotherapy either as adjuvant (3) or at relapse (9). No apparent impact of chemotherapy could be observed.
Immunohistochemistry
IGF-1R
A total of 111 cases were evaluable for IGF-1R immunohistochemistry staining; the remaining 21 did not have adequate material on TMA. Twenty-two cases (19.8%) were positive for IGF-1R staining (Figure 2A and 2B) : 19.8% of the 91 primary tumors and 20% of 20 relapsed tumors (Table 3). There were 16 G1, 3 G2 and 3 G3 IGF1R positive samples.
Figure 2.
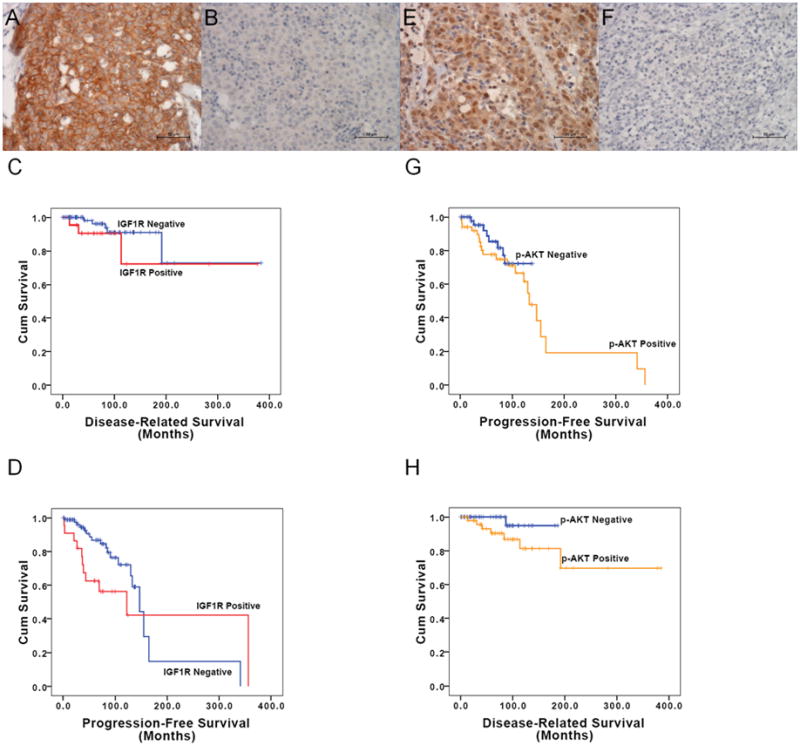
IGF-1R and p-AKT immunohistochemical staining: A) sample with positive IGF-1R membrane staining; B) sample with negative IGF-1R membrane staining; C) Kaplan-Meier curves for Disease-Related Survival of TEM patients with positive and negative IGF-1R expression; D) Kaplan-Meier curves for Progression-Free Survival of TEM patients with positive and negative IGF-1R expression; E) sample with positive p-AKT cytoplasmic staining; F) sample with negative p-AKT cytoplasmic staining; G) Kaplan-Meier curves of Disease-Related Survival of patients with TEM positive and negative p-AKT expression; H) Kaplan-Meier curves of Progression-Free Survival of patients with TEM positive and negative p-AKT expression.
Table 3.
Results of immunohistochemistry for IGF-1R and p-AKT
| IGF-1R Positive | G1 | G2 | G3 | p-value | p-AKT positive (cytoplasmic) | G1 | G2 | G3 | p-value | ||
|---|---|---|---|---|---|---|---|---|---|---|---|
| 22/111 (19.8%) | 51/105 (48.6%) | ||||||||||
| Tumor | p=0.589 | p=0.015 | |||||||||
| Primary | 18/91 (19.8%) | 12 | 3 | 3 | 36/86 (41.9%) | 15 | 16 | 5 | |||
| Relapse | 4/20 (20%) | 4 | 0 | 0 | 15/19 (78.9%) | 5 | 8 | 2 | |||
| Gender | p=0.683 | p=0.958 | |||||||||
| Female | 12/59 (20.3%) | 8 | 2 | 2 | 29/58 (50%) | 12 | 14 | 3 | |||
| Male | 10/52 (19.2%) | 8 | 1 | 1 | 22/47 (46.8%) | 8 | 10 | 4 | |||
| WHO histotype | |||||||||||
| A | 0/8 (0%) | 0 | 0 | 0 | 2/8 (25%) | 1 | 1 | 0 | |||
| AB | 2/26 (7.7%) | 2 | 0 | 0 | 10/26 (38.5%) | 5 | 5 | 0 | |||
| B1 | 0/24 (0%) | 0 | 0 | 0 | p=0.0091 | 6/22 (27.3%) | 3 | 3 | 0 | p=0.0011 | |
| B1/B2 | 0/6 (0%) | 0 | 0 | 0 | 2/6 (33.3%) | 2 | 0 | 0 | |||
| B2 | 0/8 (0%) | 0 | 0 | 0 | 7/8 (87.5%) | 2 | 4 | 1 | |||
| B2/B3 | 3/10 (30%) | 1 | 2 | 0 | 9/9 (100%) | 2 | 5 | 2 | |||
| B3 | 9/19 (47.4%) | 8 | 1 | 0 | 9/17 (52.9%) | 3 | 4 | 2 | |||
| C | 7/8 (87.5%) | 4 | 0 | 3 | p=0.0052 | 6/8 (75%) | 2 | 2 | 2 | p=0.2342 | |
| Other* | 1/2 (50%) | 1 | 0 | 0 | 0/1 (0%) | 0 | 0 | 0 | |||
| Stage | p=0.0583 | p=0.00133 | |||||||||
| I | 5/28 (17.9%) | 3 | 1 | 1 | 7/25 (28%) | 4 | 3 | 0 | |||
| IIA | 2/24 (8.3%) | 2 | 0 | 0 | 9/25 (36%) | 5 | 4 | 0 | |||
| IIB | 0/16 (0%) | 0 | 0 | 0 | 6/13 (46.2%) | 3 | 2 | 1 | |||
| IIIA | 5/14 (35.7%) | 2 | 2 | 1 | 6/14 (42.9%) | 1 | 5 | 0 | |||
| IIIB | 1/3 (33%) | 1 | 0 | 0 | 3/3 (100%) | 1 | 1 | 1 | |||
| IVA | 2/3 (66%) | 2 | 0 | 0 | 2/3 (66%) | 0 | 1 | 1 | |||
| IVB | 3/8 (37.5%) | 2 | 0 | 1 | 6/7 (85.7%) | 2 | 2 | 2 | |||
| na** | 4/15 (26.7%) | 4 | 0 | 0 | 12/15 (80%) | 4 | 6 | 2 | |||
| Completeness of Resection | p=0.3654 | p=0.2874 | |||||||||
| R0 | 7/66 (10.6%) | 4 | 1 | 2 | 25/62 (40.3%) | 11 | 11 | 3 | |||
| R1 | 6/21 (28.6%) | 3 | 2 | 1 | 8/20 (40%) | 2 | 6 | 0 | |||
| R2 | 5/8 (62.5%) | 5 | 0 | 0 | 6/7 (85.7%) | 3 | 1 | 2 | |||
| na*** | 4/16 (25%) | 4 | 0 | 0 | 12/16 (75%) | 4 | 6 | 2 | |||
One micronodular and 1 cystic thymoma.
For 15 patients the stage at the diagnosis was not assessable.
For 16 patients there was insufficient information to assess the completeness of resection at the first surgery.
Comparison between A, AB and B1 vs B1/B2, B2, B2/B3, B3 and C.
Comparison between A, AB, B1, B1/B2, B2, B2/B3 and B3 vs C.
Comparison between stage I and II vs III and IV.
Comparison R0 vs R1 and R2
IGF-1R expression was significantly less common (Fisher exact test p<0.0001) in the histotype group including A, AB and B1 where it was expressed in 2 out of 58 cases (3.4%), compared to the more aggressive histotypes B1/B2, B2, B2/B3, B3 and C, where there were 19 positive cases out of 51 (37.2%). The G2 and G3 samples were all in the more aggressive histotype group. With this subdivision, 6/51 and 0/58 samples were G2-G3 in the more aggressive group and in the less aggressive group, respectively (Fisher exact test p=0.009). When the histological groups were divided into thymic carcinomas and thymomas, 3/8 and 3/103 samples were G2-G3 in thymic carcinomas and in thymomas, respectively (Fisher exact test p=0.005). IGF-1R expression was significantly more common in stages III and IV (11/28, 39.3%) than in stages I and II (7/68, 10.3%) (χ2 =10.942 p=0.001). Four of 6 G2-G3 samples were associated to a more advanced stage. IGF-1R expression was also significantly more commonly positive in R2 resections than in R0 resections (62.5% vs 10.6%, respectively; Fisher test for the three variables p=0.002). Although there was a trend for patients with IGF-1R expression to have a worse DRS than patients without IGF-1R expression, this difference was not statistically significant (p=0.301) (Table 3 and Figure 2C). Considering only the primary or only the relapsed tumors, there was also no statistically significant difference in terms of DRS between patients with positive and negative IGF-1R expression (p=0.178 and p=0.960, respectively). The estimated median PFS was 10.2 years (122.5 months; 95% CI 13.2–231.8) for the IGF-1R positive group, and 12.9 years (147 months; 95% CI 119.1–174.9) for the negative group (LogRank test p value was 0.083; Breslow test p value was 0.003) (Figure 2D). Considering only the primary tumors, the 5-year PFS were 96% and 65% respectively for IGF1R positive and negative cases (LogRank p<0.001). No statistically significant difference in PFS was observed in relapsed patients (LogRank p=0.609; 5-year PFS for IGF1R positive was 63% and 50% for IGF-1R negative cases).
p-AKT
Staining of p-AKT was observed both in the cytoplasmic and nuclear compartments of the cells. Nuclear staining of p-AKT was present in 51 of 105 evaluable cases (48.6%) (Figure 2E and 2F): 36/86 primary tumors (41.9%), and 15/19 relapsed tumors (78.9%) (Table 3). Calculated on the basis of IHC scores, 20 of the nuclear-positive cases belonged to G1, 24 G2 and 7 G3. For further analysis, we selectively analyzed the cytoplasmic p-Akt positive cells only, because the main function of p-AKT is in this compartment. Of the thymoma group including the histological types A, AB and B1, 18/56 tumor specimens were cytoplasmic p-AKT positive (32.1%), vs 33/48 in the more aggressive histological types B1/B2, B2, B2/B3, B3 and C (68.7%), and this difference was statistically significant (χ2 =13.860 p<0.0001). With this subdivision, 22/48 and 9/56 samples were G2-G3 in the more aggressive group and in the less aggressive group, respectively (χ2 =10.942 p=0.001), suggesting that higher IHC scores associate with more aggressive histotypes. When the histological groups were divided into thymic carcinomas and thymomas, the G2-G3 staining was not significantly higher in thymic carcinomas (4/8) than in thymomas (27/97) (Fisher exact test p=0.231). p-AKT expression was higher in stage III and IV (17/27; 62.9%) than in stage I and II (22/63, 34.9%) (χ2 =6.053 p=0.014). Score distribution of high (III-IV)/low (I-II) stage was the following: G0 41/10, G1 12/4, G2 9/9, and G3 1/4, respectively. p-AKT expression was more frequent in R2 and R1 than in R0 samples (Fisher test p<0.007). Although DRS was worse in patients with p-AKT expression compared with patients without p-AKT expression, this difference was not statistically significant (p=0.106) (Table 2 and Figure 2G). The difference was also not significant when primary tumors or recurrences were considered separately (p=0.207 and p=0.388, respectively). There was also no statistically significant difference in PFS, between patients with or without p-AKT expression (p=0.355) (Figure 2H). The tumor specimens of 104 patients were evaluable for both IGF-1R and p-AKT expression. Of 51 p-AKT positive samples 16 were also positive for IGF1R (χ2 =0.005).
By multivariate analysis no independent prognostic factor was identified for DRS, whereas WHO classification was an independent prognostic factor for PFS (p=0.008).
Discussion
This analysis included 132 TEM patients who underwent surgery at a single institution, with a long follow-up (7 years). Most patients had early stage disease and complete resection, which is reflected by an overall median survival of 31.5 years. In most surgical series the Masaoka staging and the completeness of the resection are the most important prognostic factors 6. Thymoma is one of the few tumors where even tumor debulking can improve survival 4, 6. Surgery appears to have a much higher rate of failure in higher WHO types, such as in thymic carcinomas (WHO type C)23, and this is also confirmed in our study. However, the WHO classification has not always been confirmed as an accurate prognostic factor 24. Because of the more common occurrence of paraneoplastic syndromes, some of which may prove fatal, and secondary cancers, the disease-related survival (DRS) and progression-free survival are usually more informative than the overall survival in these patients who otherwise have a very long life expectancy. When considering DRS, female patients had a better survival than males, a phenomenon that has been observed in other tumors, such as lung cancer and lymphomas, but not reported before in TEM 25.
The present study demonstrated that protein expression of IGF-1R and p-AKT is common in all histological subtypes of TEM. Interestingly, the expression of both IGF-1R and p-AKT is significantly correlated with the more aggressive histological subtypes. Completeness of resection is strongly related to the stage at the diagnosis as evidenced by multivariate analysis. We identified higher IGF-1R and p-AKT expression in more advanced stages at diagnosis and in incomplete resections. Also, samples derived from a recurrence had higher expression than primary tumors. All these findings strongly suggest that this pathway may be important for tumor progression and may potentially be targeted for treatment, especially in patients with advanced stages and aggressive histological types. p-Akt expression can be considered a marker for activated IGF-1R signalling, as 80% of activated AKT is suggested to be caused by IR/IGF-1R pathway activation 15. In breast cancer, IGF-1R expression and activation have been associated to disease progression, increased resistance to radiotherapy and poor prognosis 26. In lung cancer, a statistically significant association was observed between high co-expression of both IGF-1R and EGFR, and worse DFS in early disease 27, but not between IGF-1R alone and DFS or OS. In our series of patients with thymic tumors we observed a trend towards a worse survival in patients with IGF-1R positive tumors, but this did not reach statistical significance. PFS however was significantly worse in primary IGF-1R positive tumors.
A better understanding of the biology of this rare tumor may allow the identification of potential prognostic markers and drug targets. The IGF system of ligands, receptors, and soluble binding proteins has been implicated in local and distant tumor spreading. The demonstration of IGF-1R involvement in malignant transformation 28, 29 and the frequent detection of IGF-1R expression in human cancer have in part contributed to the efforts to develop IGF-1R targeted therapy. Frequent loss of heterozygosity of 6q23.3–25.3, which contains IGF-2R, has been reported in TEM 30, where it is possible that IGF-1R may be upregulated to compensate for the loss of IGF-2R. Indirectly a loss of IGF-2R may lead to increase of IGF and stimulation of IGF-1R. Furthermore, IGF2BP3, a translational activator of IGF-II, has recently been found to be highly overexpressed in thymic carcinomas 31.
Drugs targeted at growth factor receptors have been investigated in advanced TEMs. Phase II trials failed to demonstrate activity of gefitinib (EGFR inhibitor) and imatinib (c-KIT inhibitor) 32–34. The activity of these agents is mainly limited to tumors that bear sensitizing mutations in the ATP binding domain of these tyrosine kinases, and most TEMs do not have mutations of c-KIT or EGFR 35–38. On the other hand, continuous activation of the PI3K–AKT pathway is considered an important mechanism of tumor growth and resistance to anti-EGFR therapies. Preclinical data on cell lines suggest that IGF-1R mediates resistance to anti-EGFR therapy through continued activation of the PI3K–AKT pathway 39, 40.
In conclusion, the expression of IGF-1R was observed in a significant percentage of TEMs and associated with more aggressive tumors suggesting that IGF-1R may be a potential target of treatment in thymic tumors. Furthermore, this retrospective analysis confirms the importance of stage, completeness of resection, and WHO histological type as prognostic factors.
Based on our findings and the prolonged stabilizations observed in two phase I studies of IGF-1R monoclonal antibodies in two patients with metastatic thymoma 17, 18, a phase II trial with the anti-IGF-1R antibody IMC-A12 has recently started accruing at the National Cancer Institute in patients with thymoma and thymic carcinoma.
Acknowledgments
This work was funded by the NIH/NCI intramural program.
Footnotes
ClinicalTrials.gov ID: NCT00965627
References
- 1.Engels EA, Pfeiffer RM. Malignant thymoma in the United States: demographic patterns in incidence and associations with subsequent malignancies. Int J Cancer. 2003;105(4):546–51. doi: 10.1002/ijc.11099. Available from http://www.ncbi.nlm.nih.gov/entrez/query.fcgi?cmd=Retrieve&db=PubMed&dopt=Citation&list_uids=12712448. [DOI] [PubMed]
- 2.Takeda S, Miyoshi S, Akashi A, Ohta M, Minami M, Okumura M, et al. Clinical spectrum of primary mediastinal tumors: a comparison of adult and pediatric populations at a single Japanese institution. J Surg Oncol. 2003;83(1):24–30. doi: 10.1002/jso.10231. Available from http://www.ncbi.nlm.nih.gov/entrez/query.fcgi?cmd=Retrieve&db=PubMed&dopt=Citation&list_uids=12722093. [DOI] [PubMed]
- 3.Okumura M, Ohta M, Tateyama H, Nakagawa K, Matsumura A, Maeda H, et al. The World Health Organization histologic classification system reflects the oncologic behavior of thymoma: a clinical study of 273 patients. Cancer. 2002;94(3):624–32. doi: 10.1002/cncr.10226. Available from http://www.ncbi.nlm.nih.gov/entrez/query.fcgi?cmd=Retrieve&db=PubMed&dopt=Citation&list_uids=11857293. [DOI] [PubMed]
- 4.Maggi G, Giaccone G, Donadio M, Ciuffreda L, Dalesio O, Leria G, et al. Thymomas. A review of 169 cases, with particular reference to results of surgical treatment. Cancer. 1986;58(3):765–76. doi: 10.1002/1097-0142(19860801)58:3<765::aid-cncr2820580326>3.0.co;2-s. Available from http://www.ncbi.nlm.nih.gov/entrez/query.fcgi?cmd=Retrieve&db=PubMed&dopt=Citation&list_uids=3731027. [DOI] [PubMed]
- 5.Inoue M, Starostik P, Zettl A, Strobel P, Schwarz S, Scaravilli F, et al. Correlating genetic aberrations with World Health Organization-defined histology and stage across the spectrum of thymomas. Cancer Res. 2003;63(13):3708–15. Available from http://www.ncbi.nlm.nih.gov/entrez/query.fcgi?cmd=Retrieve&db=PubMed&dopt=Citation&list_uids=12839963. [PubMed]
- 6.Kondo K, Monden Y. Therapy for thymic epithelial tumors: a clinical study of 1,320 patients from Japan. Ann Thorac Surg. 2003;76(3):878–84. doi: 10.1016/s0003-4975(03)00555-1. discussion 84–5. Available from http://www.ncbi.nlm.nih.gov/entrez/query.fcgi?cmd=Retrieve&db=PubMed&dopt=Citation&list_uids=12963221. [DOI] [PubMed]
- 7.Rajan A, Giaccone G. Treatment of advanced thymoma and thymic carcinoma. Curr Treat Options Oncol. 2008;9(4–6):277–87. doi: 10.1007/s11864-009-0083-7. Available from http://www.ncbi.nlm.nih.gov/entrez/query.fcgi?cmd=Retrieve&db=PubMed&dopt=Citation&list_uids=19381821. [DOI] [PMC free article] [PubMed]
- 8.Hernandez-Ilizaliturri FJ, Tan D, Cipolla D, Connolly G, Debb G, Ramnath N. Multimodality therapy for thymic carcinoma (TCA): results of a 30-year single-institution experience. Am J Clin Oncol. 2004;27(1):68–72. doi: 10.1097/01.coc.0000046301.83671.09. Available from http://www.ncbi.nlm.nih.gov/entrez/query.fcgi?cmd=Retrieve&db=PubMed&dopt=Citation&list_uids=14758136. [DOI] [PubMed]
- 9.Lucchi M, Mussi A, Ambrogi M, Gunfiotti A, Fontanini G, Basolo F, et al. Thymic carcinoma: a report of 13 cases. Eur J Surg Oncol. 2001;27(7):636–40. doi: 10.1053/ejso.2001.1197. Available from http://www.ncbi.nlm.nih.gov/entrez/query.fcgi?cmd=Retrieve&db=PubMed&dopt=Citation&list_uids=11669591. [DOI] [PubMed]
- 10.Dufourny B, Alblas J, van Teeffelen HA, van Schaik FM, van der Burg B, Steenbergh PH, et al. Mitogenic signaling of insulin-like growth factor I in MCF-7 human breast cancer cells requires phosphatidylinositol 3-kinase and is independent of mitogen-activated protein kinase. J Biol Chem. 1997;272(49):31163–71. doi: 10.1074/jbc.272.49.31163. Available from http://www.ncbi.nlm.nih.gov/entrez/query.fcgi?cmd=Retrieve&db=PubMed&dopt=Citation&list_uids=9388270. [DOI] [PubMed]
- 11.Khandwala HM, McCutcheon IE, Flyvbjerg A, Friend KE. The effects of insulin-like growth factors on tumorigenesis and neoplastic growth. Endocr Rev. 2000;21(3):215–44. doi: 10.1210/edrv.21.3.0399. Available from http://www.ncbi.nlm.nih.gov/entrez/query.fcgi?cmd=Retrieve&db=PubMed&dopt=Citation&list_uids=10857553. [DOI] [PubMed]
- 12.Baserga R, Hongo A, Rubini M, Prisco M, Valentinis B. The IGF-I receptor in cell growth, transformation and apoptosis. Biochim Biophys Acta. 1997;1332(3):F105–26. doi: 10.1016/s0304-419x(97)00007-3. Available from http://www.ncbi.nlm.nih.gov/entrez/query.fcgi?cmd=Retrieve&db=PubMed&dopt=Citation&list_uids=9196021. [DOI] [PubMed]
- 13.Blakesley VA, Stannard BS, Kalebic T, Helman LJ, LeRoith D. Role of the IGF-I receptor in mutagenesis and tumor promotion. J Endocrinol. 1997;152(3):339–44. doi: 10.1677/joe.0.1520339. Available from http://www.ncbi.nlm.nih.gov/entrez/query.fcgi?cmd=Retrieve&db=PubMed&dopt=Citation&list_uids=9071953. [DOI] [PubMed]
- 14.Chu YW, Schmitz S, Choudhury B, Telford W, Kapoor V, Garfield S, et al. Exogenous insulin-like growth factor 1 enhances thymopoiesis predominantly through thymic epithelial cell expansion. Blood. 2008;112(7):2836–46. doi: 10.1182/blood-2008-04-149435. Available from http://www.ncbi.nlm.nih.gov/entrez/query.fcgi?cmd=Retrieve&db=PubMed&dopt=Citation&list_uids=18658030. [DOI] [PMC free article] [PubMed]
- 15.Pollak M. Insulin and insulin-like growth factor signalling in neoplasia. Nat Rev Cancer. 2008;8(12):915–28. doi: 10.1038/nrc2536. Available from http://www.ncbi.nlm.nih.gov/entrez/query.fcgi?cmd=Retrieve&db=PubMed&dopt=Citation&list_uids=19029956. [DOI] [PubMed]
- 16.Bruchim I, Attias Z, Werner H. Targeting the IGF1 axis in cancer proliferation. Expert Opin Ther Targets. 2009;13(10):1179–92. doi: 10.1517/14728220903201702. Available from http://www.ncbi.nlm.nih.gov/entrez/query.fcgi?cmd=Retrieve&db=PubMed&dopt=Citation&list_uids=19663648. [DOI] [PubMed]
- 17.Haluska P, Shaw HM, Batzel GN, Yin D, Molina JR, Molife LR, et al. Phase I dose escalation study of the anti insulin-like growth factor-I receptor monoclonal antibody CP-751,871 in patients with refractory solid tumors. Clin Cancer Res. 2007;13(19):5834–40. doi: 10.1158/1078-0432.CCR-07-1118. Available from http://www.ncbi.nlm.nih.gov/entrez/query.fcgi?cmd=Retrieve&db=PubMed&dopt=Citation&list_uids=17908976. [DOI] [PubMed]
- 18.McKian KP, Haluska P. Cixutumumab. Expert Opin Investig Drugs. 2009;18(7):1025–33. doi: 10.1517/13543780903055049. Available from http://www.ncbi.nlm.nih.gov/entrez/query.fcgi?cmd=Retrieve&db=PubMed&dopt=Citation&list_uids=19548856. [DOI] [PMC free article] [PubMed]
- 19.Masaoka A, Yamakawa Y, Niwa H, Fukai I, Saito Y, Tokudome S, et al. Thymectomy and malignancy. Eur J Cardiothorac Surg. 1994;8(5):251–3. doi: 10.1016/1010-7940(94)90155-4. Available from http://www.ncbi.nlm.nih.gov/entrez/query.fcgi?cmd=Retrieve&db=PubMed&dopt=Citation&list_uids=8043287. [DOI] [PubMed]
- 20.Strobel P, Bauer A, Puppe B, Kraushaar T, Krein A, Toyka K, et al. Tumor recurrence and survival in patients treated for thymomas and thymic squamous cell carcinomas: a retrospective analysis. J Clin Oncol. 2004;22(8):1501–9. doi: 10.1200/JCO.2004.10.113. Available from http://www.ncbi.nlm.nih.gov/entrez/query.fcgi?cmd=Retrieve&db=PubMed&dopt=Citation&list_uids=15084623. [DOI] [PubMed]
- 21.Cao L, Yu Y, Darko I, Currier D, Mayeenuddin LH, Wan X, et al. Addiction to elevated insulin-like growth factor I receptor and initial modulation of the AKT pathway define the responsiveness of rhabdomyosarcoma to the targeting antibody. Cancer Res. 2008;68(19):8039–48. doi: 10.1158/0008-5472.CAN-08-1712. Available from http://www.ncbi.nlm.nih.gov/entrez/query.fcgi?cmd=Retrieve&db=PubMed&dopt=Citation&list_uids=18829562. [DOI] [PMC free article] [PubMed]
- 22.Sinicrope FA, Ruan SB, Cleary KR, Stephens LC, Lee JJ, Levin B. bcl-2 and p53 oncoprotein expression during colorectal tumorigenesis. Cancer Res. 1995;55(2):237–41. Available from http://www.ncbi.nlm.nih.gov/entrez/query.fcgi?cmd=Retrieve&db=PubMed&dopt=Citation&list_uids=7812951. [PubMed]
- 23.Nakagawa K, Asamura H, Matsuno Y, Suzuki K, Kondo H, Maeshima A, et al. Thymoma: a clinicopathologic study based on the new World Health Organization classification. J Thorac Cardiovasc Surg. 2003;126(4):1134–40. doi: 10.1016/s0022-5223(03)00798-0. Available from http://www.ncbi.nlm.nih.gov/entrez/query.fcgi?cmd=Retrieve&db=PubMed&dopt=Citation&list_uids=14566259. [DOI] [PubMed]
- 24.Chen G, Marx A, Wen-Hu C, Yong J, Puppe B, Stroebel P, et al. New WHO histologic classification predicts prognosis of thymic epithelial tumors: a clinicopathologic study of 200 thymoma cases from China. Cancer. 2002;95(2):420–9. doi: 10.1002/cncr.10665. Available from http://www.ncbi.nlm.nih.gov/entrez/query.fcgi?cmd=Retrieve&db=PubMed&dopt=Citation&list_uids=12124843. [DOI] [PubMed]
- 25.Jemal A, Siegel R, Ward E, Hao Y, Xu J, Thun MJ. Cancer statistics, 2009. CA Cancer J Clin. 2009;59(4):225–49. doi: 10.3322/caac.20006. Available from http://www.ncbi.nlm.nih.gov/entrez/query.fcgi?cmd=Retrieve&db=PubMed&dopt=Citation&list_uids=19474385. [DOI] [PubMed]
- 26.Rocha RL, Hilsenbeck SG, Jackson JG, VanDenBerg CL, Weng C, Lee AV, et al. Insulin-like growth factor binding protein-3 and insulin receptor substrate-1 in breast cancer: correlation with clinical parameters and disease-free survival. Clin Cancer Res. 1997;3(1):103–9. Available from http://www.ncbi.nlm.nih.gov/entrez/query.fcgi?cmd=Retrieve&db=PubMed&dopt=Citation&list_uids=9815544. [PubMed]
- 27.Ludovini V, Bellezza G, Pistola L, Bianconi F, Di Carlo L, Sidoni A, et al. High coexpression of both insulin-like growth factor receptor-1 (IGFR-1) and epidermal growth factor receptor (EGFR) is associated with shorter disease-free survival in resected non-small-cell lung cancer patients. Ann Oncol. 2009;20(5):842–9. doi: 10.1093/annonc/mdn727. Available from http://www.ncbi.nlm.nih.gov/entrez/query.fcgi?cmd=Retrieve&db=PubMed&dopt=Citation&list_uids=19153117. [DOI] [PubMed]
- 28.Brodt P, Samani A, Navab R. Inhibition of the type I insulin-like growth factor receptor expression and signaling: novel strategies for antimetastatic therapy. Biochem Pharmacol. 2000;60(8):1101–7. doi: 10.1016/s0006-2952(00)00422-6. Available from http://www.ncbi.nlm.nih.gov/entrez/query.fcgi?cmd=Retrieve&db=PubMed&dopt=Citation&list_uids=11007947. [DOI] [PubMed]
- 29.Valentinis B, Baserga R. IGF-I receptor signalling in transformation and differentiation. Mol Pathol. 2001;54(3):133–7. doi: 10.1136/mp.54.3.133. Available from http://www.ncbi.nlm.nih.gov/entrez/query.fcgi?cmd=Retrieve&db=PubMed&dopt=Citation&list_uids=11376123. [DOI] [PMC free article] [PubMed]
- 30.Zhou R, Zettl A, Strobel P, Wagner K, Muller-Hermelink HK, Zhang S, et al. Thymic epithelial tumors can develop along two different pathogenetic pathways. Am J Pathol. 2001;159(5):1853–60. doi: 10.1016/s0002-9440(10)63031-3. Available from http://www.ncbi.nlm.nih.gov/entrez/query.fcgi?cmd=Retrieve&db=PubMed&dopt=Citation&list_uids=11696445. [DOI] [PMC free article] [PubMed]
- 31.Girard N, Mornex F, Van Houtte P, Cordier JF, van Schil P. Thymoma: a focus on current therapeutic management. J Thorac Oncol. 2009;4(1):119–26. doi: 10.1097/JTO.0b013e31818e105c. Available from http://www.ncbi.nlm.nih.gov/entrez/query.fcgi?cmd=Retrieve&db=PubMed&dopt=Citation&list_uids=19096319. [DOI] [PubMed]
- 32.Giaccone G, Rajan ARR, Smit EF, van Groeningen C, Hogedoorn PCW. Imatinib mesylate in patients with WHO B3 thymomas and thymic carcinomas. J Thor Oncol. 2009 doi: 10.1097/JTO.0b013e3181b6be57. in press. [DOI] [PMC free article] [PubMed] [Google Scholar]
- 33.Salter J, Lewis D, Yiannoutsos C, Loehrer PJ, Risley L, Chiorean EG. Imatinib for the treatment of thymic carcinoma. J Clin Oncol 2008, ASCO Annual Meeting Proceedings. 2008 May;26(20 suppl) [Google Scholar]
- 34.Kurup A, Burns M, Dropcho S, Pao S, Loehrer PJ. Phase II study of gefitinib treatment in advanced thymic malignancies. Journal of Clinical Oncology, 2005 ASCO Annual Meeting Proceedings. 2005;23(16S) [Google Scholar]
- 35.Farina G, Garassino MC, Gambacorta M, La Verde N, Gherardi G, Scanni A. Response of thymoma to cetuximab. Lancet Oncol. 2007;8(5):449–50. doi: 10.1016/S1470-2045(07)70141-9. Available from http://www.ncbi.nlm.nih.gov/entrez/query.fcgi?cmd=Retrieve&db=PubMed&dopt=Citation&list_uids=17466903. [DOI] [PubMed]
- 36.Pan CC, Chen PC, Chiang H. KIT (CD117) is frequently overexpressed in thymic carcinomas but is absent in thymomas. J Pathol. 2004;202(3):375–81. doi: 10.1002/path.1514. Available from http://www.ncbi.nlm.nih.gov/entrez/query.fcgi?cmd=Retrieve&db=PubMed&dopt=Citation&list_uids=14991904. [DOI] [PubMed]
- 37.Meister M, Schirmacher P, Dienemann H, Mechtersheimer G, Schnabel PA, Kern MA, et al. Mutational status of the epidermal growth factor receptor (EGFR) gene in thymomas and thymic carcinomas. Cancer Lett. 2007;248(2):186–91. doi: 10.1016/j.canlet.2006.07.003. Available from http://www.ncbi.nlm.nih.gov/entrez/query.fcgi?cmd=Retrieve&db=PubMed&dopt=Citation&list_uids=16919868. [DOI] [PubMed]
- 38.Suzuki E, Sasaki H, Kawano O, Endo K, Haneda H, Yukiue H, et al. Expression and mutation statuses of epidermal growth factor receptor in thymic epithelial tumors. Jpn J Clin Oncol. 2006;36(6):351–6. doi: 10.1093/jjco/hyl028. Available from http://www.ncbi.nlm.nih.gov/entrez/query.fcgi?cmd=Retrieve&db=PubMed&dopt=Citation&list_uids=16762968. [DOI] [PubMed]
- 39.LeRoith D, Roberts CT., Jr The insulin-like growth factor system and cancer. Cancer Lett. 2003;195(2):127–37. doi: 10.1016/s0304-3835(03)00159-9. Available from http://www.ncbi.nlm.nih.gov/entrez/query.fcgi?cmd=Retrieve&db=PubMed&dopt=Citation&list_uids=12767520. [DOI] [PubMed]
- 40.Chakravarti A, Loeffler JS, Dyson NJ. Insulin-like growth factor receptor I mediates resistance to anti-epidermal growth factor receptor therapy in primary human glioblastoma cells through continued activation of phosphoinositide 3-kinase signaling. Cancer Res. 2002;62(1):200–7. Available from http://www.ncbi.nlm.nih.gov/entrez/query.fcgi?cmd=Retrieve&db=PubMed&dopt=Citation&list_uids=11782378. [PubMed]