

Abstract
Visinin-like protein 1 (VILIP-1) belongs to the neuronal calcium sensor family of Ca2+-myristoyl switch proteins that regulate signal transduction in the brain and retina. Here we analyze Ca2+ and Mg2+ binding, characterize metal-induced conformational changes, and determine structural effects of myristoylation and dimerization. Mg2+ binds functionally to VILIP-1 at EF3 (ΔH = +1.8 kcal/mol and KD = 20 μm). Unmyristoylated VILIP-1 binds two Ca2+ sequentially at EF2 and EF3 (KEF3 = 0.1 μm and KEF2 = 1–4 μm), whereas myristoylated VILIP-1 binds two Ca2+ with lower affinity (KD = 1.2 μm) and positive cooperativity (Hill slope = 1.5). NMR assignments and structural analysis indicate that Ca2+-free VILIP-1 contains a sequestered myristoyl group like that of recoverin. NMR resonances of the attached myristate exhibit Ca2+-dependent chemical shifts and NOE patterns consistent with Ca2+-induced extrusion of the myristate. VILIP-1 forms a dimer in solution independent of Ca2+ and myristoylation. The dimerization site is composed of residues in EF4 and the loop region between EF3 and EF4, confirmed by mutagenesis. We present the structure of the VILIP-1 dimer and a Ca2+-myristoyl switch to provide structural insights into Ca2+-induced trafficking of nicotinic acetylcholine receptors.
Keywords: Calcium, Calcium-binding Proteins, Calorimetry, Membrane Trafficking, Nicotinic Acetylcholine Receptors, NMR, Protein Myristoylation, Protein Structure
Introduction
Visinin-like protein 1 (VILIP-1)2 is a neuronal Ca2+ sensor (NCS) protein belonging to the calmodulin superfamily of calcium sensor proteins (1–4). VILIP-1 is expressed throughout the brain with high expression levels in the rat hippocampus (5, 6), where it may play a role in regulating synaptic plasticity relevant for learning and memory (7, 8). VILIP-1 regulates several neuronal signaling pathways implicated in synaptic plasticity, such as cyclic nucleotide cascades (9–12) and nicotinergic signaling (13). Moreover, VILIP-1 binds to the α-subunit of the α4β2 nicotinic acetylcholine receptor (nAChR) and promotes surface expression and trafficking of α4β2 nAChR in oocytes (13) and hippocampal neurons (14). VILIP-1 has been implicated in the modulation of neuronal excitability by influencing α4β2 nAChR signaling in hippocampal neurons (14–16). VILIP-1 has also been implicated in the pathology of CNS diseases (17), including Alzheimer's disease (18, 19) and schizophrenia. Indeed, VILIP-1 expression shows cell-specific changes in the brains of schizophrenics and in animal models of the disease (16, 20, 21). Thus, VILIP-1 appears to be an important Ca2+ sensor for controlling neuronal excitability by modulating nicotinergic neurotransmission important for synaptic plasticity and disease processes (17, 22).
VILIP-1 belongs to the NCS family of Ca2+-myristoyl switch proteins (Fig. 1). The three-dimensional structures are known for NCS-1 (23), recoverin (24, 25), and neurocalcin (26). The common structural features of NCS proteins are an ∼200-residue chain containing four EF-hand motifs (EF1, EF2, EF3, and EF4), the sequence CPXG in the first EF-hand that eliminates its capacity to bind Ca2+ and an N-terminal myristoylation consensus sequence. The binding of Ca2+ to NCS proteins (e.g. NCS-1 (27), recoverin (28), and neurocalcin (29)) induces their binding to cellular membranes (29–31). The N-terminal myristoyl group has been shown to be sequestered structurally inside Ca2+-free recoverin (32, 33), whereas the binding of two Ca2+ to recoverin leads to the extrusion of the covalently attached myristoyl group (24). The Ca2+-induced exposure of the myristoyl group, termed Ca2+-myristoyl switch, enables recoverin and related NCS proteins to bind membranes only at high Ca2+.
FIGURE 1.

Amino acid sequence alignment of human VILIP-1 with other NCS proteins. Secondary structure elements (helices and strands), EF-hand motifs (EF1, green; EF2, pink; EF3, cyan; and EF4, yellow), and dimerization site residues (red letters) are mapped onto the amino acid sequence of recoverin. Residues that interact with the myristoyl group are indicated with bold type. The Swiss Protein Database accession numbers are P62760 (human VILIP-1), P37235 (human VILIP-3), P21457 (bovine recoverin), and P29554 (bovine neurocalcin).
In this study, we report on the structural analysis of Ca2+ and Mg2+ binding to VILIP-1 to characterize the structural mechanism of the Ca2+-myristoyl switch and determine its dimeric structure. We show that VILIP-1 binds functionally to Mg2+ at EF3 and binds cooperatively to Ca2+ at EF2 and EF3. VILIP-1 sequesters its N-terminal myristoyl group inside the apo-protein core and exhibits Ca2+-induced extrusion of the myristoyl group like that of recoverin. However, unlike recoverin, VILIP-1 forms a dimeric structure that is independent of Mg2+, Ca2+, or myristoylation. The dimerization site on VILIP-1 is comprised of nonconserved residues in EF4 and the loop region between EF3 and EF4. We propose a structural model of VILIP-1 dimer that uses a Ca2+-myristoyl switch mechanism to control binding and trafficking of α4β2 nicotinic acetylcholine receptors as a possible mechanism for modulating neuronal excitability involved in synaptic plasticity and neurodegenerative diseases.
EXPERIMENTAL PROCEDURES
Preparation and Purification of Recombinant VILIPs
Human VILIP-1 and VILIP-3 genes were subcloned in pET3d(+) plasmids. The chimeric VILIPs were prepared by overlapping PCRs (34). Site-specific VILIP-1 mutants for disabling Ca2+ binding (D73A(EF2Δ), D109A(EF3Δ), and D159A(EF4Δ)) or effecting dimerization (I136G/M137G, V151G, and A174G)) were generated by a QuikChange site-directed mutagenesis kit (Stratagene). Bacterial cells for expressing recombinant unmyristoylated VILIP proteins were generated by transforming BL21(DE3) cells with pET3d encoding the VILIP gene. Bacterial cells for expressing recombinant myristoylated VILIP proteins were generated by co-transforming BL21(DE3) cells with both pET3d-VILIP and pBB131 vector encoding yeast N-myristoyltransferase.
The expression and purification of recombinant VILIPs has been described previously (34). Briefly, bacterial cells harboring the VILIP-1 expression plasmid system above were grown in LB medium containing ampicillin (100 mg/liter) at 37 °C until the optical density (A600) of the cell culture reached 1.0. The cells were diluted 1:50 in LB or M9 medium and incubated with shaking (250 rpm) at 37 °C until A600 reached 0.8. Expression of recombinant unmyristoylated VILIP-1 protein was induced by adding isopropyl β-d-1-thiogalactopyranoside to the cell culture at a final concentration of 0.5 mm, and the cells were then grown at 25 °C for 12–16 h. Expression of recombinant myristoylated VILIPs followed a similar procedure except that kanamycin was added into the medium at a concentration of 50 mg/liter to select for expression of N-myristoyltransferase by pBB131-N-myristoyltransferase. Myristic acid (10 mg/liter) was added 1 h before the induction by isopropyl β-d-1-thiogalactopyranoside. For generating protein samples containing a 13C-labeled myristoyl group, 13C-labeled myristic acid (99% atom; Isotec) was used instead. The final bacterial cell pellet containing expressed VILIP protein was harvested by centrifugation. After centrifugation, the cell pellet was resuspended and sonicated in lysis buffer containing 20 mm Tris (pH 7.5), 0.3 m KCl, 1 mm EDTA, 1 mm DTT, 10% glycerol, and 0.1 m PMSF. The soluble proteins were recovered by ultracentrifugation. The supernatant was mixed with CaCl2 to give a final Ca2+ concentration of 4 mm and then applied to butyl-Sepharose column (HiPrep 16/10 Butyl FF; Amersham Biosciences) which was equilibrated with 20 mm Tris (pH 7.5), 0.3 m KCl, 2 mm CaCl2,1 mm DTT. The column was washed with 6–10 column volumes of equilibration buffer, and then the VILIP-1 protein was eluted using a low Ca2+ buffer (pH 7.5, 20 mm Tris, 2 mm EDTA, 1 mm DTT) as described previously (30). The protein fractions were applied onto HiTrap Q HP column (Amersham Biosciences) previously equilibrated in 20 mm Tris (pH 7.5), 1 mm EDTA, and 1 mm DTT buffer. VILIP-1 protein was eluted with a NaCl gradient (0–1 m NaCl over 20 column volumes). The final purified VILIP proteins were more than 95% pure as judged by SDS-PAGE and MALDI mass spectrometry. Final purified myristoylated VILIP-1 samples contained less than 5% of unmyristoylated protein as judged by reverse phase HPLC and mass spectrometry.
Isothermal Titration Calorimetry
A VP-ITC calorimeter (Micro-Cal) was used for all ITC measurements, and the data were acquired and processed with MicroCal software as described previously (35). VILIP-1 samples for ITC studies were first decalcified as described (36) and prepared in 20 mm Tris buffer (pH 7.5), 50 mm NaCl, and 1 mm Tris (2-carboxyethyl) phosphine hydrochloride. The protein concentration (30–50 μm) was determined by measuring optical density at 280 nm using a molar extinction coefficient of 22,142 m−1 cm−1. A series of 5-μl aliquots of 2 mm CaCl2 were injected into the protein sample in the presence or absence of 2 mm Mg2+, and corresponding heat signals were monitored calorimetrically. For the Mg2+ titration, 5-μl aliquots of 8 mm MgCl2 were titrated into the protein sample (200 μm). All of the titrations were performed at 30 °C.
Differential Scanning Calorimetry
A VP-DSC calorimeter from MicroCal was used for all DSC measurements, and the data were acquired and processed using MicroCal software as described previously (35). Scanning was done in the temperature range of 10–110 °C at a scan rate of 60 °C/h. A buffer base line was subtracted from each scan. Myristoylated and unmyristoylated VILIP-1 at concentrations of 50 μm were first decalcified as described (36) and prepared in 20 mm Tris buffer (pH 7.5) containing 100 mm NaCl and 1 mm β-mercaptoethanol with or without 5 mm CaCl2 or MgCl2. The samples were degassed before each scan.
NMR Spectroscopy
NMR experiments were performed on Bruker Avance III 600 or 800 MHz spectrometers equipped with a four-channel interface and triple-resonance TCI-cryoprobe probe with pulsed field gradients. Samples for NMR analyses were prepared by dissolving VILIP-1 in 0.3 ml of 90% H2O, 10% [2H]H2O containing 10 mm [2H11]Tris, pH 7.4, and 2 mm EDTA (apo-), 5 mm MgCl2 (Mg2+-bound), or 5 mm CaCl2 (Ca2+-bound). The 1H-15N HSQC spectra (see Fig. 4) were recorded on a sample of U-15N-labeled VILIP-1 (in 90% H2O, 10% D2O) at 30 °C. The number of complex points was 256 (15N, F1) × 1024(1H, F2). The two-dimensional 1H-13C HMQC and 13C(F1)-edited, 13C(F3)-filtered NOESY-HMQC experiments (see Fig. 5) were recorded at 30 °C on a sample with 99% 13C-labeled myristoyl group attached to 15N-labeled VILIP-1 protein. The complex points were 256(13C, F1) × 1024(1H, F2) and 256(1H, F2) × 1024(1H, F3), respectively. All triple-resonance experiments were performed and analyzed as described (37) on a sample of Mg2+-bound 13C/15N-labeled myristoylated VILIP-1 (in 95% H2O, 5% 2H2O) with the following number of complex points and acquisition times: HNCO (15N (F1) 32, 23.7 ms; 13CO (F2) 64, 42.7 ms; 1H (F3) 512, 64 ms); HNCACB (15N (F1) 32, 23.7 ms; 13C (F2) 48, 6.3 ms; 1H (F3) 512, 64 ms); CBCACONNH (15N (F1) 32, 23.7 ms; 13C (F2) 48, 6.3 ms; 1H (F3) 512, 64 ms); CBCACOCAHA (13C (F1) 52, 6.8 ms, 13CO (F2) 64, 42 ms, 1H (F3) 384, 64 ms); and HBHACONNH (15N (F1) 32, 23.7 ms, 1Hab (F2) 64 21 ms, 1H (F3) 512, 64 ms). All of the data sets were processed and analyzed by NMRPipe (38) and Sparky. Sequence-specific assignment of NMR backbone resonances (supplemental Fig. S1) was obtained as described in Ref. 37.
FIGURE 4.

NMR structural analysis of myristoylated (top panels) and unmyristoylated (bottom panels) VILIP-1. Two-dimensional (1H-15N HSQC) NMR spectra are shown for 15N-labeled VILIP-1 in the apo (A and D), Mg2+-bound (B and E), and Ca2+-bound (C and F) states. The spectra were recorded at 600 MHz at 30 °C.
FIGURE 5.

Two-dimensional HMQC and 13C(F1)-edited 13C(F3)-filtered HMQC NOESY spectra of unlabeled VILIP-1 containing a 13C-labeled myristoyl group. Two-dimensional 1H-13C HMQC NMR spectra of Ca2+-free VILIP-1 (A) and Ca2+-bound VILIP-1 (B) show Ca2+-dependent spectral changes that reflect environmental changes around the myristoyl group. Two-dimensional (13C/F1)-edited (13C/F3)-filtered HMQC NOESY spectra of Ca2+-free/Mg2+-bound myristoylated VILIP-1 (C) reveal that the attached myristoyl group is buried inside the hydrophobic core of the protein.
VILIP-1 Dimerization by Size Exclusion Chromatography
VILIP-1 dimerization was analyzed using Superdex 75 10/300 GL column (Amersham Biosciences) equilibrated with 20 mm Tris-HCl (pH 7.5) containing 150 mm NaCl, 0.5 mm Tris (2-carboxyethyl) phosphine hydrochloride with the addition of 2 mm EDTA, 5 mm Mg2+, or 5 mm CaCl2 for the apo-, Mg2+-bound, or Ca2+-bound states, respectively. Under each condition, 100 μl of protein (0.1 mm) was loaded onto the column and washed with the same buffer at a flow rate of 0.5 ml/min. Eluted protein concentration was monitored by optical density at 280 nm, and the molar mass was calculated on the basis of the elution volume. The elution volume was calibrated in terms of molar mass using the following protein standards: α-amylase (200 kDa), alcohol dehydrogenase (150 kDa), transferrin (81 kDa), carbonic anhydrase (29 kDa), myoglobin (17 kDa), and blue dextran (2000 kDa). The molar mass of VILIP-1 under these conditions was also verified using multi-angle light scattering analysis as described previously (39).
Homology Modeling and Docking Calculation
The three-dimensional structure of Ca2+ free VILIP-1 was generated by homology modeling using the SWISS-MODEL workspace (40) based on the NMR structure of Ca2+-free myristoylated recoverin (PDB no. 1IKU). The structure of Ca2+-bound VILIP-1 was similarly generated using the crystal structure of Ca2+-bound neurocalcin (PDB no. 1BJF). The structure of the VILIP-1 dimer was determined using the protein docking software, Haddock 2.0 (41, 42). First, we experimentally identified essential residues for dimerization using the chimera analysis described below. The solvent accessibility of these residues was evaluated using the software NACCESS (43). VILIP-1 residues 135–177 (derived from the chimera analysis) having >50% relative solvent accessibility were selected as ambiguous interaction restraints (41) that were then used in the Haddock docking calculation to identify the structure of the dimerization interface. A cluster of 133 dimer structures was calculated with a Haddock score of −142.5 ± 7.1 and a root mean square deviation of less than 1.5 Å relative to the lowest energy structure. The van der Waals energy was −42.2 ± 2.1 kcal/mol with a desolvation energy of 4.1 ± 1.9 kcal/mol and restraint violation energy of 288.4 ± 45.39 kcal/mol. A Ramachandran analysis of the ensemble of structures (evaluated by the software Procheck) revealed 83.5% of residues in the most favored regions, 15.2% in additional allowed regions, 0.6% in generously allowed regions, and only 0.6% in disallowed regions. Thus, the docking calculation of the VILIP-1 dimer appears to be well determined by the experimental restraints.
RESULTS
Mg2+ Binding to VILIP-1
ITC was used in this study to analyze the thermodynamics of Ca2+ and Mg2+ binding to the individual EF-hands of VILIP-1. The multiple EF-hand binding sites in VILIP-1 can be resolved by ITC based on differences in both KD and ΔH for the various sites. Hence, two or more sites with similar dissociation constants can be distinguished if their binding enthalpies are sufficiently different or vice versa. The ITC binding data also provides information about metal-induced protein conformational changes. Intrinsic divalent metal binding is usually entropically driven (ΔH > 0) because of high dehydration energies of divalent cations. If the overall enthalpy change is exothermic (ΔH < 0), then this suggests that the metal binding step is coupled to a favorable protein conformational change. Also, the temperature dependence of ΔH (ΔCp) provides structural information about a change in the solvent accessibility of hydrophobic residues (44).
The ITC experiments monitoring Mg2+ binding to VILIP-1 are shown in Fig. 2, and the fitting parameters are listed in Table 1. The Mg2+-binding isotherms in each case show two distinct endothermic binding phases that could be fit to a sequential model (Table 1). The fitting analysis reveals that myristoylated VILIP-1 binds one Mg2+ endothermically with micromolar affinity (KD = 20 μm and ΔH = +1.8 kcal/mol) followed by nonstoichiometric binding in the millimolar range (KD = 1–10 mm and ΔH = +1.6 kcal/mol). Unmyristoylated VILIP-1 binds Mg2+ with slightly lower affinity (KD = 30 μm and ΔH = +1.8 kcal/mol) but otherwise is very similar to the myristoylated protein. The endothermic Mg2+ binding for VILIP-1 is consistent with the high dehydration energy of aqueous Mg2+ and suggests that Mg2+ binding in this case does not induce a large protein conformational change. This is consistent with Mg2+ binding that stabilizes the EF-hand in a closed conformation (45, 46). High affinity Mg2+ binding in the micromolar range is typically found in EF-hand proteins whose Ca2+-free/Mg2+-bound state interacts with target proteins or DNA in the absence of Ca2+, such as GCAP1 (39), DREAM (47), CIB1 (48), and CaBP1 (45). Thus, the micromolar Mg2+ binding to VILIP-1 suggests that Ca2+-free/Mg2+-bound VILIP-1 may also interact with a physiological target.
FIGURE 2.

ITC analysis of Mg2+ binding to myristoylated VILIP-1. The top panel shows a trace of the calorimetric titration of 25 × 5-μl aliquots of 8 mm Mg2+ into the cell containing 300 μm myristoylated VILIP-1. The bottom panel shows Mg2+ binding to wild type VILIP-1 (black squares) and EF3Δ mutant (open diamonds). The data were fit to a two-site model, and the fitting parameters are listed in Table 1.
TABLE 1.
Thermodynamic parameters of Mg2+ binding to VILIP-1 and mutants at 30 °C
| KEF3 | Klow | ΔHEF3 | ΔHlow | |
|---|---|---|---|---|
| mm | mm | kcal/mol | kcal/mol | |
| Wild type | 0.02 ± 0.01 | 1–10 | +1.8 ± 0.2 | +1.6 ± 0.2 |
| EF2Δ | 0.03 ± 0.01 | 1–10 | +1.5 ± 0.2 | +1.2 ± 0.2 |
| EF3Δ* | ||||
| EF4Δ | 0.03 ± 0.01 | 1–10 | +1.8 ± 0.2 | +1.6 ± 0.2 |
*, no detectable Mg2+ binding to EF3Δ.
To identify which particular EF-hands in VILIP-1 bind to Mg2+, we constructed three single-site mutants that disable divalent cation binding to the individual EF-hands: D73A(EF2Δ), D109A(EF3Δ), and D159A(EF4Δ). The first EF-hand in all NCS proteins is known to be nonfunctional and was not mutated in this study. For each EF-hand mutant, a negatively charged Asp at the beginning of the EF-hand loop has been substituted with a neutral Ala residue. This substitution dramatically lowers the Ca2+ and/or Mg2+ binding affinity of the respective EF-hand outside of the physiological range (49). As illustrated in Fig. 2 and Table 1, the EF3Δ mutant completely abolishes Mg2+ binding to VILIP-1. The EF2Δ and EF4Δ mutants both retain Mg2+ binding with micromolar affinity and similar enthalpy as wild type (Table 1). Thus, VILIP-1 exhibits micromolar Mg2+ binding solely at EF3.
To verify that EF3 is the sole Mg2+-binding site in the micromolar range, we recorded NMR spectra of myristoylated VILIP-1 and the three EF-hand mutants at 30 °C (supplemental Figs. S2 and S3). Mg2+ binding to VILIP-1 generates a characteristic amide proton NMR resonance at 10.53 ppm assigned to the conserved glycine at the 6-position of the Mg2+-bound EF-hand. This downfield chemical shift is due in part to formation of a strong hydrogen bond between the glycine main chain amide proton and the carboxylate side chain of Asp at the 1-position of the metal-bound EF-hand loop. The downfield-shifted amide proton resonance at 10.53 ppm (and hence Mg2+ binding to VILIP-1) disappeared only for the EF3Δ mutant and remained intact for EF2Δ and EF4Δ mutants, which further confirms that VILIP-1 binds functionally to Mg2+ only at EF3. However, careful inspection of the HSQC spectrum of the EF3Δ mutant revealed a marked decrease in the entire amide chemical shift dispersion, suggesting that this mutant may be misfolded; however, the melting temperature for unfolding is only moderately affected by the mutation. Thus, a partial misfolding of the EF3Δ mutant (instead of the D109A point mutation itself) might also explain its lack of Mg2+ binding. Nevertheless, the downfield-shifted resonance at 10.53 ppm (and hence high affinity Mg2+ binding) observed for both the EF2Δ and EF4Δ mutants confirms by process of elimination that EF3 must be the high affinity Mg2+ site.
Ca2+ Binding to VILIP-1
Calcium binding to both myristoylated and unmyristoylated forms of VILIP-1 was monitored by ITC (Fig. 3), and optimal Ca2+ binding parameters are listed in Table 2. All of the ITC Ca2+ binding measurements were performed both in the presence and absence of physiological Mg2+ levels (2 mm Mg2+) at 30 °C. The presence of physiological Mg2+ reduced the apparent Ca2+ affinity by ∼2-fold, consistent with Mg2+ binding to VILIP-1 as described above and in Ref. 27. Myristoylation of VILIP-1 dramatically affects the Ca2+-binding isotherms for VILIP-1, similar to the large effect of myristoylation on the Ca2+ binding data for recoverin (28) and in contrast to that of GCAP-1 (39). For unmyristoylated VILIP-1 (in the absence of Mg2+; Fig. 3A), the ITC Ca2+-binding isotherm exhibits two separate binding phases that could be fit by two independent sites. The highest affinity site is exothermic (ΔH1 = −9 kcal/mol and K1 = 100 nm) followed by lower affinity endothermic binding (ΔH2 = +3.3 kcal/mol) in the micromolar range (K2 = 1–4 μm). Similar independent and uncooperative Ca2+-binding sites were observed previously for unmyristoylated forms of recoverin (28, 36), chicken VILIP (27), and neurocalcin δ (29).
FIGURE 3.

ITC analysis of Ca2+ binding to VILIP-1. Ca2+-binding isotherms for unmyristoylated (A) and myristoylated (B) VILIP-1 and EF-hand mutants are shown in A and B, respectively. Binding data for wild type, D73A(EF2Δ), D109A(EF3Δ), and D159A(EF4Δ) are overlaid and shown in black, green, blue, and red, respectively. The fitting parameters are listed in Table 2.
TABLE 2.
Thermodynamic parameters of Ca2+ binding to VILIP-1 and mutants at 30 °C
Unmyristoylated VILIP-1 data were fit to an independent sites model. Myristoylated VILIP-1 data were fit to the Hill model.
| Unmyristoylated | KEF2 | KEF3 | ΔHEF2 | ΔHEF3 |
|---|---|---|---|---|
| μm | μm | kcal/mol | kcal/mol | |
| Wild type | 1–4 | 0.1 ± 0.05 | +3.3 ± 0.1 | −9.0 ± 1 |
| EF2Δ | 0.1 ± 0.05 | +5.9 ± 0.1 | ||
| EF3Δ | 100 ± 10 | −1.7 ± 0.1 | ||
| EF4Δ | 1–4 | 0.1 ± 0.05 | +2.4 ± 0.1 | −9.0 ± 1 |
| Myristoylated | α | KD | ΔH | |
|---|---|---|---|---|
| μm | kcal/mol | |||
| Wild type | 1.5 | 1.2 ± 0.3 | −3.5 ± 0.1 | |
| EF2Δ | 1 | 3.9 ± 0.1 | −4.5 ± 0.1 | |
| EF3Δ | ||||
| EF4Δ | 1.5 | 1.2 ± 0.1 | −6.3 ± 0.1 |
The ITC Ca2+-binding isotherm for myristoylated VILIP-1 (Fig. 3B), in contrast to unmyristoylated VILIP-1, exhibits exothermic binding of two Ca2+ with a steep Ca2+ dependence (KD = 1.2 μm, ΔH = −3.5 kcal/mol). The fractional saturation (Y) calculated from the Ca2+ binding data for the myristoylated protein can be fit by the Hill equation,
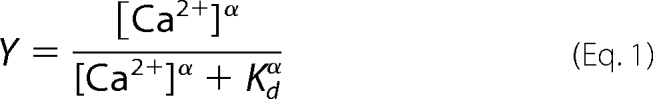 |
with a Hill coefficient (α) of 1.5 and an apparent dissociation constant (KD) of 1.2 μm. A Hill coefficient of 1.5 indicates that two or more Ca2+ bind to VILIP-1 with positive cooperativity, which resembles the cooperative binding of 2 Ca2+ to myristoylated recoverin (28). The Ca2+ binding data for VILIP-1 indicate that N-terminal myristoylation both lowers the apparent affinity (KD = 1.2 μm) and induces positive cooperativity (α = 1.5) like that observed for recoverin (28) and neurocalcin (29), which is an important hallmark of a Ca2+-myristoyl switch.
The high resolution ITC data for both myristoylated and unmyristoylated VILIP-1 clearly indicated two separate binding sites having distinct values of ΔH and KD; however, it is difficult with the wild type data alone to assign each of the binding phases as binding by a particular EF-hand. To identify which EF-hands bind to Ca2+, we performed ITC Ca2+ titration on each of the EF-hand mutants (D73A(EF2Δ), D109A(EF3Δ), and D159A(EF4Δ)) (Fig. 3). For unmyristoylated VILIP-1 (Fig. 3A), the EF3Δ mutant lacks the high affinity Ca2+ binding seen in the wild type isotherm and instead exhibits very low affinity binding of one Ca2+ with a KD of ∼100 μm, suggesting that EF3 may be the high affinity site. However, the NMR spectrum of the EF3Δ mutant suggests that this mutant protein may be partially misfolded, which might disable high affinity Ca2+ binding and also explain the very low apparent affinity. The EF2Δ mutant, in contrast to EF3Δ, is properly folded (based on its NMR spectrum) and exhibits high affinity binding of one Ca2+, whereas the lower affinity Ca2+ binding phase in the wild type isotherm appears to be missing in this mutant, suggesting that EF2 must be the lower affinity site. The EF4Δ mutation had almost no affect on the Ca2+-binding isotherm, indicating that VILIP-1 does not bind Ca2+ at EF4 in the physiological range. By process of elimination, EF3 must be the high affinity site, because EF2 is the low affinity site, and EF1 and EF4 do not bind Ca2+.
For myristoylated VILIP-1 (Fig. 3B), the EF3Δ mutant markedly impairs binding of both Ca2+ ions, whereas the EF2Δ mutant abolishes Ca2+ binding only at EF2 and retains high affinity binding of one Ca2+ (KD = 3.9 μm, ΔH = −4.5 kcal/mol). The lack of any Ca2+ binding to myristoylated EF3Δ might again be the result of protein misfolding in this mutant as suggested by its NMR spectrum (supplemental Fig. S2). Alternatively, the lack of Ca2+ binding to the EF3Δ mutant resembles the lack of binding seen previously for the EF3Δ mutant of recoverin that adopts a stable fold (50). The EF3Δ mutation in recoverin prevents Ca2+ binding at EF2 because Ca2+ binding at the two sites has been shown to be both ordered and cooperative (36). We suggest that a similar situation applies to myristoylated VILIP-1 in which Ca2+ must bind to EF3 first to facilitate cooperative Ca2+ binding at EF2 just like the ordered and cooperative binding observed previously for myristoylated recoverin.
We do not see any evidence of Ca2+ binding at EF1. The primary structure of EF1 contains unfavorable substitutions (e.g. Cys-38 and Pro-39 in Fig. 1) that would be expected to abolish physiological Ca2+ binding at this site as has been demonstrated in other NCS proteins (23, 25, 26, 51). Accordingly, our ITC Ca2+ binding measurements on VILIP-1 do not detect any heat signal from Ca2+ binding at EF1, suggesting that either EF1 does not bind Ca2+ under physiological conditions or the enthalpy of binding is zero.
A concerted allosteric model was described previously for recoverin (28) that can be adapted for VILIP-1 to quantitatively account for both the uncooperative Ca2+ binding by unmyristoylated VILIP-1 and the cooperative Ca2+ binding by myristoylated VILIP-1. This dramatic effect of myristoylation on Ca2+ binding to VILIP-1 is an important characteristic of a Ca2+-myristoyl switch. In the concerted model (supplemental Fig. S4), the VILIP-1 protein has two intrinsically different binding sites for Ca2+ and two global protein conformational states, T and R. The T state represents the protein conformation with a sequestered myristoyl group (see below) (32), and R represents the protein with an extruded myristoyl group (24). KEF2 and KEF3 determined above for unmyristoylated VILIP-1 represent the dissociation constants of the two sites in the R state as justified previously (28). We assume that the protein conformational change R → T reduces the Ca2+ binding dissociation constants of both sites by the same factor, c. L is the equilibrium ratio [T]/[R] in the absence of Ca2+. The fractional saturation (Y) is then given by,
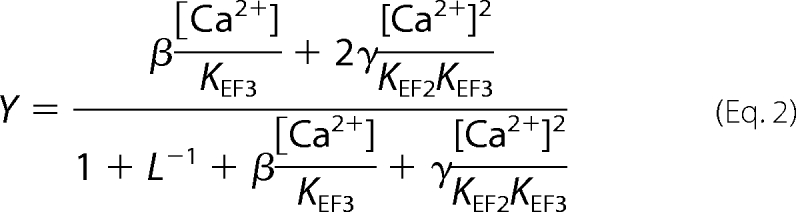 |
where β = c + L−1 and γ = c2 + L−1. Using KEF3 = 100 nm and KEF2 = 2 μm, L is calculated from the Ca2+ binding data to be ∼100 for myristoylated VILIP-1 and L < 0.1 for unmyristoylated VILIP-1. The parameter c is estimated to be less than 0.01. Therefore, both the cooperative and uncooperative Ca2+ binding can be modeled by varying L while keeping all other parameters fixed. Positive cooperativity is produced when the T state is thermodynamically favored over R (L = 100 for myristoylated VILIP-1), and Ca2+ binds more tightly to R than to T (c = 0.01). The removal of the myristoyl group causes the apo-protein to convert into the R state (L < 0.1), and Ca2+ binding to unmyristoylated VILIP-1 follows a sequential model described by R0 → R1 → R2. Thus, the myristoyl group attached to VILIP-1 changes the [T]/[R] equilibrium by a factor of at least 1000 (100/0.1) and thus serves as a potent allosteric effector. The allosterism controlled by the myristoyl group explains why unmyristoylated VILIP-1 exhibits uncooperative sequential binding (L < 0.1) and why myristoylated VILIP-1 exhibits much steeper cooperative binding (L = 100) that is needed to control the Ca2+-myristoyl switch.
Folding Stability versus Ca2+, Mg2+, and Myristoylation
DSC experiments were performed on VILIP-1 to quantitatively assess the effect of Ca2+, Mg2+, and myristoylation on protein folding stability. Representative DSC scans of VILIP-1 are shown in supplemental Fig. S5. The unfolding temperature of unmyristoylated metal-free (apo) VILIP-1 (transition temperature, Tm = 51 °C) is much lower than the unfolding temperatures of Mg2+-bound (Tm = 74 °C) and Ca2+-bound (Tm > 110 °C) VILIP-1, indicating that both Mg2+ and particularly Ca2+ increase the folding stability. N-terminal myristoylation of VILIP-1 also increases the folding stability of Ca2+-free VILIP-1. The unfolding temperature of myristoylated apo-VILIP-1 (Tm = 56 °C) is greater than that of unmyristoylated apo-VILIP-1 (Tm = 51 °C), consistent with a stabilization caused by sequestration of the covalently attached myristoyl group inside Ca2+-free VILIP-1. For Ca2+-saturated myristoylated VILIP-1, the protein started to aggregate at ∼40 °C, and the precise unfolding temperature could not be reliably ascertained. The Ca2+-induced aggregation of myristoylated VILIP-1 was verified by dynamic light scattering analysis (data not shown) and is perhaps caused by the Ca2+-induced extrusion of the covalently attached myristoyl group like that observed for recoverin (24, 33). The transition peaks in all of the DSC thermograms did not fully reappear upon rescanning each of the samples, suggesting irreversible unfolding caused by aggregation and/or denaturation. However, the pretransitional base line and Tm in each case were independent of protein concentration and scan rate, consistent with a two-state model of unfolding. Unfortunately, the DSC thermograms of apo, Mg2+-bound, and Ca2+-bound VILIP-1 were all quite broad with steeply sloped post-transitional base lines, making it difficult to quantitatively fit these thermograms by a two-state model. The steep and highly curved base line is most likely due to protein aggregation that may have occurred during unfolding at the very high melting temperatures.
NMR Structural Analysis of VILIP-1
NMR spectroscopy was used to probe atomic level protein conformational changes in VILIP-1 induced by Mg2+ and/or Ca2+ binding (Fig. 4). The peaks in the 1H-15N HSQC NMR spectra represent main chain and side chain amide groups and provide a fingerprint of the overall protein conformation. The spectrum of Ca2+-free myristoylated VILIP-1 (Fig. 4A) is somewhat similar to that of Mg2+-bound myristoylated protein (Fig. 4B), indicating that Mg2+ binding does not change the overall main chain conformation, consistent with a Mg2+-bound closed conformation as seen in other EF-hand proteins (45). However, Mg2+ binding causes a sharpening of peaks assigned to residues in EF3, particularly the downfield-shifted resonance at 10.53 ppm assigned to Gly-114, consistent with Mg2+ binding at EF3. The spectrum of Mg2+-bound/Ca2+-free VILIP-1 exhibits the expected number of well resolved resonances with uniform intensities, indicating a stably folded conformation for Mg2+-bound myristoylated VILIP-1. Dynamic light scattering experiments demonstrate that Mg2+-bound myristoylated VILIP-1 does NOT aggregate under NMR conditions. NMR assignments for Mg2+-bound/Ca2+-free myristoylated VILIP-1 are given in supplemental Fig. S1. These NMR assignments indicate that the chemical shifts and NOE patterns for conserved residues in VILIP-1 (Leu-16, Thr-20, Trp-30, Tyr-31, Phe-34, Leu-36, Cys-39, Ser-40, Gly-41, Tyr-52, Phe-55, Phe-56, Asp-60, Ala-88, Leu-89, Thr-92, Ser-93, Trp-103, Ala-104, Tyr-108, Gly-112, Gly-114, Ile-116, Ile-124, Ile-128, Thr-147, Thr-167, Glu-170, and Phe-171) are all very similar to those of Ca2+-free myristoylated recoverin. Thus, the structures of recoverin and VILIP-1 in the Ca2+-free state must be very similar, which validates the homology modeled structure of Ca2+-free myristoylated VILIP-1 discussed below.
The addition of saturating Ca2+ to myristoylated VILIP-1 causes the HSQC spectrum to change quite significantly (Fig. 4C). A much smaller number of backbone amide peaks were observed in the Ca2+-bound spectrum, because many resonances are broadened beyond detection because of Ca2+-induced aggregation of the Ca2+-bound myristoylated protein that occurs at protein concentrations above 100 μm (but NOT at the lower protein concentration used in the ITC experiments). The aggregation of Ca2+-bound myristoylated VILIP-1 (under NMR conditions) is most likely caused by a Ca2+-induced extrusion of the covalently attached myristoyl group (see below) like that seen previously for recoverin (24, 33).
Two-dimensional 1H-15N HSQC spectra of Ca2+-free and Mg2+-bound forms of unmyristoylated VILIP-1 (Fig. 4, D and E) look very different from those of myristoylated VILIP-1 (Fig. 4, A and B). The large spectral differences between myristoylated and unmyristoylated VILIP-1 are consistent with a sequestration of the myristoyl group attached to Ca2+-free VILIP-1 demonstrated below and like that observed previously for Ca2+-free recoverin (32, 33). The NMR spectra of Ca2+-free/Mg2+-bound unmyristoylated VILIP-1 exhibited poorly resolved and overlapping peaks with narrow chemical shift dispersion in the amide proton dimension (Fig. 4, D and E). The number of observed peaks was less than the expected number of amide groups, and the intensities of many peaks were quite weak, perhaps because of exchange broadening caused by conformational heterogeneity. The poor chemical shift dispersion and spectral heterogeneity suggest that Ca2+-free unmyristoylated VILIP-1 adopts an unstructured molten-globule state like that observed for unmyristoylated, apo-forms of Frq1 (52), GCAP1 (39), DREAM (47), and CIB1 (53).
The HSQC spectrum of unmyristoylated VILIP-1 changed quite dramatically upon the addition of saturating Ca2+ (Fig. 4F). The addition of Ca2+ caused a greater number of peaks to appear that were in general sharper than those of Ca2+-free VILIP-1, which demonstrated that Ca2+-bound unmyristoylated VILIP-1 adopts a much more stable tertiary structure compared with the apo state. The appearance of two downfield-shifted amide proton resonances at 10.48 and 10.72 ppm assigned to Gly-78 and Gly-114, respectively, confirm that two Ca2+ are bound to VILIP-1 at EF2 and EF3. The high degree of chemical shift dispersion initially suggested that it may be feasible to perform a high resolution NMR structural analysis on Ca2+-bound unmyristoylated VILIP-1. However, upon closer inspection, detailed NMR assignments for Ca2+-bound VILIP-1 could not be obtained because of a significant amount of spectral heterogeneity perhaps caused by a mixture of protein species described below.
Ca2+-induced Extrusion of the Myristoyl Group
To probe the chemical environment of the N-terminal myristoyl group (Fig. 5B, Suppl. Fig. 5b, and Table 2), we performed two-dimensional 1H-13C HMQC and 13C-filtered NOESY-HMQC on a VILIP-1 sample that contained a 13C-labeled myristoyl group and unlabeled protein. In Fig. 5, the 13C-1H HMQC experiment selectively probes protons that are covalently attached to 13C so that only the methylene and methyl resonances of the myristoyl group appear in the spectra. The HMQC spectrum of the 13C-labeled myristoyl group attached to Ca2+-free/Mg2+-bound VILIP-1 exhibits sharp and well resolved peaks for all the resonances along the fatty acyl chain. The resonances at positions 2, 3, 12, 13, and 14 form resolved cross-peaks in both dimensions and can be assigned on the basis of their unique 13C chemical shifts. The methylene resonances at positions C4-C11 have very similar 13C chemical shifts and therefore cannot be assigned unambiguously. Nevertheless, the methylene resonances at positions C4-C11 have unique 1H chemical shifts, and the large 1H chemical shift dispersion of these resonances is consistent with the attached myristoyl group being buried inside the hydrophobic core environment of Ca2+-free VILIP-1 like that observed for the myristoyl group inside Ca2+-free recoverin (33). The addition of saturating Ca2+ to myristoylated VILIP-1 leads to significant changes in the 1H-13C HMQC spectrum of the labeled myristoyl group (Fig. 5B and Table 3), indicating a Ca2+-induced environmental change of the covalently attached fatty acyl group. The methylene resonances at positions C4-C11 all collapse into a single peak, suggesting that the covalently attached myristate may be located in a more dynamic and isotropic chemical environment in the Ca2+-bound protein. The chemical shifts of the methylene resonances from the myristoyl group attached to Ca2+-bound VILIP-1 are quite similar to those of free myristic acid in solution (data not shown), suggesting that the covalently attached fatty acyl chain may be solvent-exposed. The line widths of the myristoyl group resonances increased quite significantly upon Ca2+ addition, consistent with aggregation of the Ca2+-bound protein caused by Ca2+ induced exposure of the myristoyl group like that seen previously for recoverin (24, 33).
TABLE 3.
1H and 13C (in parentheses) chemical shift assignments of myristoyl resonances in ppm
The NMR sample conditions were 0.2 mm VILIP-1 in 10 mm Tris at pH 7.4 containing either 5 mm Mg2+ or 5 mm Ca2+.
| Position | Mg2+-VILIP-1 | Ca2+-VILIP-1 |
|---|---|---|
| C2 | 2.2 (38.5) | 2.1 (38.2) |
| C3 | 1.25 (27.8) | 1.4 (28.1) |
| C4–C11 | 0.2–0.92 (30–32) | 1.0–1.1 (31–32) |
| C12 | 0.98 (34.0) | 1.2 (34.0) |
| C13 | 1.0 (25.0) | 1.25 (24.2) |
| C14 | 0.42 (16.5) | 0.78 (16.8) |
To further test whether VILIP-1 has a sequestered myristoyl group in the Ca2+-free state, two-dimensional (13C/F1)-edited and (13C/F2)-filtered NOESY experiments were performed on Ca2+-free/Mg2+-bound VILIP-1 (unlabeled) containing a 13C-labeled myristate. This NOESY spectrum exhibits nuclear Overhauser effect cross-peaks between the fatty acyl group and many protein resonances particularly from aromatic residues (Fig. 5C). The NMR chemical shifts and NOE patterns in Fig. 5C are similar to those of Ca2+-free recoverin (32). In VILIP-1, the strongest NOESY cross-peaks involve the C14 methyl resonance of the myristoyl group that forms hydrophobic contacts with protein aromatic resonances (Phe-49, Tyr-52, Phe-55, and Phe-85) and other hydrophobic residues inside the hydrophobic core of the protein. The large intensity of these NOESY cross-peaks indicates that the C14 methyl group of the myristate chain must be located less than 5 angstroms away from hydrophobic side chain atoms inside the protein hydrophobic core. These protein-myristate contacts imply that the covalently attached fatty acyl group must be sequestered inside the Ca2+-free VILIP-1 protein similar to the sequestered myristoyl group inside Ca2+-free recoverin (32, 33).
VILIP-1 Dimerization
Previous studies have shown that VILIP-1 forms an equilibrium mixture of monomeric and dimeric protein species (34). In our current study, we use size exclusion chromatography (SEC), NMR spectroscopy, and chimera analysis to characterize the dimeric structure and understand the effect of Mg2+, Ca2+, and myristoylation (Fig. 6). The Ca2+-bound myristoylated VILIP-1 is not very soluble and forms large protein aggregates in solution (at protein concentrations above 80 μm), presumably because of Ca2+-induced exposure of the myristoyl group. The large oligomeric state of Ca2+-saturated myristoylated VILIP-1 therefore could not be accurately analyzed in our SEC studies. By contrast, Ca2+-free/Mg2+-bound myristoylated VILIP-1 protein does not aggregate in solution, and its SEC chromatogram shows two clearly resolved elution bands that represent separate monomer and dimer protein species (Fig. 6). The relative intensities of the SEC elution bands suggest a 2:1 equilibrium ratio of VILIP-1 monomer to dimer at 1 μm total protein concentration. The dissociation constant for the VILIP-1 dimerization was estimated based on SEC data to be 1–10 μm. The amount of dimerization was not affected by adding excess reducing agent (i.e. 10 mm dithiothreitol or Tris (2-carboxyethyl) phosphine hydrochloride). Thus, the VILIP-1 dimer is not caused by cysteine oxidation, in contrast to suggestions in Ref. 34. Nearly identical dimerization properties were observed for unmyristoylated VILIP-1 (not shown). The dimerization of unmyristoylated VILIP-1 is independent of both Ca2+ and Mg2+. Thus, the dimerization of VILIP-1 in this study does NOT involve cysteine oxidation and is independent of Mg2+, Ca2+, and myristoylation (not counting the artificial aggregation of Ca2+-saturated myristoylated VILIP-1). Under the same conditions, our SEC studies show that recoverin and VILIP-3 are both monomeric regardless of Mg2+, Ca2+, or myristoylation.
FIGURE 6.

SEC of VILIP-1, chimeras, and mutants. SEC elution profiles of myristoylated (red) and unmyristoylated (black) Ca2+-free VILIP-1 contain two resolved bands at 10.5 and 12 ml, representing dimer and monomer species, respectively. Elution profiles of VILIP-1 double mutant (I136G/M137G), VILIP-3, and V13C chimera contain only one band at ∼12 ml, indicating that these species are monomeric.
Dimerization of VILIP-1 was shown previously to be disrupted by swapping its entire C-terminal domain with that of VILIP-3, implying that the dimerization site in VILIP-1 must be localized in the C-terminal half of VILIP-1 (34). To more precisely localize the dimerization interface of VILIP-1, we made three distinct chimeric constructs between VILIP-1 and VILIP-3: V13A (VILIP-1 residues 1–177 and VILIP-3 residues 178–193), V13B (VILIP-1 residues 1–148 and VILIP-3 residues 149–193), and V13C (VILIP-1 residues 1–132 and VILIP-3 residues 133–193). The SEC analysis on each of the chimeras is shown in Fig. 6. The SEC analysis on V13C indicates that this protein is 100% monomeric, demonstrating that VILIP-1 residues in the loop region between EF3 and EF4 and residues in EF4 are essential for protein dimerization. The SEC analysis on V13B indicates that the amount of protein dimerization was decreased by ∼2-fold, consistent with VILIP-1 residues in EF4 being important for dimerization. The chimera V13A shows the same amount of dimerization as that of wild type, indicating that C-terminal residues (178–191) after EF4 in VILIP-1 are not important for dimerization. Thus, the SEC results demonstrate that residues in EF1, EF2, and EF3 (residues 1–132) are NOT necessary for VILIP-1 dimerization and that the nonconserved residues in the loop region between EF3 and EF4 and exposed residues in EF4 represent the minimal number of residues in VILIP-1 that are necessary and sufficient for dimerization. Indeed, mutants of the nonconserved residues in these regions (I136G/M137G, V151G, and A174G) all weaken the dimerization affinity but remain structurally intact as judged by NMR. The most striking effect is seen by the double mutant I136G/M137G that lowers the dimerization affinity by ∼10-fold (purple line in Fig. 6).
Structural Model of VILIP-1 Dimer
The structure of VILIP-1 dimer was generated by homology modeling and protein docking calculations. The first step was to determine the three-dimensional structures of monomeric forms of Ca2+-free and Ca2+-bound VILIP-1 using homology modeling (see “Experimental Procedures”). Human VILIP-1 shares 54% sequence identity with bovine recoverin and 58% identity with bovine neurocalcin, implying that the main chain structure of VILIP-1 should be very similar to those of recoverin and neurocalin. Indeed, the NMR backbone assignments of Mg2+-bound/Ca2+-free VILIP-1 (supplemental Fig. S1) indicate that the chemical shifts and NOE patterns for conserved residues in VILIP-1 (Leu-16, Thr-20, Trp-30, Tyr-31, Phe-34, Leu-36, Cys-39, Ser-40, Gly-41, Tyr-52, Phe-55, Phe-56, Asp-60, Ala-88, Leu-89, Thr-92, Ser-93, Trp-103, Ala-104, Tyr-108, Gly-112, Gly-114, Ile-116, Ile-124, Ile-128, Thr-147, Thr-167, Glu-170, and Phe-171) are all very similar to those of Ca2+-free myristoylated recoverin. In addition, the NMR chemical shifts and NOE patterns of the myristoyl group interaction with VILIP-1 (Fig. 5) and NOE patterns of distinct Leu and Val methyl resonances in the VILIP-1 hydrophobic core are quite similar to those observed for Ca2+-free recoverin (24, 32). Therefore, the structure of Ca2+-free VILIP-1 must be very similar to that of recoverin and was modeled on the basis of the NMR structure of Ca2+-free myristoylated recoverin (1IKU). The homology modeled structure of Ca2+-free VILIP-1 (Fig. 7A) shows the N-terminal myristoyl group sequestered inside the protein hydrophobic core, consistent with the NMR spectra of the myristoyl group (Fig. 5). VILIP-1 residues Leu-27, Trp-30, Phe-48, Leu-51, Tyr-52, Phe-55, Phe-82, Phe-85, Leu-89, Trp-103, and Met-107 make important hydrophobic contacts with the N-terminal myristoyl group as verified by the NMR assignments and spectrum in Fig. 5C.
FIGURE 7.

Three-dimensional structures of VILIP-1 generated by homology modeling (see “Experimental Procedures”). Ribbon diagrams show the main chain structures of Ca2+-free (A) and Ca2+-bound (B) VILIP-1 with the N-terminal myristoyl group highlighted in magenta. Secondary structure elements (helices and strands) and EF-hand motifs are drawn in the same colors as in Fig. 1 (EF1, green; EF2, pink; EF3, cyan; and EF4, yellow). The structure of Ca2+-bound VILIP-1 (B) shows that the entire N-domain (EF1 and EF2) is rotated ∼45° with respect to the C-domain (EF3 and EF4) that facilitates exposure of the N-terminal myristoyl group.
The structure of Ca2+-bound VILIP-1 (Fig. 7B) was modeled on the basis of the crystal structure of Ca2+-bound neurocalcin (1BJF), which is the closest available structure of a Ca2+-bound NCS protein dimer that has highest sequence identity to VILIP-1. Ca2+-bound neurocalcin forms a dimer in solution (54), and the crystal structure of the Ca2+-bound dimer (26) specifies intermolecular contacts primarily between residues in the N-terminal domain (EF1 and EF2) and exposed residues in EF3. Our chimera analysis above on VILIP-1 precludes any intermolecular dimer contacts involving residues in EF1, EF2, and EF3 (i.e. between the two domains), and therefore the dimeric structure of VILIP-1 must be different from that of neurocalcin.
To generate a structure of the VILIP-1 dimer consistent with the chimera data above, we used a protein docking approach (see “Experimental Procedures”) applied to the structure of Ca2+-bound VILIP-1 in Fig. 7B. The docking calculation (see “Experimental Procedures”) was performed using constraints from the chimera analysis above. The docking results reveal a cluster of 133 lowest energy dimeric structures that are all consistent with the chimera data, and the lowest energy structure is shown in Fig. 8. The VILIP-1 dimer adopts an elongated structure (48 × 22 × 18 Å) in which the two monomeric subunits are attached to one another at their exposed C-terminal ends. At the dimer interface, the exposed helices of EF4 are packed against each other in a face-to-face fashion, forming an interfacial structure that resembles a four-helix bundle. The exposed residues on the EF4 entering helix (Val-151, Ile-154, and Phe-155) make close contacts with exposed residues on the EF4 exiting helix in the opposite chain (Phe-171, Ala-174, and Ala-175) and vice versa. The loop regions between EF3 and EF4 contact each other at the dimer interface, forming multiple hydrophobic contacts involving Ile-136, Met-137, Met-138, and Met-140. Thus, the dimer interface is mostly hydrophobic, formed by contacts from nonconserved and exposed residues Ile-136, Met-137, Met-138, Met-140, Val-151, Ile-154, Phe-155, Phe-171, Ala-174, and Ala-175 (in red in Figs. 1 and 8A). The importance of these residues for dimerization is demonstrated by mutants (I136G/M137G, V151G, and A174G) that all weaken the dimerization affinity (Fig. 6). The VILIP-1 dimer structure has the N-terminal myristoyl group from each polypeptide chain pointing upward in the same direction to serve as a dual-pronged anchor for targeting VILIP-1 to membranes (Fig. 9). The opposite surface of the VILIP-1 dimer (highlighted yellow in Fig. 8B) contains an exposed hydrophobic crevice from each monomeric subunit (lined by residues Phe-22, Trp-30, Leu-43, Phe-48, Ile-51, Tyr-52, Phe-55, Phe-56, Phe-72, Phe-82, Phe-85, Ile-86, Ala-88, and Leu-89) that we suggest may interact with hydrophobic segments of target proteins.
FIGURE 8.

Docking calculation of the three-dimensional structure of the Ca2+-bound VILIP-1 dimer. A shows a ribbon diagram of the dimer conformation with EF1, EF2, EF3, and EF4 colored the same as in Fig. 7. The exposed residues at the dimer interface are in red. B shows a space-filling representation with exposed hydrophobic residues highlighted in yellow.
FIGURE 9.

Schematic mechanism of Ca2+-induced trafficking of nicotinic acetylcholine receptor α4 subunit mediated by VILIP-1. Ca2+-free VILIP-1 contains a sequestered myristoyl group (red) that covers a hydrophobic crevice (yellow) and prevents α4 binding. Neuronal stimulation leads to a rise in intracellular Ca2+ level that in turn causes Ca2+-induced extrusion of the VILIP-1 myristoyl group, causing exposure of the hydrophobic crevice. The Ca2+-bound VILIP-1 dimer then binds and transports α4 from the Golgi to the plasma membrane via a Ca2+-myristoyl switch.
DISCUSSION
In this study, we determined the energetics of Mg2+ and Ca2+ binding to VILIP-1 as well as structural effects of myristoylation and protein dimerization. Mg2+ binds functionally to VILIP-1 at EF3 (KD = 20 μm), and the relatively high Mg2+ binding affinity suggests that Ca2+-free/Mg2+-bound VILIP-1 may interact with a physiological target protein like that observed for Ca2+-free/Mg2+-bound forms of GCAP1 (55), DREAM (47), CaBP1 (45), and CIB1 (48). Ca2+ binds enthalpically and cooperatively to myristoylated VILIP-1 at EF2 and EF3 in the micromolar range (ΔH = +2 kcal/mol and KD = 1.2 μm). Myristoylation both lowers the apparent Ca2+ binding affinity and induces cooperativity like that observed previously for recoverin (28). Thus, myristoylation has a profound effect on both the Ca2+ binding properties and structure of VILIP-1, consistent with VILIP-1 possessing a Ca2+-myristoyl switch. The covalently attached myristoyl group is sequestered inside the hydrophobic core of Ca2+-free VILIP-1 (Figs. 5C and 7A). The binding of two Ca2+ at EF2 and EF3 causes large protein conformational changes that lead to extrusion of the N-terminal myristoyl group (Figs. 5B and 7B), like that observed for recoverin (24, 33). However, unlike recoverin, VILIP-1 forms a stable protein dimer that is independent of Ca2+, Mg2+, or myristoylation. The dimerization site is composed of nonconserved residues between EF3 and EF4 and exposed residues in EF4. Indeed, mutation of the nonconserved residues between EF3 and EF4 (I136G/M137G) dramatically weakens the dimerization affinity (Fig. 6). The structure of the VILIP-1 dimer reveals that the N-terminal myristoyl group, attached at opposite ends of the dimer, provides a double-pronged anchor for insertion into membranes (Fig. 8A). The exposed cytosolic surface of the membrane-bound VILIP-1 dimer contains two separate hydrophobic patches (Fig. 8B) that may interact with target proteins.
Implications of VILIP-1 Dimerization and the Ca2+-myristoyl Switch
VILIP-1 has been shown previously to facilitate the Ca2+-induced trafficking of the α4-subunit of nAChR (14). The Ca2+-dependent conformational changes and dimeric structure of VILIP-1 determined in this study suggest a molecular mechanism for Ca2+-induced trafficking of nAChRs (Fig. 9). We propose that the exposed hydrophobic crevice on the surface of Ca2+-bound VILIP-1 dimer (highlighted yellow in Fig. 8B) may serve as a target binding site like that observed previously in the structures of recoverin bound to rhodopsin kinase (56) and yeast frequenin bound to phosphatidylinositol 4-kinase (57). In the neuronal resting state, the cytosolic Ca2+ level is maintained well below the Ca2+ dissociation constant for VILIP-1 (Table 2), and the Ca2+-free VILIP-1 dimer is cytosolic with a sequestered myristoyl group that covers the hydrophobic patch and thus may prevent the binding of Ca2+-free VILIP-1 to α4β2 nAChR α4-subunit (α4). Neuronal stimulation, e.g. via nicotine (15) or membrane depolarization (31), leads to an increase in the cytosolic Ca2+ level and Ca2+-dependent translocation of VILIP-1 to the cell surface membrane. A rise in cytosolic Ca2+ level causes Ca2+-induced extrusion of the myristoyl group attached to the VILIP-1 dimer (Fig. 8A) with concomitant exposure of two separate hydrophobic crevices (highlighted yellow in Fig. 8B). The Ca2+-bound VILIP-1 dimer is then poised to interact with two molecules of the nAChR α4-subunit (α4) that initially reside in the ER and upon appropriate stimulation traffic via Golgi vesicles to the cell surface (14). We propose that the translocation of α4 from the ER via Golgi to the plasma membrane is enhanced by VILIP-1 via the Ca2+-myristoyl switch mechanism. It is conceivable that the binding of VILIP-1 to two α4 subunits in the nascent receptor complex favors the assembly and/or trafficking of the high affinity α4β2 nAChR, containing two rather than three α4-subunits (58), to the plasma membrane. This process leads to VILIP-1-dependent accumulation of high affinity α4β2 nAChR at the cell membrane surface (14). In short, this mechanism might explain how VILIP-1 dimerization and a Ca2+-myristoyl switch mechanism are combined structurally to promote VILIP-1-dependent trafficking of nAChRs (13, 14). As a functional result, the nAChR channel activity becomes up-regulated by VILIP-1 that ultimately leads to increased neuronal excitability, implicated in synaptic plasticity and neuronal diseases (16, 17). To more rigorously test this mechanism in the future, we plan to determine the structure of the VILIP-1 dimer bound to functional fragments of α4β2 nAChR using NMR and/or x-ray crystallography.
Supplementary Material
Acknowledgments
We are grateful to Dr. Jerry Dallas for help with NMR experiments, Dr. Frits Abildgaard for providing NMR pulse sequence programs, and Frank Delaglio for writing computer software for NMR data processing and analysis.
This work was supported, in whole or in part, by National Institutes of Health Grants EY012347 and NS059969 (to J. B. A.).

The on-line version of this article (available at http://www.jbc.org) contains supplemental Figs. S1–S6.
- VILIP-1
- visinin-like protein 1
- DSC
- differential scanning calorimetry
- HSQC
- heteronuclear single quantum coherence
- ITC
- isothermal titration calorimetry
- SEC
- size exclusion chromatography
- NCS
- neuronal Ca2+ sensor
- nAChR
- nicotinic acetylcholine receptor
- HMQC
- heteronuclear multiple quantum coherence.
REFERENCES
- 1. Braunewell K. H., Gundelfinger E. D. (1999) Cell Tissue Res. 295, 1–12 [DOI] [PubMed] [Google Scholar]
- 2. Burgoyne R. D., Weiss J. L. (2001) Biochem. J. 353, 1–12 [PMC free article] [PubMed] [Google Scholar]
- 3. Burgoyne R. D. (2007) Nat. Rev. Neurosci. 8, 182–193 [DOI] [PMC free article] [PubMed] [Google Scholar]
- 4. Burgoyne R. D., O'Callaghan D. W., Hasdemir B., Haynes L. P., Tepikin A. V. (2004) Trends Neurosci. 27, 203–209 [DOI] [PubMed] [Google Scholar]
- 5. Paterlini M., Revilla V., Grant A. L., Wisden W. (2000) Neuroscience 99, 205–216 [DOI] [PubMed] [Google Scholar]
- 6. Zhao C., Braunewell K. H. (2008) Neuroscience 153, 1202–1212 [DOI] [PubMed] [Google Scholar]
- 7. Braunewell K. H., Brackmann M., Manahan-Vaughan D. (2003) Neuropharmacology 44, 707–715 [DOI] [PubMed] [Google Scholar]
- 8. Brackmann M., Zhao C., Kuhl D., Manahan-Vaughan D., Braunewell K. H. (2004) Biochem. Biophys. Res. Commun. 322, 1073–1079 [DOI] [PubMed] [Google Scholar]
- 9. Braunewell K. H., Gundelfinger E. D. (1997) Neurosci. Lett. 234, 139–142 [DOI] [PubMed] [Google Scholar]
- 10. Braunewell K. H., Brackmann M., Schaupp M., Spilker C., Anand R., Gundelfinger E. D. (2001) J. Neurochem. 78, 1277–1286 [DOI] [PubMed] [Google Scholar]
- 11. Brackmann M., Schuchmann S., Anand R., Braunewell K. H. (2005) J. Cell Sci. 118, 2495–2505 [DOI] [PubMed] [Google Scholar]
- 12. Braunewell K. H., Spilker C., Behnisch T., Gundelfinger E. D. (1997) J. Neurochem. 68, 2129–2139 [DOI] [PubMed] [Google Scholar]
- 13. Lin L., Jeanclos E. M., Treuil M., Braunewell K. H., Gundelfinger E. D., Anand R. (2002) J. Biol. Chem. 277, 41872–41878 [DOI] [PubMed] [Google Scholar]
- 14. Zhao C. J., Noack C., Brackmann M., Gloveli T., Maelicke A., Heinemann U., Anand R., Braunewell K. H. (2009) Mol. Cell Neurosci. 40, 280–292 [DOI] [PMC free article] [PubMed] [Google Scholar]
- 15. Zhao C., Anand R., Braunewell K. H. (2009) Cell Mol. Neurobiol. 29, 273–286 [DOI] [PMC free article] [PubMed] [Google Scholar]
- 16. Gierke P., Zhao C., Bernstein H. G., Noack C., Anand R., Heinemann U., Braunewell K. H. (2008) Neurobiol. Dis. 32, 162–175 [DOI] [PubMed] [Google Scholar]
- 17. Braunewell K. H. (2005) Trends Pharmacol. Sci. 26, 345–351 [DOI] [PubMed] [Google Scholar]
- 18. Braunewell K., Riederer P., Spilker C., Gundelfinger E. D., Bogerts B., Bernstein H. G. (2001) Dement. Geriatr. Cogn. Disord. 12, 110–116 [DOI] [PubMed] [Google Scholar]
- 19. Schnurra I., Bernstein H. G., Riederer P., Braunewell K. H. (2001) Neurobiol. Dis. 8, 900–909 [DOI] [PubMed] [Google Scholar]
- 20. Bernstein H. G., Becker A., Keilhoff G., Spilker C., Gorczyca W. A., Braunewell K. H., Grecksch G. (2003) Neurosci. Lett. 339, 95–98 [DOI] [PubMed] [Google Scholar]
- 21. Bernstein H. G., Braunewell K. H., Spilker C., Danos P., Baumann B., Diekmann S., Gundelfinger E. D., Bogerts B. (2002) Neuroreport 23, 393–396 [DOI] [PubMed] [Google Scholar]
- 22. Braunewell K. H., Klein-Szanto A. J., Szanto A. J. (2009) Cell Tissue Res. 335, 301–316 [DOI] [PMC free article] [PubMed] [Google Scholar]
- 23. Bourne Y., Dannenberg J., Pollmann V., Marchot P., Pongs O. (2001) J. Biol. Chem. 276, 11949–11955 [DOI] [PubMed] [Google Scholar]
- 24. Ames J. B., Ishima R., Tanaka T., Gordon J. I., Stryer L., Ikura M. (1997) Nature 389, 198–202 [DOI] [PubMed] [Google Scholar]
- 25. Flaherty K. M., Zozulya S., Stryer L., McKay D. B. (1993) Cell 75, 709–716 [DOI] [PubMed] [Google Scholar]
- 26. Vijay-Kumar S., Kumar V. D. (1999) Nat. Struct. Biol. 6, 80–88 [DOI] [PubMed] [Google Scholar]
- 27. Cox J. A., Durussel I., Comte M., Nef S., Nef P., Lenz S. E., Gundelfinger E. D. (1994) J. Biol. Chem. 269, 32807–32813 [PubMed] [Google Scholar]
- 28. Ames J. B., Porumb T., Tanaka T., Ikura M., Stryer L. (1995) J. Biol. Chem. 270, 4526–4533 [DOI] [PubMed] [Google Scholar]
- 29. Ladant D. (1995) J. Biol. Chem. 270, 3179–3185 [PubMed] [Google Scholar]
- 30. Zozulya S., Stryer L. (1992) Proc. Natl. Acad. Sci. U.S.A. 89, 11569–11573 [DOI] [PMC free article] [PubMed] [Google Scholar]
- 31. Spilker C., Dresbach T., Braunewell K. H. (2002) J. Neurosci. 22, 7331–7339 [DOI] [PMC free article] [PubMed] [Google Scholar]
- 32. Tanaka T., Ames J. B., Harvey T. S., Stryer L., Ikura M. (1995) Nature 376, 444–447 [DOI] [PubMed] [Google Scholar]
- 33. Ames J. B., Tanaka T., Ikura M., Stryer L. (1995) J. Biol. Chem. 270, 30909–30913 [DOI] [PubMed] [Google Scholar]
- 34. Chen K. C., Wang L. K., Chang L. S. (2009) J. Pept. Sci. 15, 89–94 [DOI] [PubMed] [Google Scholar]
- 35. Wingard J. N., Chan J., Bosanac I., Haeseleer F., Palczewski K., Ikura M., Ames J. B. (2005) J. Biol. Chem. 280, 37461–37470 [DOI] [PMC free article] [PubMed] [Google Scholar]
- 36. Ames J. B., Hamasaki N., Molchanova T. (2002) Biochemistry 41, 5776–5787 [DOI] [PubMed] [Google Scholar]
- 37. Clore G. M., Gronenborn A. M. (1997) Nat. Struct. Biol. 4, 849–853 [PubMed] [Google Scholar]
- 38. Delaglio F., Grzesiek S., Vuister G. W., Zhu G., Pfeifer J., Bax A. (1995) J. Biomol. NMR 6, 277–293 [DOI] [PubMed] [Google Scholar]
- 39. Lim S., Peshenko I., Dizhoor A., Ames J. B. (2009) Biochemistry 48, 850–862 [DOI] [PMC free article] [PubMed] [Google Scholar]
- 40. Bordoli L., Kiefer F., Arnold K., Benkert P., Battey J., Schwede T. (2009) Nat. Protoc. 4, 1–13 [DOI] [PubMed] [Google Scholar]
- 41. Dominguez C., Boelens R., Bonvin A. M. (2003) J. Am. Chem. Soc. 125, 1731–1737 [DOI] [PubMed] [Google Scholar]
- 42. de Vries S. J., van Dijk A. D., Krzeminski M., van Dijk M., Thureau A., Hsu V., Wassenaar T., Bonvin A. M. (2007) Proteins 69, 726–733 [DOI] [PubMed] [Google Scholar]
- 43. Hubbard S. J., Beynon R. J., Thornton J. M. (1998) Protein Eng. 11, 349–359 [DOI] [PubMed] [Google Scholar]
- 44. Gómez J., Hilser V. J., Xie D., Freire E. (1995) Proteins 22, 404–412 [DOI] [PubMed] [Google Scholar]
- 45. Li C., Chan J., Haeseleer F., Mikoshiba K., Palczewski K., Ikura M., Ames J. B. (2009) J. Biol. Chem. 284, 2472–2481 [DOI] [PMC free article] [PubMed] [Google Scholar]
- 46. Huang H., Ishida H., Vogel H. J. (2010) Protein Sci. 19, 475–485 [DOI] [PMC free article] [PubMed] [Google Scholar]
- 47. Osawa M., Dace A., Tong K. I., Valiveti A., Ikura M., Ames J. B. (2005) J. Biol. Chem. 280, 18008–18014 [DOI] [PubMed] [Google Scholar]
- 48. Yamniuk A. P., Vogel H. J. (2005) Protein Sci. 14, 1429–1437 [DOI] [PMC free article] [PubMed] [Google Scholar]
- 49. Lin L., Braunewell K. H., Gundelfinger E. D., Anand R. (2002) Biochem. Biophys. Res. Commun. 296, 827–832 [DOI] [PubMed] [Google Scholar]
- 50. Alekseev A. M., Shulga-Morskoy S. V., Zinchenko D. V., Shulga-Morskaya S. A., Suchkov D. V., Vaganova S. A., Senin I. I., Zargarov A. A., Lipkin V. M., Akhtar M., Philippov P. P. (1998) FEBS Lett. 440, 116–118 [DOI] [PubMed] [Google Scholar]
- 51. Zhou W., Qian Y., Kunjilwar K., Pfaffinger P. J., Choe S. (2004) Neuron 41, 573–586 [DOI] [PubMed] [Google Scholar]
- 52. Ames J. B., Hendricks K. B., Strahl T., Huttner I. G., Hamasaki N., Thorner J. (2000) Biochemistry 39, 12149–12161 [DOI] [PubMed] [Google Scholar]
- 53. Yamniuk A. P., Nguyen L. T., Hoang T. T., Vogel H. J. (2004) Biochemistry 43, 2558–2568 [DOI] [PubMed] [Google Scholar]
- 54. Olshevskaya E. V., Ermilov A. N., Dizhoor A. M. (1999) J. Biol. Chem. 274, 25583–25587 [DOI] [PubMed] [Google Scholar]
- 55. Dizhoor A. M., Olshevskaya E. V., Peshenko I. V. (2010) Mol. Cell Biochem. 334, 117–124 [DOI] [PMC free article] [PubMed] [Google Scholar]
- 56. Ames J. B., Levay K., Wingard J. N., Lusin J. D., Slepak V. Z. (2006) J. Biol. Chem. 281, 37237–37245 [DOI] [PubMed] [Google Scholar]
- 57. Strahl T., Huttner I. G., Lusin J. D., Osawa M., King D., Thorner J., Ames J. B. (2007) J. Biol. Chem. 282, 30949–30959 [DOI] [PubMed] [Google Scholar]
- 58. Hogg R. C., Raggenbass M., Bertrand D. (2003) Rev. Physiol. Biochem. Pharmacol. 147, 1–46 [DOI] [PubMed] [Google Scholar]
Associated Data
This section collects any data citations, data availability statements, or supplementary materials included in this article.