Abstract
The MelB permease of Salmonella typhimurium (MelB-ST) catalyzes the coupled symport of melibiose and Na+, Li+, or H+. In right-side-out membrane vesicles, melibiose efflux is inhibited by an inwardly directed gradient of Na+ or Li+ and stimulated by equimolar concentrations of internal and external Na+ or Li+. Melibiose exchange is faster than efflux in the presence of H+ or Na+ and stimulated by an inwardly directed Na+ gradient. Thus, sugar is released from MelB-ST externally prior to the release of cation in agreement with current models proposed for MelB of Escherichia coli (MelB-EC) and LacY. Although Li+ stimulates efflux, and an outwardly directed Li+ gradient increases exchange, it is striking that internal and external Li+ with no gradient inhibits exchange. Furthermore, Trp → dansyl FRET measurements with a fluorescent sugar (2′-(N-dansyl)aminoalkyl-1-thio-β-d-galactopyranoside) demonstrate that MelB-ST, in the presence of Na+ or Li+, exhibits appKd values of ∼1 mm for melibiose. Na+ and Li+ compete for a common binding pocket with activation constants for FRET of ∼1 mm, whereas Rb+ or Cs+ exhibits little or no effect. Taken together, the findings indicate that MelB-ST utilizes H+ in addition to Na+ and Li+. FRET studies also show symmetrical emission maximum at ∼500 nm with MelB-ST in the presence of 2′-(N-dansyl)aminoalkyl-1-thio-β-d-galactopyranoside and Na+, Li+, or H+, which implies a relatively homogeneous distribution of conformers of MelB-ST ternary complexes in the membrane.
Keywords: Membrane Biogenesis, Membrane Proteins, Protein Conformation, Sodium Transport, Sugar Transport, Efflux/Exchange, Ligand Binding, Structure and Function
Introduction
In eukaryotic cells, the primary cation responsible for the electrochemical gradient across membranes is Na+, to which most symporters are coupled. In certain Na+ symporters, H+ and Li+ can substitute for Na+; examples are the human Na+/nucleoside cotransporter (CNT3) (1) and the human Na+/glucose cotransporter (SGLT) (2). In bacterial membranes, the electrochemical gradient is built by H+, and H+/solute cotransporters are most common. Bacterial melibiose permease (MelB)2 exhibits a unique property that couples sugar transport with Na+, Li+, or H+ and selects the cation depending on the transported sugar structure (3). The multiple coupling feature of this group of transporters yields a useful tool to study the mechanism of cation/sugar symport.
Bacterial MelB belongs to the glycoside/pentoside/hexuronide:cation family (4), a subgroup of the major facilitator superfamilies of membrane transport proteins, where the lactose permease (LacY) is the best characterized member (5, 6). MelB of Escherichia coli (MelB-EC) is the best characterized member among all MelB orthologues (7–16). MelB-EC catalyzes the coupled stoichiometric symport of a galactoside with a cation (Na+, Li+, or H+) utilizing the free energy from the downhill translocation of one cosubstrate to catalyze the translocation of the other (3, 17–20), and all three cations compete for a common binding pocket (21–23).
The primary sequence alignment between MelB-EC and LacY is relatively poor with ∼37% sequence similarity and ∼15% identity; however, membrane topology studies of MelB (24–26) suggested a topology similar to LacY, with 12 transmembrane helices and cytoplasmically located N and C termini. A three-dimensional structure model of MelB was recently built by threading analysis (27), using a crystal structure (PDB ID 1PV6) of LacY (28, 29) as the template. The model suggested a similar overall fold between these two permeases; i.e. MelB is organized in two-helix bundles connected with a central loop and separated by an internal cavity facing the cytoplasmic side. From bioinformatics data, this overall fold seems conserved among MelB orthologues (27). Moreover, this model is consistent with numerous previous biochemical/biophysical data (14, 30–37), as well as low-resolution EM structures obtained from MelB-EC (38, 39).
Diverse cation selectivity was identified in MelB orthologues (40). Although it shares high sequence identity with MelB-EC, MelB of Klebsiella pneumoniae couples melibiose transport only to H+ and Li+, but not to Na+ (32, 41). MelB of Salmonella typhimurium (MelB-ST) was also reported to catalyze coupled galactoside transport to Na+ or Li+, but not to H+ (42). In this study, MelB-ST was cloned and hetero-expressed in E. coli. Our results indicate that MelB-ST shares similar cosubstrate specificities with MelB-EC, albeit with relatively lower affinities. Moreover, MelB-EC seems to yield a wide range of conformers in the presence of cosubstrate, whereas the conformation distribution of MelB-ST ternary complexes is relatively homogeneous.
EXPERIMENTAL PROCEDURES
Materials
[3H]Melibiose was custom-synthesized by PerkinElmer Life Sciences. 2′-(N-Dansyl)aminoalkyl-1-thio-β-d-galactopyranoside (D2G) was kindly provided by Drs. H. Ronald Kaback and Gérard Leblanc. 2-(4′-Maleimidylanilino)-naphthalene-6-sulfonic acid (MIANS) was purchased from Invitrogen. Oligodeoxynucleotides were synthesized by Integrated DNA Technologies. Restriction endonucleases, T4 DNA ligase, and Vent DNA polymerase were from either Takara Bio USA or New England Biolabs (Beverly, MA). All other materials were reagent grade and obtained from commercial sources.
Bacterial Strains
S. typhimurium LT2 strain (43), obtained from Dr. Tomofuse Tsuchiya (Okayama University, Japan), was used for cloning the MelB-ST. E. coli DW2 strain (melA+, ΔmelB, ΔlacZY), obtained from Gérard Leblanc, was used for the expression and functional characterization. E. coli XL1 Blue and DH 5α strains were applied for DNA cloning and plasmid amplification.
Cloning of MelB from S. typhimurium
Chromosomal DNA from S. typhimurium LT2 was used for the PCR template. The forward primer corresponds to a sequence encoding a fragment of Lys77–Ala86, which contains a unique restriction site, NcoI, and the reverse primer complements 3′-terminus of melB gene excluding its stop codon. The PCR product was used as template for further PCR amplification to create variations in the C terminus of MelB. A DNA fragment encoding a His10 tag followed by a stop codon and a unique restriction site SacI was generated by PCR reaction. An expression plasmid pK95 ΔAH/wild-type MelB His6 tag, a gift from Gerard Leblanc, was treated with NcoI and SacI and ligated with these DNA fragments digested by the same restriction enzymes. The final construct, pK95 ΔAH/L5M MelB-ST/CHis10 that encodes the full-length MelB-ST with Met in the position of Leu5, was verified by restriction digestion profile and DNA sequencing. A Val residue in the position of Gly109 was identified among several individual clones, which differs from the DNA sequence database; however, Val109 is conserved in other MelB orthologues.
Growth of Cells and Protein Expression
E. coli DW2 strain containing a given plasmid was grown in Luria-Bertani (LB) broth supplemented with 100 mg/liter ampicillin at 37 °C. The overnight cultures were diluted 20-fold in the same broth supplemented with 0.5% glycerol, shaking for 5 h at 30 °C. Cells were harvested and washed with 100 mm potassium Pi, pH 7.5, by centrifugation.
Preparation of Right-side-out (RSO) Membrane Vesicles
RSO membrane vesicles were prepared from E. coli DW2 strain without or with a given plasmid by osmotic lysis as described (44, 45), extensively washed with Na+-free buffer, resuspended in 100 mm potassium Pi (pH 7.5) at a protein concentration of about 20–30 mg/ml, frozen in liquid N2, and stored at −80 °C until use.
Transport Assays in Intact Cells
E. coli DW2 cells expressing MelB in 15 ml of LB broth supplemented with 0.5% glycerol were diluted and washed with 50 ml of 100 mm potassium Pi, pH 7.5, for four times to decrease Na+ contamination to a calculated concentration <0.05 μm. The cell pellets were resuspended with 100 mm potassium Pi, pH 7.5, 10 mm MgSO4, adjusted to an A420 of 10.0 (0.7 mg protein/ml), and aliquoted with 50 μl. Transport was initiated by adding 2 μl of [3H]melibiose with a specific activity of 10 mCi/mmol at a final concentration of 0.4 mm in the absence or presence of either 20 mm NaCl or 20 mm LiCl and stopped at a given incubation time by diluting 60-fold with quenching buffer (100 mm potassium Pi, pH 5.5, 100 mm KCl, and 10 mm MgSO4), fast filtrating using one GF75 glass fiber filter (Advantec, Japan), and washing with the same quenching buffer (46). The filters were added with 3 ml of Bio-Safe II (Research Products International Corp.), and the intracellular [3H]melibioses were detected by a scintillation counter (Beckman LS6500).
Active Transport Assays in Membrane Vesicles
For the transport assay using RSO vesicles, 20 mm ascorbate (Na+-free) and 0.2 mm phenazine methosulfate were added to 2 mg/ml RSO vesicles in 100 mm potassium Pi, pH 7.5, 10 mm MgSO4 to generate the electrochemical H+ gradient (Δμ̃H+) (46, 47). After blowing RSO vesicles under oxygen for 20 s, transport was initiated by adding [3H]melibiose (final concentration of 0.4 mm, 10 mCi/mmol) in the absence and presence of 20 mm NaCl or LiCl. At a given incubation time at 23 °C, transports were stopped, and the intracellular [3H]melibioses were detected as described above.
Melibiose Efflux and Exchange
RSO membrane vesicles containing MelB-ST in 100 mm potassium Pi, pH 7.5, 10 mm MgSO4 were concentrated to ∼30 mg/ml and pre-equilibrated overnight on ice with 20 mm [3H]melibiose (10 mCi/mmol), 0.75 μm monensin, and 10 μm carbonylcyanide m-chlorophenylhydrazone (20), without or with 20 mm NaCl or LiCl. Aliquots (2 μl) were diluted 200-fold into a given buffer in the absence (efflux) or presence (exchange) of 20 mm unlabeled melibiose (48), and reactions were terminated by dilution and rapid filtration at a given time.
Trp → Dansyl FRET
Fluorescence was measured with either Hitachi F-7000 or SLM-8100/DMX fluorescence spectrophotometers. Steady-state measurements were performed in a 3-mm quartz cuvette with RSO membrane vesicles containing a given MelB at a protein concentration of 0.5 mg/ml in 100 mm potassium Pi, pH 7.5, 10 mm MgSO4. Trp was excited at 290 nm and recorded between 300 and 570 nm at 1-nm intervals with slit widths of 2.5 mm for both excitation and emission. Trp → dansyl FRET was assayed by mixing RSO vesicles with fluorescent sugar D2G and displaced by the addition of excess melibiose, as described previously (10). Cation bindings in the presence of D2G were measured by adding NaCl or LiCl prior to the displacement of D2G FRET by melibiose.
Apparent Binding Affinity (appKd) for D2G
The appKd values for D2G in RSO vesicles containing MelB were determined by titration of D2G in the FRET measurement in the absence or presence of a saturated concentration of NaCl or LiCl. Integrations of displacement (diffFRET) by excess melibiose or β-d-galactopyranosyl 1-thio-β-d-galactopyranoside, a higher affinity ligand, were plotted as a function of D2G, and hyperbolic function was used to fit to data.
EC50 for Melibiose Displacement and appKd for Melibiose
RSO vesicles containing MelB in the absence or presence of 20 mm NaCl or LiCl were excited at 290 nm, and FRET signals of D2G, which was added at a concentration close to the appKd value, were traced at 500 nm. At a 30-s interval, melibiose was added stepwise until no change in FRET signal was approached. The percentage of displacement as total bound D2G was plotted as a function of melibiose concentration. EC50 was determined by the hyperbolic fitting to data, and the appKd value for melibiose was calculated by the equation: appKd = EC50/{1 + [D2G]/Kd for D2G}.
Cation Activation Constants (K0.5) for D2G FRET
RSO vesicles containing MelB in the absence of Na+ and Li+ were excited at 290 nm, and FRET emissions of D2G at 10 μm were traced at 500 nm. At a 30-s interval, NaCl or LiCl was added stepwise until no change was reached. The increase of fluorescence intensity was plotted as a function of cation concentration, and K0.5 was determined by fitting with the hyperbola equation.
RESULTS
[3H]Melibiose Transport
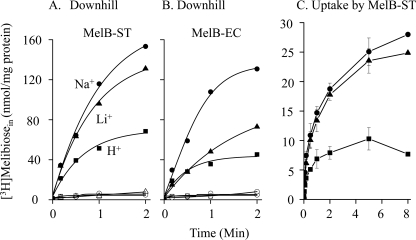
E. coli DW2 (lacY−Z−melA+B−) contains α-galactosidase that hydrolyzes the incoming α-anomer melibiose to galactose and glucose. As a result, the external melibiose concentration remains higher than the inside during melibiose transport (37). In DW2 intact cells, the heterologously expressed MelB-ST catalyzes melibiose downhill transport in a nominally Na+- and Li+-free condition (i.e. in the presence of H+) and the presence of Na+ or Li+ simulated melibiose transport by 2–3-fold (Fig. 1A). Similar results were obtained with MelB-EC (Fig. 1B), indicating that melibiose transport in both permeases is coupled to H+, Na+, or Li+, with a preference of Na+ > Li+ > H+. Melibiose uptake was performed with RSO vesicles, prepared from DW2 cells expressing MelB-ST, in the presence of Δμ̃H+ imposed across the membrane by adding ascorbate and phenazine methosulfate and blowing under O2 steam (46, 47). The H+-coupled melibiose uptake against the concentration gradient was saturable, and both Na+ and Li+ stimulated the uptake by 2–3-fold (Fig. 1C). The addition of Na+ or Li+ by preincubating with RSO vesicles for 20 s prior to the initiation of transport, or by mixing with [3H]melibiose, exhibits comparable results; however, no uptake can be detected in the absence of Δμ̃H+ (data not shown).
FIGURE 1.
[3H]Melibiose transport. A and B, downhill transport in DW2 intact cells with overexpressed MelB-ST (A) or MelB-EC (B). Calculated intracellular [3H]melibiose concentrations were plotted as a function of time. C, uptake with RSO vesicles containing MelB-ST. Square, circle, and triangle represent data that were obtained in the presence of H+, Na+, and Li+, respectively. Na+ or Li+ (20 mm) was added by premixing with [3H]melibiose. Error bars indicate S.E.
Effect of Membrane Potentials (ΔΨ) on [3H]Melibiose Transport
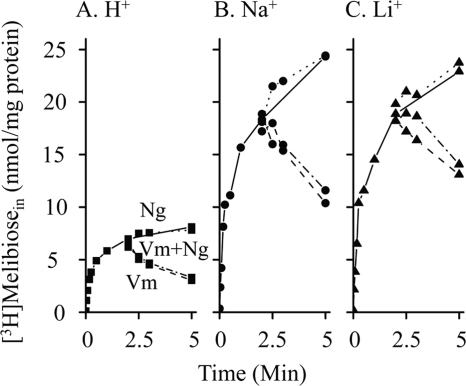
RSO vesicles containing MelB-ST (pH, 7.5) were treated with ionophores valinomycin (a K+-specific transporter), nigericin (a H+/K+ antiporter), or both during the transport time course. In the presence of either cation among H+, Na+, and Li+, inhibition of melibiose uptake was observed upon the addition of valinomycin alone or valinomycin with nigericin, whereas no detectable effect was observed by adding nigericin only (Fig. 2). Thus, in the absence and presence of Na+ or Li+, the major driving force for melibiose uptake at pH 7.5 is ΔΨ. These results are consistent with the well established notion that Na+ or Li+ gradient in RSO vesicles is maintained by ΔΨ through the Na+/H+ antiporter (NhaA) (40, 42, 49, 50).
FIGURE 2.
Effect of ΔΨ on [3H]melibiose uptake. Active transport with RSO vesicles (pH 7.5) containing MelB-ST was carried out in the absence and presence of 20 mm Na+ (circle) or Li+ (triangle). At the 2-min time point of transport time course, 50 μm valinomycin (Vm, dashed lines), 1 μm nigericin (Ng, dotted lines), or both (dashed and dotted lines) were added into RSO vesicles.
H+-coupled Melibiose Efflux and Exchange
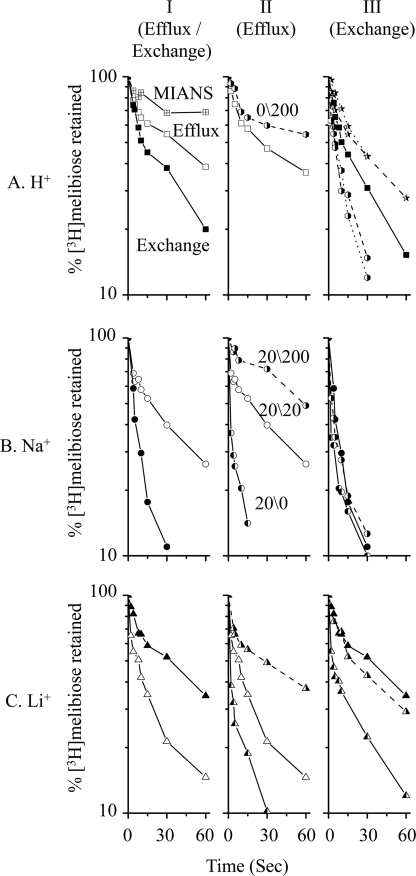
An important transport feature by cation-coupled transporters is the reversible reaction. De-energetic RSO vesicles containing MelB-ST were preloaded with 20 mm [3H]melibiose in the absence of Na+ and Li+. Melibiose downhill efflux or equilibrium exchange experiments were carried out by rapid dilution into a given buffer as described under “Experimental Procedures.” The loss of the intracellular [3H]melibiose was observed as a function of time (Fig. 3A, panel I) retaining <20% of internal melibiose at 3 min (data not plotted). Pretreatment of RSO vesicles with the water-soluble thiol reactive agent MIANS largely reduced the efflux rate (Fig. 3A, panel I), with >60% retained at 4 min (data not plotted). In purified MelB-ST, the alkylation of Cys residues by MIANS was protected by excess melibiose.3 Thus, it is likely that most of the outwardly flowed [3H]melibiose, which was detected in the efflux experiment, is mediated by MelB-ST proteins. Furthermore, the addition of external 200 mm Na+ reduced the efflux rate (Fig. 3A, panel II).
FIGURE 3.
[3H]Melibiose efflux and exchange. Intracellular [3H]melibiose was expressed as a percentage of the zero time point in the presence of external 200 mm Na+ or Li+. Open (Efflux) and filled (exchange) symbols represent equimolar cation concentrations across the membrane. The dashed line represents external 200 mm Na+ or Li+. A, de-energized RSO vesicles were pre-equilibrated with 20 mm [3H]melibiose without Na+ and Li+. Right-filled hexagons and stars represent the presence of external Na+ and Li+, respectively. The dotted line represents the presence of 20 mm external cations. RSO vesicles were also treated with 3.6 mm MIANS for 5 h at 23 °C and diluted into 100 mm potassium Pi, pH 7.5, in the absence of melibiose (crossed square). B and C, de-energized RSO vesicles were pre-equilibrated with 20 mm [3H]melibiose and 20 mm Na+ (B) or Li+ (C). The left-filled symbol represents the dilution buffer without Na+ or Li+ (20/0 mm). The right-filled symbol represents the dilution buffer containing 200 mm Na+ or Li+ (20/200 mm).
When the dilution buffer included an equimolar concentration of unlabeled melibiose (20 mm), melibiose exchange exhibited a rate slightly faster rate than efflux (Fig. 3A, panel I). It is striking that the melibiose exchange was reduced by external Li+ but stimulated by external Na+ (Fig. 3A, panel III). Further increase in cation concentration from 20 to 200 mm led to no additional effect.
Melibiose Efflux and Exchange with RSO Vesicles Preloaded with Na+
De-energetic RSO vesicles were pre-equilibrated with 20 mm [3H]melibiose and Na+. By diluting into buffers containing an equimolar concentration of Na+ (20/20 mm Na+, in/out), melibiose efflux yielded a slightly faster rate than that in the H+-coupled mode, and exchange was stimulated (Fig. 3B, panel I). Furthermore, [3H]melibiose outward flow was largely stimulated by diluting into a Na+-free buffer (20/0 mm), and a reduced rate was found with a higher external Na+ concentration (20/200 mm) (Fig. 3B, panel II). Conversely, exchange rate was little affected by varying the external Na+ concentration (Fig. 3B, panel III).
Melibiose Efflux and Exchange with RSO Vesicles Preloaded with Li+
Similar experiments were performed with Li+. When establishing equimolar concentrations on both sides of membrane, Li+ yielded an opposite effect on efflux and exchange, stimulating efflux and inhibiting exchange (Fig. 3C, panel I). Furthermore, the increase of outside Li+ concentration yielded little effect on the exchange rate; however, the outward flowing rate of melibiose was largely stimulated in the presence of an outwardly directed Li+ gradient (Fig. 3C, panel III). Finally, external Li+ inhibited efflux at a pattern similar to the Na+ effect; i.e. both external Na+ and external Li+ significantly decreased the efflux rate in a concentration-dependent manner (Fig. 3B, panel II, and 3C, panel II).
FRET Measurement
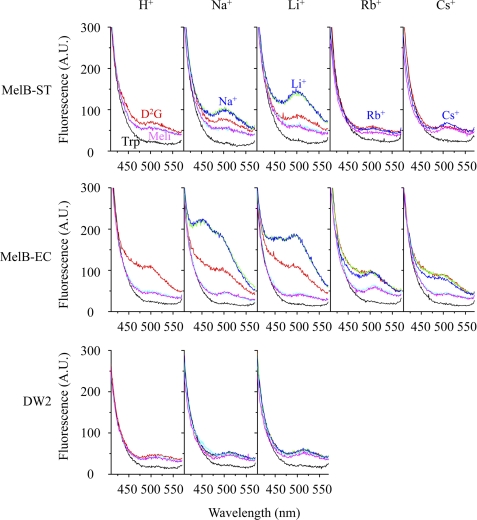
D2G is a fluorescent substrate for both MelB-EC and LacY (10, 51, 52). FRET from Trp residues to the dansyl moiety of the bound D2G has been established with reconstituted purified MelB-EC or membrane vesicles (10, 53). In the current study, D2G was applied to measure cosubstrate bindings in MelB-ST and to probe conformation of MelB-cosubstrate ternary complexes. RSO vesicles from E. coli DW2 containing MelB-ST in the absence of Na+ and Li+, i.e. in the presence of H+, were excited at 290 nm (Fig. 4, top panel, H+, black curve), yielding a typical Trp emission for membrane proteins with a λmax of 330 nm (data not shown); D2G, which was added to the solution, was excited by the Trp emission, yielding a broad emission between 410 and 570 nm with a λmax of ∼500 nm (red curve). The addition of excess melibiose decreased the dansyl fluorescence intensity (cyan curve); the further addition of melibiose yields no further effect (magenta curve). Little or no change in fluorescence emission is observed upon the addition of the same volume of water, 20% dimethyl sulfoxide (DMSO, used to dissolve the D2G), or the same concentration of non-substrates glucose and sucrose (data not shown). Furthermore, RSO vesicles prepared from E. coli DW2 without MelB were applied as controls. An emission spectrum of D2G with a λmax of 525 nm was detected (Fig. 4, bottom panel, red), which was not affected by the addition of melibiose, Na+, or Li+, and the emission intensity was similar to the magenta curves from DW2 containing MelB (Fig. 4, top and middle panels). These data indicate that the total D2G FRET signal (red curves) observed in MelB-ST is contributed from more than one source, and in the absence of Na+ and Li+, ∼27% displaceable FRET signal by melibiose resulted from the bound D2G in MelB-ST.
FIGURE 4.
FRET. RSO vesicles prepared from DW2 cells without or with MelB at a protein concentration of 0.5 mg/ml were excited at 290 nm. Emissions were plotted between 410 and 570 nm. Sugar and cation were added into RSO vesicles sequentially according to the following order: black lines, Trp emission; red lines, D2G emission (10 μm); green lines, Na+, Li+, Rb+, or Cs+ (20 mm); blue lines, Na+ or Li+ (20 mm), Rb+ or Cs+ (100 mm); cyan and magenta lines, melibiose (130 mm). In MelB-ST with Rb+, green and cyan curves were removed for clarity. Data were measured with Hitachi F-7000 fluorescence spectrophotometer. A.U., absorbance units.
Cation Activation on FRET
Similar experiments were carried out as described above, with the addition of Na+ or Li+ prior to the displacement of bound D2G. A 3-fold increase in dansyl emission by Na+ (Fig. 4, top panel, Na+, green curve) was observed in MelB-ST. The further addition of Na+ (blue curve) yields no additional change; additions of excess melibiose decreased the emission (cyan and magenta curves). In the presence of H+ and Na+, all curves obtained from melibiose displacement are overlaid well, and thus, not only represent the background level of FRET but also indicate that bound D2G was fully displaced by melibiose. When applying Li+ instead of Na+, a 6-fold higher stimulation in D2G fluorescence was observed (Fig. 4, top panel, Li+), whereas little or no effect was observed with rubidium or cesium cation (Fig. 4, top panel, Rb+ and Cs+). Consistent with the melibiose transport results, H+, Na+, and Li+ are coupled cations in MelB-ST.
The same measurements were performed with RSO vesicles containing MelB-EC. As described (10), a larger and broader emission between 420 and 570 nm (Fig. 4, middle panel) was observed upon adding D2G. The emission was descended to the background level in the presence of excess melibiose and largely increased by Na+ or Li+, with little effect by Rb+ or Cs+.
Bound D2G Emission Spectra
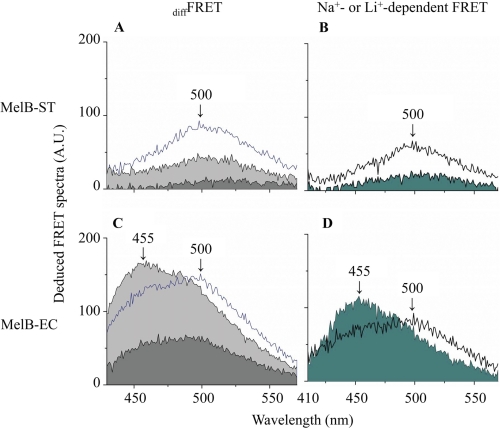
The bound D2G emission (diffFRET) was deduced from the difference before and after melibiose displacement (Fig. 4, between magenta and red or blue curves). With MelB-ST, bound D2G spectra with a λmax ∼500 nm were observed in the presence of H+, Na+, or Li+ (Fig. 5A). In MelB-EC, the emission yielded two unresolved peaks, with λmax values of ∼455 and 500 nm in the presence of all three cations (Fig. 5C). Furthermore, Na+- and Li+-dependent FRET were calculated by subtracting the H+-coupled emission (Fig. 5, B and D). Interestingly, Na+ induced a blue shift in addition to a large increase in emission.
FIGURE 5.
Deduced FRET spectra. A and C, diffFRET emission before and after the addition of excess melibiose was calculated from Fig. 4. Curves filled with light or dark gray represent the deduced diffFRET spectra in the presence of Na+ or H+, and the open blue curves represent diffFRET spectrum in the presence of Li+. B and D, Na+- and Li+-dependent FRET were calculated by subtracting the H+-coupled diffFRET and plotting in filled and open curves, respectively. A.U., absorbance units.
Sugar Affinities
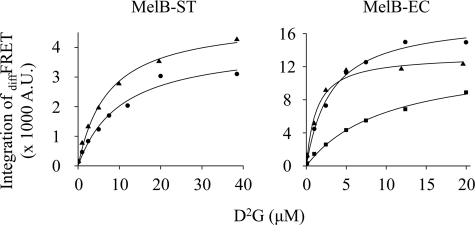
With RSO vesicles, diffFRET of D2G was measured in the presence of saturated Na+ or Li+, and apparent binding constants (appKd values) for D2G were determined by the hyperbolic fitting (Fig. 6). appKd values for D2G in MelB-ST are 10.35 or 7.29 μm in the presence of Na+ or Li+, respectively, which are 3- or 5-fold higher than those of MelB-EC, respectively (Table 1). A similar affinity for D2G was determined with purified MelB-ST.4
FIGURE 6.
appKd for D2G. Titration of D2G was measured by FRET in the presence of H+ (square), Na+ (circle), or Li+ (triangle) with Hitachi F-7000 fluorescence spectrophotometer. diffFRET representing the bound D2G was integrated between 460 and 540 nm for MelB-ST and 440 and 530 nm for MelB-EC, and the hyperbolic function was applied to fit data (Table 1). Poor D2G FRET signal in the absence of Na+ and Li+ precluded accurate measurements in MelB-ST. A.U., absorbance units.
TABLE 1.
| MelB-ST |
MelB-EC |
|||||
|---|---|---|---|---|---|---|
| H+ | Na+ | Li+ | H+ | Na+ | Li+ | |
| appKd for D2G (μm) | NDa | 10.35 | 7.29 | 10.15 | 3.10 | 1.27 |
| EC50 for melibiose displacement (mm) | ND | 2.10 | 2.12 | 2.82 | 0.99 | 0.75 |
| appKd for melibiose (mm)b | ND | 1.07 | 0.90 | 1.34 | 0.49 | 0.39 |
| K0.5 for D2G FRET (mm) | 1.1 | 1.4 | 0.18 | 0.25 | ||
a Not detectable.
b appKd = EC50 /{1 + [D2G]/Kd for D2G}.
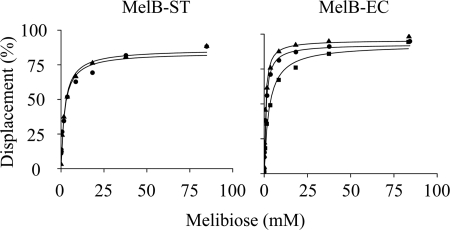
On a time trace, melibiose displacement of D2G FRET was measured with RSO vesicles containing MelB-ST. In the presence of Na+ or Li+, an EC50 value was determined of ∼2 mm (Fig. 7), and an appKd value for melibiose was calculated of ∼1 mm (Table 1). In MelB-EC, appKd values for melibiose are determined as 1.34, 0.49, and 0.39 mm in the presence of H+, Na+, and Li+, respectively. Na+ or Li+ increases affinity for melibiose by ∼3-fold. Due to lower affinity of MelB-ST, the melibiose EC50 in the absence of Na+ and Li+ could not be determined accurately.
FIGURE 7.
EC50 for melibiose displacement of D2G binding. With SLM-8100/DMX fluorescence spectrophotometer, displacements of D2G by melibiose at increasing concentrations were measured on a time trace with λEx 290 nm and λEm 500 nm and expressed as percentages of a total bound D2G. EC50 in the absence (square) or presence of Na+ (circle) or Li+ (triangle) was determined by hyperbolic fitting, and appKd for melibiose was calculated by the equation: appKd = EC50/{1 + [D2G]/Kd for D2G} (Table 1).
Na+ or Li+ Activation Constant (K0.5) for D2G FRET
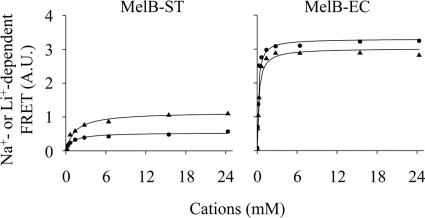
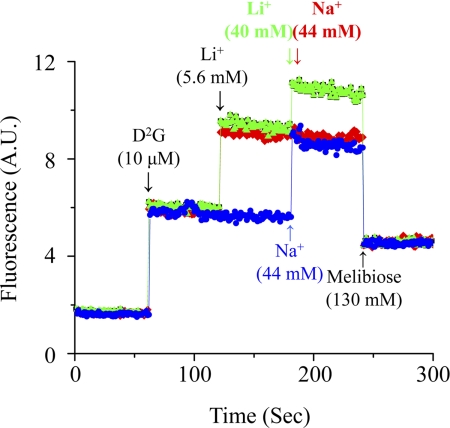
Cation-dependent FRET signals were measured on a time trace by adding Na+ or Li+ stepwise into RSO vesicles mixed with D2G. K0.5 values for Na+ and Li+ were determined as ∼1 mm in MelB-ST and ∼0.2 mm in MelB-EC (Fig. 8 and Table 1). Furthermore, competition of Na+ and Li+ effects on D2G FRET was examined in MelB-ST. The addition of 44 mm Na+ (44-fold K0.5 value) into RSO vesicles containing D2G and 5.6 mm Li+ (4-fold K0.5 value) yielded emission to a level similar to that induced by adding 44 mm Na+ (Fig. 9). Therefore, no additive effect in FRET emission was detected, indicating that both Na+ and Li+ compete for the same binding site in MelB-ST.
FIGURE 8.
Cation activation constants for D2G FRET. On a time trace with λEx 290 nm and λEm 500 nm, Na+ (circle) or Li+ (triangle) at increasing concentrations was added after 10 μm D2G was added. The stimulation in FRET signal was plotted as the concentration of Na+ or Li+ presented in solution, and K0.5Na and K0.5Li were determined by hyperbolic fitting (Table 1). A.U., absorbance units.
FIGURE 9.
Cation competition. On a time trace at λEx 290 nm and λEm 500 nm with SLM-8100/DMX fluorescence spectrophotometer, RSO containing MelB-ST was incubated with 5.6 mm Li+ (5-fold K0.5) after the addition of 10 μm D2G and followed by a saturated concentration of either Li+ (40 mm, green curve) or Na+ (44 mm, red curve) as the arrows indicate. As a control, Na+ (44 mm) was directly added without Li+ (blue curve). The FRET signals are displaced with 130 mm melibiose. A.U., absorbance units.
DISCUSSION
In the absence of Na+ or Li+ (i.e. in the presence of H+), the heterologously expressed MelB-ST can bind melibiose and catalyze melibiose uphill or downhill transport, efflux, and equilibrium exchange (Figs. 1–4 and Table 1). The presence of Na+ or Li+ stimulates uphill/downhill melibiose transport and efflux. Similar to other electrogenic symporters such as LacY (54), the accumulation of melibiose by MelB-ST is coupled to ΔΨ at pH 7.5 (Fig. 3). Without imposing ΔΨ, no melibiose uptake could be detected by adding Na+ or Li+ into RSO vesicles, and i.e. ΔΨ is required by maintaining Na+ or Li+ gradient via the Na+/H+ antiporter (NhaA) (40, 42, 49, 50). Furthermore, Na+ and Li+, not Rb+ or Cs+, also increase binding affinity for sugar substrates to the same extent, yielding appKd values of ∼10 μm for D2G and ∼1 mm for melibiose. The activation constants for Na+ and Li+ to stimulate D2G FRET were determined to be ∼1 mm (Table 1). Stimulation of FRET by Na+ and Li+ does not exhibit an additive effect, indicating that both cations compete for a common binding site (Fig. 9). Binding affinities for D2G and melibiose, as well as activation constants for Na+ and Li+, were also determined in RSO vesicles with MelB-EC and exhibit similar values to those determined with reconstituted purified protein (10). Thus, when compared with MelB-EC, MelB-ST has 2-fold lower affinity for melibiose and 6-fold lower activation constants for Na+ or Li+ (Table 1).
Melibiose-driven uptake of Na+, Li+, or H+ was detected with MelB-EC (55) in intact cells as well as in reconstituted vesicles (13, 14); however, melibiose-driven uptake of Na+ or Li+, but not H+, was reported in S. typhimurium containing MelB-ST (42, 43). It is unlikely that sugar binding and melibiose transport in MelB-ST without adding Na+ or Li+ (Figs. 1, A and C, 3A, and 5A) are due to contamination because the residual Na+ concentration, which was calculated to be <0.05 μm, is far below the activation concentration (∼1 mm). Therefore, these results clearly demonstrate that MelB-ST couples melibiose transport to H+, as well as Na+ or Li+, although there is a preference for the latter two cations.
Based on crystal structures (PDB ID 3DH4 and 2XQ2) at two different conformations (56, 62) and computational analyses (57, 62) of Vibrio parahaemolyticus SglT (vSglT), a revised kinetic model for the Na+/galactose symport of vSgIT suggests that the cytoplasmic release of the Na+ precedes that of the sugar. In MelB-ST, the melibiose exchange rate is faster than efflux when coupled to H+ and Na+ (Fig. 3, A, panel I, and 3B, panel I), although the difference is small when compared with LacY (48, 58). In MelB-EC, the stoichiometry for Na+:melibiose symport during efflux was determined with a ratio of 1:1 (59). The 22Na+ efflux rate was decreased during melibiose exchange, with an altered coupling ratio <0.2 (59). If the cation is released prior to sugar during melibiose efflux by MelB-ST, the presence of Na+ or Li+ at an equimolar concentration across membrane should decrease [3H]melibiose efflux. However, no inhibition of melibiose efflux is observed; rather, stimulation by Na+, and particularly by Li+, is obtained (Fig. 3, B, panel I, and 3C, panel I). Furthermore, melibiose exchange is stimulated by an inwardly directed Na+ gradient (0/20 or 0/200 mm, Fig. 3 A, panel III; 20/200 mm, Fig. 3B, panel III). It is also found that an inwardly directed Na+ gradient decreases efflux (0/200 mm, Fig. 3A, panel II; 20/200 mm, Fig. 3B, panel II). Conceivably, a higher extracellular Na+ may slow Na+ release during efflux, whereas the opposite effect on exchange may be due to an increase in sugar binding affinity. Taken together, these results are consistent with current kinetic models proposed for MelB-EC (14, 27) and LacY (6, 60), where dissociation of the cation during sugar efflux is the rate-limiting step, and sugar is released prior to the cation. Although a high-resolution x-ray crystal structure of MelB is not available yet, a proposed three-dimensional model for MelB (27) indicates an overall fold similar to LacY (PDB ID 1PV7, 1PV6, 2V8N, 2CFP, and 2CFQ) (28, 29, 61) but different from vSglT (56). Cosubstrates are located in a single internal cavity in MelB and LacY but positioned in two connected pockets in vSglT.
Although Li+ stimulates efflux and an outwardly directed Li+ gradient increases exchange, in the absence of melibiose or Li+ gradients, the release of melibiose from the ternary complex is inhibited (Fig. 3C, panel I). It is noteworthy that inhibition is specific for Li+, but not Na+ (Fig. 3B, panel III). Similar results were also observed with MelB-EC (20, 59). It is interesting that Li+ does not inhibit methyl-β-d-thiogalactoside exchange (59). Although the mechanism of inhibition is not clear, Li+ does not inactivate MelB. Rather, it is possible that the ternary complex favors an occluded state in which there is no exchange between free and bound sugars.
The fluorescent sugar D2G is a good tool for measuring cosubstrate binding. D2G is now used to explore the conformation distribution of MelB-cosubstrate complexes. In MelB-EC, broad emission spectra exhibited by bound D2G probably implies a wide range of conformers with at least two major populations contributing to the emissions at 455 and 500 nm. MelB-ST and MelB-EC exhibit 85% sequence identity with eight Trp residues that are aligned well. In MelB-ST, however, the bound D2G emission spectra in the presence of all three coupling cations are symmetrical. Thus, the conformation distribution of MelB-ST ternary complexes might be relatively homogeneous in the membrane.
Acknowledgments
We thank Gérard Leblanc for materials and suggestions; H. Ronald Kaback for insightful discussions and critical reading of the manuscript; Tomofusa Tsuchiya for the S. typhimurium LT2 strain; Mohammad Yousef for the critical reading of the manuscript and stimulating discussion; Alex Hadkoff for technical support; and Guillermo Altenberg and Raul Matinez-Zaguilan for kindly allowing the use of fluorometers.
This work was supported, in whole or in part, by National Institutes of Health Grants R21HL087895 and R01GM095538 (to L. G.). This work was also supported by Texas Norman Hackerman Advanced Research Program Grant 010674-0034-2009 (to L. G.).
M. Yousef, S. Nurva, and L. Guan, unpublished data.
S. Nurva, M. Yousef, and L. Guan, unpublished data.
- MelB-ST
- melibiose permease of S. typhimurium
- MelB-EC
- MelB of E. coli
- LacY
- lactose permease of E. coli
- D2G
- 2′-(N-dansyl)aminoalkyl-1-thio-β-d-galactopyranoside
- Δμ̃H+
- electrochemical H+ gradient
- ΔΨ
- membrane potentials
- diffFRET
- the difference in FRET signal before and after adding excess of melibiose
- RSO
- right-side-out
- MIANS
- 2-(4′-maleimidylanilino)-naphthalene-6-sulfonic acid
- λEx
- fluorescence excitation wavelengths
- λEm
- fluorescence emission wavelengths.
REFERENCES
- 1. Smith K. M., Slugoski M. D., Loewen S. K., Ng A. M., Yao S. Y., Chen X. Z., Karpinski E., Cass C. E., Baldwin S. A., Young J. D. (2005) J. Biol. Chem. 280, 25436–25449 [DOI] [PubMed] [Google Scholar]
- 2. Hirayama B. A., Loo D. D., Wright E. M. (1997) J. Biol. Chem. 272, 2110–2115 [DOI] [PubMed] [Google Scholar]
- 3. Wilson D. M., Wilson T. H. (1987) Biochim. Biophys. Acta 904, 191–200 [DOI] [PubMed] [Google Scholar]
- 4. Saier M. H., Jr. (2000) Mol. Microbiol. 35, 699–710 [DOI] [PubMed] [Google Scholar]
- 5. Kaback H. R., Sahin-Tóth M., Weinglass A. B. (2001) Nat. Rev. Mol. Cell Biol. 2, 610–620 [DOI] [PubMed] [Google Scholar]
- 6. Guan L., Kaback H. R. (2006) Annu. Rev. Biophys. Biomol. Struct. 35, 67–91 [DOI] [PMC free article] [PubMed] [Google Scholar]
- 7. Ding P. Z., Wilson T. H. (2001) Biochem. Biophys. Res. Commun. 285, 348–354 [DOI] [PubMed] [Google Scholar]
- 8. León X., Lórenz-Fonfría V. A., Lemonnier R., Leblanc G., Padrós E. (2005) Biochemistry 44, 3506–3514 [DOI] [PubMed] [Google Scholar]
- 9. Abdel-Dayem M., Basquin C., Pourcher T., Cordat E., Leblanc G. (2003) J. Biol. Chem. 278, 1518–1524 [DOI] [PubMed] [Google Scholar]
- 10. Maehrel C., Cordat E., Mus-Veteau I., Leblanc G. (1998) J. Biol. Chem. 273, 33192–33197 [DOI] [PubMed] [Google Scholar]
- 11. Garcia-Celma J. J., Dueck B., Stein M., Schlueter M., Meyer-Lipp K., Leblanc G., Fendler K. (2008) Langmuir 24, 8119–8126 [DOI] [PubMed] [Google Scholar]
- 12. Pourcher T., Leclercq S., Brandolin G., Leblanc G. (1995) Biochemistry 34, 4412–4420 [DOI] [PubMed] [Google Scholar]
- 13. Ganea C., Pourcher T., Leblanc G., Fendler K. (2001) Biochemistry 40, 13744–13752 [DOI] [PubMed] [Google Scholar]
- 14. Meyer-Lipp K., Séry N., Ganea C., Basquin C., Fendler K., Leblanc G. (2006) J. Biol. Chem. 281, 25882–25892 [DOI] [PubMed] [Google Scholar]
- 15. León X., Leblanc G., Padrós E. (2009) Biophys. J. 96, 4877–4886 [DOI] [PMC free article] [PubMed] [Google Scholar]
- 16. León X., Lemonnier R., Leblanc G., Padrós E. (2006) Biophys. J. 91, 4440–4449 [DOI] [PMC free article] [PubMed] [Google Scholar]
- 17. Tokuda H., Kaback H. R. (1977) Biochemistry 16, 2130–2136 [DOI] [PubMed] [Google Scholar]
- 18. Tokuda H., Kaback H. R. (1978) Biochemistry 17, 698–705 [DOI] [PubMed] [Google Scholar]
- 19. Tsuchiya T., Raven J., Wilson T. H. (1977) Biochem. Biophys. Res. Commun. 76, 26–31 [DOI] [PubMed] [Google Scholar]
- 20. Bassilana M., Pourcher T., Leblanc G. (1987) J. Biol. Chem. 262, 16865–16870 [PubMed] [Google Scholar]
- 21. Lopilato J., Tsuchiya T., Wilson T. H. (1978) J. Bacteriol. 134, 147–156 [DOI] [PMC free article] [PubMed] [Google Scholar]
- 22. Damiano-Forano E., Bassilana M., Leblanc G. (1986) J. Biol. Chem. 261, 6893–6899 [PubMed] [Google Scholar]
- 23. Mus-Veteau I., Pourcher T., Leblanc G. (1995) Biochemistry 34, 6775–6783 [DOI] [PubMed] [Google Scholar]
- 24. Botfield M. C., Naguchi K., Tsuchiya T., Wilson T. H. (1992) J. Biol. Chem. 267, 1818–1822 [PubMed] [Google Scholar]
- 25. Pourcher T., Bibi E., Kaback H. R., Leblanc G. (1996) Biochemistry 35, 4161–4168 [DOI] [PubMed] [Google Scholar]
- 26. Gwizdek C., Leblanc G., Bassilana M. (1997) Biochemistry 36, 8522–8529 [DOI] [PubMed] [Google Scholar]
- 27. Yousef M. S., Guan L. (2009) Proc. Natl. Acad. Sci. U.S.A. 106, 15291–15296 [DOI] [PMC free article] [PubMed] [Google Scholar]
- 28. Abramson J., Smirnova I., Kasho V., Verner G., Kaback H. R., Iwata S. (2003) Science 301, 610–615 [DOI] [PubMed] [Google Scholar]
- 29. Guan L., Mirza O., Verner G., Iwata S., Kaback H. R. (2007) Proc. Natl. Acad. Sci. U.S.A. 104, 15294–15298 [DOI] [PMC free article] [PubMed] [Google Scholar]
- 30. Matsuzaki S., Weissborn A. C., Tamai E., Tsuchiya T., Wilson T. H. (1999) Biochim. Biophys. Acta 1420, 63–72 [DOI] [PubMed] [Google Scholar]
- 31. Pourcher T., Deckert M., Bassilana M., Leblanc G. (1991) Biochem. Biophys. Res. Commun. 178, 1176–1181 [DOI] [PubMed] [Google Scholar]
- 32. Hama H., Wilson T. H. (1994) J. Biol. Chem. 269, 1063–1067 [PubMed] [Google Scholar]
- 33. Pourcher T., Zani M. L., Leblanc G. (1993) J. Biol. Chem. 268, 3209–3215 [PubMed] [Google Scholar]
- 34. Zani M. L., Pourcher T., Leblanc G. (1994) J. Biol. Chem. 269, 24883–24889 [PubMed] [Google Scholar]
- 35. Zani M. L., Pourcher T., Leblanc G. (1993) J. Biol. Chem. 268, 3216–3221 [PubMed] [Google Scholar]
- 36. Franco P. J., Wilson T. H. (1999) J. Bacteriol. 181, 6377–6386 [DOI] [PMC free article] [PubMed] [Google Scholar]
- 37. Franco P. J., Jena A. B., Wilson T. H. (2001) Biochim. Biophys. Acta 1510, 231–242 [DOI] [PubMed] [Google Scholar]
- 38. Hacksell I., Rigaud J. L., Purhonen P., Pourcher T., Hebert H., Leblanc G. (2002) EMBO J. 21, 3569–3574 [DOI] [PMC free article] [PubMed] [Google Scholar]
- 39. Purhonen P., Lundbäck A. K., Lemonnier R., Leblanc G., Hebert H. (2005) J. Struct. Biol. 152, 76–83 [DOI] [PubMed] [Google Scholar]
- 40. Wilson T. H., Ding P. Z. (2001) Biochim. Biophys. Acta 1505, 121–130 [DOI] [PubMed] [Google Scholar]
- 41. Hama H., Wilson T. H. (1993) J. Biol. Chem. 268, 10060–10065 [PubMed] [Google Scholar]
- 42. Niiya S., Moriyama Y., Futai M., Tsuchiya T. (1980) J. Bacteriol. 144, 192–199 [DOI] [PMC free article] [PubMed] [Google Scholar]
- 43. Mizushima K., Awakihara S., Kuroda M., Ishikawa T., Tsuda M., Tsuchiya T. (1992) Mol. Gen. Genet. 234, 74–80 [DOI] [PubMed] [Google Scholar]
- 44. Kaback H. R. (1971) Methods Enzymol. XXII, 99–120 [Google Scholar]
- 45. Short S. A., Kaback H. R., Kohn L. D. (1974) Proc. Natl. Acad. Sci. U.S.A. 71, 1461–1465 [DOI] [PMC free article] [PubMed] [Google Scholar]
- 46. Kaback H. R. (1974) Methods Enzymol. 31, 698–709 [DOI] [PubMed] [Google Scholar]
- 47. Konings W. N., Barnes E. M., Jr., Kaback H. R. (1971) J. Biol. Chem. 246, 5857–5861 [PubMed] [Google Scholar]
- 48. Kaczorowski G. J., Kaback H. R. (1979) Biochemistry 18, 3691–3697 [DOI] [PubMed] [Google Scholar]
- 49. West I. C., Mitchell P. (1974) Biochem. J. 144, 87–90 [DOI] [PMC free article] [PubMed] [Google Scholar]
- 50. Schuldiner S., Fishkes H. (1978) Biochemistry 17, 706–711 [DOI] [PubMed] [Google Scholar]
- 51. Schuldiner S., Kerwar G. K., Kaback H. R., Weil R. (1975) J. Biol. Chem. 250, 1361–1370 [PubMed] [Google Scholar]
- 52. Smirnova I. N., Kasho V. N., Kaback H. R. (2006) Biochemistry 45, 15279–15287 [DOI] [PMC free article] [PubMed] [Google Scholar]
- 53. Cordat E., Mus-Veteau I., Leblanc G. (1998) J. Biol. Chem. 273, 33198–33202 [DOI] [PubMed] [Google Scholar]
- 54. Schuldiner S., Kaback H. R. (1975) Biochemistry 14, 5451–5461 [DOI] [PubMed] [Google Scholar]
- 55. Tsuchiya T., Wilson T. H. (1978) Membr. Biochem. 2, 63–79 [DOI] [PubMed] [Google Scholar]
- 56. Faham S., Watanabe A., Besserer G. M., Cascio D., Specht A., Hirayama B. A., Wright E. M., Abramson J. (2008) Science 321, 810–814 [DOI] [PMC free article] [PubMed] [Google Scholar]
- 57. Li J., Tajkhorshid E. (2009) Biophys. J. 97, L29–31 [DOI] [PMC free article] [PubMed] [Google Scholar]
- 58. Guan L., Kaback H. R. (2009) Biochemistry 48, 9250–9255 [DOI] [PMC free article] [PubMed] [Google Scholar]
- 59. Bassilana M., Pourcher T., Leblanc G. (1988) J. Biol. Chem. 263, 9663–9667 [PubMed] [Google Scholar]
- 60. Garcia-Celma J. J., Ploch J., Smirnova I., Kaback H. R., Fendler K. (2010) Biochemistry 49, 6115–6121 [DOI] [PMC free article] [PubMed] [Google Scholar]
- 61. Mirza O., Guan L., Verner G., Iwata S., Kaback H. R. (2006) EMBO J. 25, 1177–1183 [DOI] [PMC free article] [PubMed] [Google Scholar]
- 62. Watanabe A., Choe S., Chaptal V., Rosenberg J. M., Wright E. M., Grabe M., Abramson J. (2010) Nature 468, 988–991 [DOI] [PMC free article] [PubMed] [Google Scholar]


