

Abstract
The in vivo mechanism of regulatory T cell (Treg cell) function in controlling autoimmunity remains controversial. Here we have used two-photon laser-scanning microscopy to analyze lymph node priming of diabetogenic T cells and to delineate the mechanisms of Treg cell control of autoimmunity in vivo. Islet antigen–specific CD4+CD25− T helper cells (TH cells) and Treg cells swarmed and arrested in the presence of autoantigens. These TH cell activities were progressively inhibited in the presence of increasing numbers of Treg cells. There were no detectable stable associations between Treg and TH cells during active suppression. In contrast, Treg cells directly interacted with dendritic cells bearing islet antigen. Such persistent Treg cell–dendritic cell contacts preceded the inhibition of TH cell activation by dendritic cells, supporting the idea that dendritic cells are central to Treg cell function in vivo.
Autoimmune disease results from the dysregulation of basic processes designed to maintain self-tolerance. The identification of regulatory T (Treg) lymphocytes as an important component of self-tolerance has opened a principal area of investigation in immunology, and many studies have demonstrated the potent influence of Treg cells on natural and induced autoimmune diseases in a variety of mouse models1–5. For example, NOD.Cd28−/− nonobese diabetic mice, deficient in Treg cells, develop diabetes at an accelerated rate compared with NOD mice6. Injection of NOD Treg cells into NOD.Cd28−/− mice delays and in some cases prevents the development of diabetes6. Islet antigen–specific Treg cell populations isolated and expanded from BDC2.5 T cell receptor (TCR)–transgenic mice (called ‘BDC2.5 mice’ here) routinely prevent and even reverse spontaneous autoimmune diabetes in NOD mice7,8; however, the molecular and cellular mechanisms of in vivo suppression remain to be elucidated.
Many in vitro studies have suggested that Treg cells function in a cytokine-independent, cell-cell contact–dependent way9–15. In fact, some have suggested that Treg cells suppress through direct T cell–T cell interaction16. In contrast, most in vivo models of Treg cell suppression have provided strong evidence for bystander suppression and dependence on interleukin 10 or transforming growth factor-β17–20. Little is known about whether cell-cell contacts between Treg cells and dendritic cells (DCs) and/or TH cells actually take place in vivo. Here we took advantage of three advances, the in vitro expansion of antigen-specific Treg cell populations, the development of new reporter mice and two-photon laser-scanning microscopy (TPLSM), to investigate the biological basis of Treg cell suppression of the priming of diabetogenic T cells in antigen-draining pancreatic lymph nodes. Other TPLSM studies have shown the highly dynamic nature of T cell activity in antigen-draining lymph nodes after exposure of mice to nominal antigen in adjuvant- or antigen-pulsed mature DCs21–25. After entering the lymph node through high endothelial venules, T cells traverse through an area bordering the paracortical T cell zone and B cell follicles, where tissue-emigrant DCs congregate26,27. DCs and T cells initially interact transiently, probing each other for cognate ligands, which gives rise to the swarming activity of the T cells. Such dynamic interactions are followed by arrest of T cells and long-lasting stable conjugations between DCs and T cells, which correlate with productive T cell activation. We noted that the activity of autoreactive islet antigen–specific CD4+CD25− TH cells in antigen-bearing pancreatic lymph nodes was very similar to that described for foreign antigen–specific T cells reported before21–25. In addition, we found that Treg cells swarmed and arrested to form static clusters in the presence of antigen in a way indistinguishable from that of CD4+CD25− TH cells. Notably, the most sustained T cell arrest was in Treg cell–deficient NOD.Cd28−/− mice. Transfer of increasing numbers of Treg cells progressively compromised the cell arrest and the swarming of autoreactive CD4+CD25− TH cells in pancreatic lymph nodes. Finally, TPLSM analysis did not demonstrate stable interactions between the Treg cells and CD4+CD25− TH cells during suppression. Instead, Treg cells interacted with antigen-bearing DCs in draining lymph nodes to prevent the priming of autoreactive CD4+CD25− TH cells.
Results
Treg cells inhibit priming of TH cells
We did initial studies to assess the effect of resident Treg cells in NOD mice on the priming of autoreactive CD4+CD25− TH cells in the pancreatic lymph node. We compared the activation profiles of CD4+CD25− TH cells from BDC2.5 mice after adoptive transfer into prediabetic NOD or Treg cell–deficient NOD.Cd28−/− mice. We depleted BDC2.5 Thy-1.1 congenic CD4+ lymph node cell samples of CD25+ cells and labeled the cells with carboxyfluorescein diacetate succinimidyl ester (CFSE) before transferring them into prediabetic 10- to 15-week-old Thy-1.2 NOD or 5- to 7-week-old NOD.Cd28−/− mice. We collected pancreatic and inguinal lymph nodes from the recipient mice 4 d later and measured the CD62L expression on as well as the proliferation of the transferred cells as parameters of in vivo priming. In the absence of islet antigen (inguinal lymph nodes), BDC2.5 CD4+CD25− TH cells did not proliferate in NOD mice (Fig. 1a) or NOD.Cd28−/− recipient mice (data not shown), as assessed by CFSE dilution using flow cytometry. Between 20% and 40% of the cells entered the cell cycle in the antigen-bearing pancreatic lymph nodes of NOD recipient mice, with most these cells dividing two to three times in the 4-day period (Fig. 1a). The dividing cells did not notably downregulate CD62L expression. In contrast, 60–80% of the cells entered the cell cycle in Treg cell–deficient NOD.Cd28−/− recipients, with most of these downregulating CD62L expression and dividing more than six times (Fig. 1a). These results suggested that the presence of endogenous Treg cells in NOD mice suppressed the priming of autoreactive CD4+CD25− TH cells. To determine whether the differences in the BDC2.5 CD4+CD25− TH cell proliferation in the NOD and NOD.Cd28−/− mice were due to the differences in the numbers of endogenous Treg cells, we expanded CD4+CD25+CD62Lhi Treg cell populations isolated from young NOD donors and used 20 × 106 of these cells to reconstitute each 4-week-old NOD.Cd28−/− mouse. Treg cell reconstitution reduced the proliferation of the BDC2.5 CD4+CD25− TH cells, such that 30–50% of the BDC2.5 cells entered cell cycle (Fig. 1a). Although large numbers of NOD Treg cells were transferred into the NOD.Cd28−/− mice, only a small fraction of the transferred cells homed to and seeded the lymph nodes of these recipient mice at the time of BDC2.5 CD4+CD25− TH cell transfer, and the frequencies of Treg cells in these reconstituted hosts were slightly lower than those in age-matched NOD mice (data not shown). Thus, the reduced priming and activation of BDC2.5 CD4+CD25− TH cells in these mice was not due to the high frequency of transferred cells. Instead, proliferation of BDC2.5 CD4+CD25− TH in the pancreatic lymph node inversely correlated with the number of Treg cells in these mice.
Figure 1.
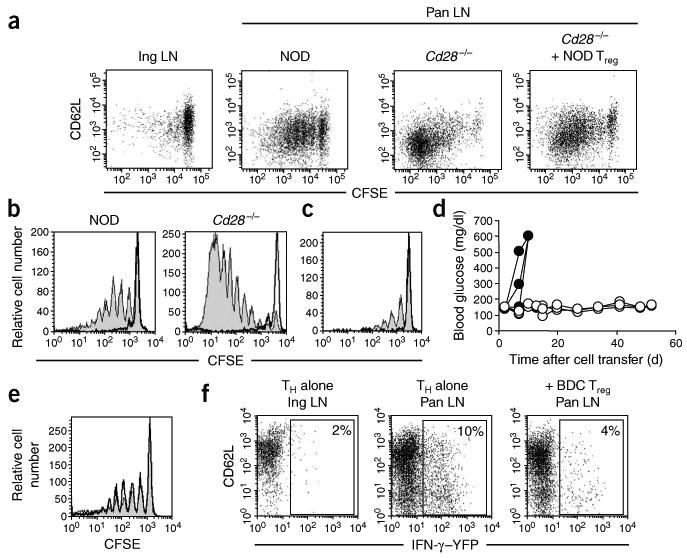
Treg cells suppress the priming of islet antigen–specific CD4+CD25− TH cells in the pancreatic lymph node. (a) CD62L expression and CFSE profiles of CFSE-labeled BDC2.5.Thy-1.1 CD4+CD25− TH cells transferred into NOD (n = 10), NOD.Cd28−/− (n = 10) and Treg cell–reconstituted NOD.Cd28−/− mice (far right; n = 4). Transferred cells in inguinal lymph nodes (Ing LN) of NOD recipients and pancreatic lymph nodes (Pan LN) of all recipients were analyzed. (b,c) CFSE profiles of transferred cells in the pancreatic lymph nodes of NOD and NOD.Cd28−/− mice injected with BDC2.5 Treg cells (bold histograms) or left untreated (filled histograms) 2 d before adoptive transfer of CFSE-labeled Thy-1.1+ BDC2.5 CD4+CD25− TH cells (b) or Thy-1.1+ 4.1 CD4+CD25− TH cells (c). (d) Nonfasting blood glucose of NOD.Rag1−/− mice given CD4+CD25− TH cells from 4.1 TCR-transgenic mice; cells were transferred alone (filled symbols) or together with BDC2.5 Treg cells (open symbols). (e) CFSE profiles of CD4+Thy-1.1+ cells in the pancreatic lymph nodes of NOD mice (n = 10) injected with CFSE-labeled Thy-1.1+ BDC2.5 CD4+CD25− TH cells alone (filled histograms) or together with BDC2.5 Treg cells (bold histograms). (f) YFP expression on CD4+Thy-1.1+ cells in the inguinal and pancreatic lymph nodes of NOD mice (n = 10) given CD4+CD25− TH cells from BDC2.5.Thy-1.1.Yeti mice; cells were transferred alone (CD4+CD25− TH alone) or together with BDC2.5 Treg cells (+BDC Treg). Numbers in dot plots indicate the percentage of YFP+ cells. Data are representative of three or more experiments.
Next we determined whether reconstitution of islet antigen–specific Treg cells was more effective than polyclonal NOD Treg cells in inhibiting the priming of BDC2.5 T cells in NOD and NOD.Cd28−/− mice. We expanded BDC2.5 Treg cell populations in vitro and transferred the cells 2 d before introducing CFSE-labeled Thy-1.1+BDC2.5 CD4+CD25− TH cells. The presence of BDC2.5 Treg cells in NOD mice almost completely abrogated the proliferation of the BDC2.5 CD4+CD25− TH cells (Fig. 1b, left). In fact, the CFSE profile of the CD4+CD25− TH cells in this setting closely resembled that noted in the antigen-deficient inguinal lymph nodes. Moreover, the BDC2.5 Treg cells blocked the massive proliferation of BDC2.5 TH cells in the pancreatic lymph nodes of NOD.Cd28−/− mice (Fig. 1b, right). In these experiments, the autoreactive T cells and Treg cells expressed the same TCR and recognized the same antigen. To determine whether BDC2.5 Treg cell inhibition of BDC2.5 CD4+CD25− TH cell proliferation was a result of antigen competition, we examined the effect of BDC2.5 Treg cells on the proliferation of CD4+CD25− TH cells from the 4.1 TCR-transgenic mice. The 4.1 TCR-transgenic cells have a different pattern of major histocompatibility complex dependence during thymic selection and peripheral activation from that of BDC2.5 T cells and are thought to recognize an islet antigen distinct from that recognized by BDC2.5 T cells28. As with BDC2.5 CD4+CD25− TH cells, BDC2.5 Treg cells abrogated the proliferation of 4.1 CD4+CD25− TH cells in the pancreatic lymph node (Fig. 1c). In addition, transfer of BDC2.5 Treg cells completely abrogated the diabetes induced by transfer of 4.1 CD4+CD25− TH cells to NOD recipient mice deficient in recombination-activating gene 1 (NOD.Rag1−/−; Fig. 1d). These results demonstrate that Treg cells can suppress CD4+CD25− TH cells with other antigen specificities. These data suggest that Treg cells can effectively prevent the priming of autoreactive CD4+CD25− TH cells in antigen-draining lymph nodes when they are present in the lymph node before the arrival of autoreactive T cells.
In many experimental systems, Treg cells can effectively block autoimmune diseases when transferred together with pathogenic T cells and, in some cases, when given after disease onset7. Therefore, we sought to determine if Treg cells could control the activation of autoreactive cells when transferred together with CD4+CD25− TH cells. We expanded BDC2.5 Treg cell populations and transferred the cells together with CFSE-labeled CD4+CD25− TH cells from Thy-1.1 BDC2.5 mice and analyzed CFSE dilution of the CD4+Thy-1.1+ cells 4 d after transfer. The proliferation of the BDC2.5 CD4+CD25− TH cells was not affected by the cotransfer of BDC2.5 Treg cells (Fig. 1e). To determine if Treg cells instead affected the differentiation of BDC2.5 CD4+CD25− TH cells in this setting, we took advantage of the interferon-γ (IFN-γ) reporter mice known as ‘Yeti mice’29. In these reporter mice, a gene encoding yellow fluorescent protein (YFP) is under the same control as the gene encoding IFN-γ. We backcrossed Yeti mice 12 generations onto the NOD background and then bred the progeny to BDC2.5 and Thy-1.1 NOD mice to generate ‘NOD.BDC2.5.Thy-1.1.Yeti’ mice. Thus, we were able to assess in vivo IFN-γ expression by the BDC2.5.Thy-1.1.Yeti cells directly by analyzing YFP expression without further in vitro manipulation, providing a more accurate assessment of the in vivo differentiation of the cells. We injected CD4+CD25− TH cells from BDC2.5.Thy-1.1.Yeti mice alone or together with expanded BDC2.5 Treg cell populations into prediabetic NOD recipients and analyzed YFP expression in pancreatic and inguinal lymph nodes. CD4+ cells freshly isolated from NOD.BDC2.5.Thy-1.1.Yeti mice did not express YFP (data not shown). However, 8 d after transfer, an average of 10% (range, 5–15%) of the Thy-1.1+CD4+ cells expressed YFP in pancreatic but not inguinal lymph nodes (Fig. 1f, left and middle). Simultaneous transfer of BDC2.5 Treg cells and BDC2.5.Thy-1.1.Yeti cells suppressed IFN-γ mRNA expression in pancreatic lymph nodes (Fig. 1f, right). The control of IFN-γ expression is at the transcriptional level, as YFP expression in the Yeti mice has been reported to best correlate with expression of IFN-γ mRNA29. However, we also found that the transferred BDC2.5 effector cells expressed IFN-γ protein after in vitro restimulation with phorbol 12-myristate 13-acetate and ionophore in the presence of monensin (data not shown). These results demonstrate that Treg cells can efficiently suppress both the proliferation and differentiation of autoreactive T cells in lymph nodes in vivo.
Treg cells alter TH cell dynamic activity
To pinpoint the cellular interactions and processes involved in Treg cell suppression in vivo, we examined CD4+CD25− TH cells and Treg cells in intact explanted lymph nodes using TPLSM. We first compared the activity of CD4+CD25− TH cells in NOD and Treg cell–deficient NOD.Cd28−/− mice to assess the influence of endogenous Treg cells on CD4+CD25− TH cell activities. We purified BDC2.5 CD4+CD25− TH cells and labeled them with CFSE before transferring them into various recipient mice (as described in Fig. 1). In an initial sets of experiments, we killed recipient mice at 8, 12, 18, 24, 30 and 72 h after cell transfer to determine the kinetics of early activation in the pancreatic lymph node. We removed pancreatic and inguinal lymph nodes immediately after killing the recipient mice and placed the lymph nodes in oxygenated medium for TPLSM analysis. For each lymph node, we collected adjacent single-time-point z-stack images covering the entire pancreatic lymph node 350 μm deep into the tissue (Supplementary Fig. 1 online). Such analysis allowed us to survey the lymph node for the presence and distribution of transferred cells and to select areas containing sufficient numbers of transferred cells for time-lapse imaging to determine the movement dynamics of the cells. In both NOD and NOD.Cd28−/− recipients, BDC2.5 CD4+CD25− TH cells were highly motile in inguinal lymph nodes in the absence of antigen. The CD4+CD25− TH cells seemed to move randomly, such that the trajectories for most cells were long and extended and pointed in different directions (Fig. 2a and Supplementary Video 1 online). In the pancreatic lymph nodes of NOD mice, in addition to free-moving cells (Fig. 2b, cells in upper field), some cells showed swarming-like activity, moving actively in a confined area with long but restricted trajectories (Fig. 2b, cells in lower center field, and Supplementary Video 2 online). The size of each ‘swarm’ varied in individual recipients, ranging from more than 50 cells occupying an area larger than 100 × 100 × 100 μm3 to only 5 cells in a space of 10 × 10 × 10 μm3. We detected swarms of varying sizes in approximately 60% of the pancreatic lymph nodes from 10- to 15-week-old prediabetic NOD recipients (Table 1). In the pancreatic lymph nodes of NOD.Cd28−/− mice, in addition to swarming, some cells arrested and formed small static clusters that persisted in the 15- to 60-minute imaging period (Fig. 2c and Supplementary Video 3 online). We detected cellular arrest and static clustering in all pancreatic lymph nodes in the NOD.Cd28−/− recipients examined (Table 1), and this seemed to be similar to the stable interactions reported before for T cells activated by antigen-bearing mature DCs after active immunization22–24. We almost never found arrest and static clustering in prediabetic NOD mice, and swarming was also present at a reduced frequency relative to that of NOD.Cd28−/− mice (Table 1), indicating that resident Treg cells in NOD mice regulate T cell activation at this early stage in the steady state.
Figure 2.
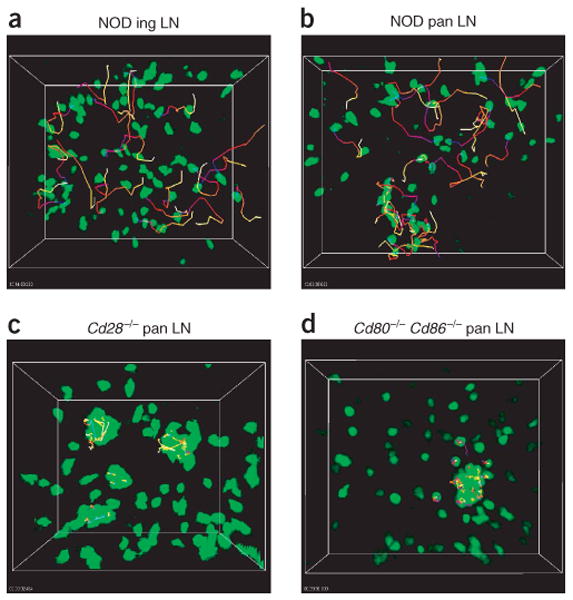
Movement dynamics of BDC2.5 CD4+CD25− TH cells in explanted lymph nodes. Lymph nodes were collected for imaging 24 h and 18 h after transfer of CFSE-labeled BDC2.5 CD4+CD25− TH cells into NOD (a,b), NOD.Cd28−/− (c), and NOD.Cd80−/−Cd86−/− (d) recipients, respectively. Time-lapse images were obtained and the positions of individual cells over time were identified with Imaris tracking software. Images present the trajectories for some randomly selected cells.; tracks are ‘color-coded’ to indicate time progression from the beginning (blue) to the end (yellow) of imaging. Data are representative of five or more independent experiments, except d, which is two experiments.
Table 1. Movement patterns of BDC2.5 TH cells and Treg cells in the pancreatic lymph node.
| Recipient mice | Cell type imaged | Total mice analyzed | Swarm and arrest-cluster | Swarm without arrest-cluster | No swarm or arrest-cluster |
|---|---|---|---|---|---|
| NOD | TH | 19 | 1 (5.2%) | 12 (63.2%) | 6 (31.6%) |
| NOD | Treg | 10 | 0 | 6 (60%) | 4 (40%) |
| NOD + BDC2.5 Treg cells | TH | 10 | 0 | 0 | 10 (100%) |
| Cd28−/− | TH | 9 | 9 (100%) | 0 | 0 |
| Cd28−/− | Treg | 5 | 4 (80%) | 1 (20%) | 0 |
| Cd28−/− + NOD Treg cells | TH | 3 | 0 | 3 (100%) | 0 |
| Cd28−/− + BDC2.5 Treg cells | TH | 5 | 0 | 0 | 5 (100%) |
| Cd80−/−Cd86−/− | TH | 3 | 3 (100%) | 0 | 0 |
TPLSM imaging of BDC2.5 CD4+CD25− TH cells and Treg cells in the pancreatic lymph nodes of various recipients. The entire top 350 μm of each lymph node was first surveyed for the presence of cell aggregations indicative of swarming and clustering activity. The movement of the cells in these areas was then recorded by time-lapse imaging to determine the pattern of the movement: free, swarming (swarm), or clustering and arrest (cluster-arrest). The lymph nodes were then classified into three categories based on the type of movement pattern present: swarming plus clustering and arrest; swarming without clustering and arrest; or no swarming or clustering and arrest. The percentage of lymph nodes in each category is in parentheses.
Aside from the absence of endogenous Treg cells, it was possible that the absence of B7 binding by NOD.Cd28−/− T cells may have allowed more accessibility of the adoptively transferred T cells to B7-bearing antigen-presenting cells (APCs) than in the NOD mice. This might have led to the increased signaling and subsequent cellular arrest. To address that possibility, we analyzed the movement dynamics of BDC2.5 CD4+CD25− TH cells in the NOD mice deficient in both B7-1 (CD80) and B7-2 (CD86). These mice have a Treg cell deficiency similar to that in NOD.Cd28−/− mice but do not have the confounding issue of higher B7 availability. The BDC2.5 CD4+CD25− TH cells swarmed and arrested as noted in the NOD.Cd28−/− mice (Fig. 2d, Table 1 and Supplementary Video 4 online).
To further quantify the various patterns of movement, we measured the velocities of the cells in the inguinal and pancreatic lymph nodes of NOD and NOD.Cd28−/− recipients. We injected cells into NOD and NOD.Cd28−/− mice and monitored movement at various time points after transfer. We tracked the movements of free-moving cells in inguinal lymph nodes, swarming cells in pancreatic lymph nodes of NOD recipients and static, clustering cells in pancreatic lymph nodes of NOD.Cd28−/− recipients for 10–30 min and calculated their average velocities (Fig. 3a). Cells in the inguinal lymph nodes had the highest velocities, averaging 8 μm/min, which remained constant at the 18- and 24-hour time points. In the pancreatic lymph nodes, we found no CD4+CD25− TH cell swarming before the 18-hour time point. The swarming cells had slightly lower velocities, averaging 6 μm/min, which did not change much in the 18- to 30-hour time frame. The cells in static clusters in NOD.Cd28−/− hosts had the lowest velocities. At 12 h after transfer, the average velocity for clustering cells was 3.5 μm/min, which was reduced further to 1 μm/min, and returned to 3 μm/min by 24 h after transfer.
Figure 3.

Quantitative characterization of movement dynamics of BDC2.5 CD4+CD25− TH cells. Movements of individual cells in the inguinal and pancreatic lymph nodes were tracked for 10–30 min as described in Figure 2. The average velocity and 10-min displacement (distance from the origin at time 0) for each cell was calculated and plotted. Each circle represents one cell; horizontal lines indicate the mean of the group. (a) Velocities of free-moving BDC2.5 CD4+CD25− TH cells in NOD inguinal lymph nodes (NOD ing), swarming cells in NOD pancreatic lymph nodes (NOD pan swarm) and clustering and arrested cells in Cd28−/− pancreatic lymph nodes (NOD.Cd28−/− pan cluster), determined at various times after cell transfer. (b) Velocities of BDC2.5 CD4+CD25− TH cells showing various movement patterns (free, swarm, cluster) in inguinal (Ing) and pancreatic (Pan) lymph nodes at 18 h after cell transfer. Velocities for the NOD.Cd28−/− and NOD.Cd80−/−Cd86−/− clustering cells are significantly lower than for all other groups (P < 0.001) but are not significantly different from each other (P > 0.05). Velocities of the swarming cells in the NOD pancreatic lymph node are not significantly different from those of the free-moving cells (P > 0.05) but are significantly higher than those of the clustering cells in the NOD.Cd28−/− and NOD.Cd80−/−Cd86−/− groups (P < 0.001). (c) Ten-minute displacement of the BDC2.5 CD4+CD25− TH cells in b. Displacement values for the swarming cells in the NOD pancreatic lymph nodes and the clustering cells in the NOD.Cd28−/− and NOD.Cd80−/−Cd86−/− mice are significantly lower than those of all other groups (P < 0.001) but are not significantly different from each other (P > 0.05). No other comparisons showed statistically significant differences. Data are pooled from multiple experiments.
As the antigen-specific arrest in the NOD.Cd28−/− host was greatest at 18 h after cell transfer, we expanded the analysis at that time point to compare the movement patterns in various settings. In both NOD and NOD.Cd28−/− recipients, cells in the inguinal lymph nodes had the highest average velocities (Fig. 3b) and displacement in a 10-minute period (Fig. 3c). Free-moving cells in pancreatic lymph nodes of both NOD mice (Fig. 3b,c) and NOD.Cd28−/− mice (data not shown) had velocities and displacement similar to those in inguinal lymph nodes. Although the movement of the swarming cells was confined, their velocity was similar to that of the free-moving cells in pancreatic lymph nodes, consistent with their highly dynamic movement pattern. However, the 10-minute displacement values of the swarming cells were significantly lower than those of the free-moving cells (P <0.001) and were similar to those of the arrested cells in the pancreatic lymph nodes of the NOD.Cd28−/− recipients, which had the lowest velocities and 10-minute displacement values (Fig. 3b,c). Furthermore, the velocity and 10-minute displacement values of the CD4+CD25− TH cells in the NOD.Cd80−/−Cd86−/− mice were statistically identical to those in the NOD.Cd28−/− hosts (P > 0.05; Fig. 3b,c). Thus, in contrast to activation in Treg cell–sufficient prediabetic NOD mice, CD4+CD25− TH cell activation in prediabetic Treg cell–deficient NOD.Cd28−/− and NOD.Cd80−/−Cd86−/− mice was characterized by static clustering and dynamic swarming in the pancreatic lymph node, correlating with robust proliferation. These results suggest that the presence of endogenous Treg cells in prediabetic NOD mice controls the activation of autoreactive T cells at a very early stage and prevents them from forming stable interactions with APCs.
To determine if the lack of cell arrest and reduced swarming in prediabetic NOD mice was due to the presence of more endogenous Treg cells in NOD mice, we reconstituted NOD.Cd28−/− mice with NOD polyclonal Treg cells (as described for Fig. 1b). Then, 3 weeks after the Treg cell reconstitution, we assessed the movement dynamics of BDC2.5 CD4+CD25− TH cells in the pancreatic lymph nodes of these mice using TPLSM. We found only swarming and no cell arrest or static clustering in the NOD.Cd28−/− mice reconstituted with Treg cells, resembling the phenotype of NOD mice (Fig. 4a and Supplementary Video 5 online). Thus, the difference in the CD4+CD25− TH cell movement dynamics in the pancreatic lymph nodes of NOD versus NOD.Cd28−/− mice can be attributed to the different numbers of Treg cells present in these mice.
Figure 4.
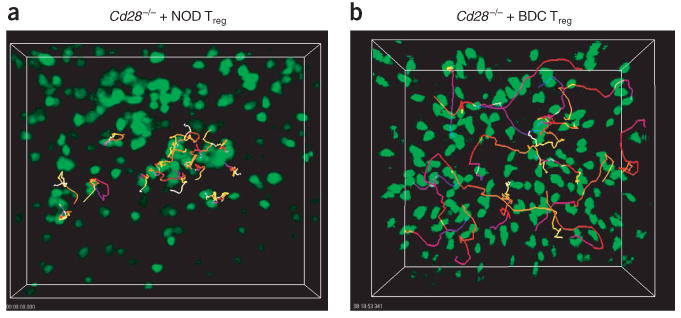
Treg cells alter the movement dynamics of BDC2.5 CD4+CD25− TH cells in explanted lymph nodes. BDC2.5 CD4+CD25− TH cell movement in NOD.Cd28−/− mice reconstituted with NOD Treg cells (a) or BDC2.5 Treg cells (b). Pancreatic lymph nodes were collected for imaging between 12 and 24 h after transfer of CFSE-labeled BDC2.5 CD4+CD25− TH cells. Time-lapse images were collected at 30-second intervals for 30 min and the positions of individual cells over time were identified with Imaris tracking software. Trajectories of selected cells are ‘color-coded’ to indicate time progression from the beginning (blue) to the middle (red) to the end (yellow) of imaging. Data are representative of two (a) or three or more (b) independent experiments.
To assess the activity of autoreactive CD4+CD25− TH cells in the presence of large numbers of islet antigen–specific Treg cells, a setting in which proliferation was completely blocked, we compared movement dynamics of BDC2.5 CD4+CD25− TH cells in NOD and NOD.Cd28−/− recipients with and without prior transfer of expanded BDC2.5 Treg cell populations. We transferred cultured BDC2.5 Treg cells into NOD or NOD.Cd28−/− hosts 1–2 d before transfer of CFSE-labeled BDC2.5 CD4+CD25− TH cells. We removed pancreatic and inguinal lymph nodes 12–24 h later for TPLSM imaging. Notably, preseeding BDC2.5 Treg cells completely abolished both cell arrest and swarming of BDC2.5 CD4+CD25− TH cells in the pancreatic lymph nodes of all NOD and NOD.Cd28−/− mice examined (Fig. 4b, Table 1 and Supplementary Video 6 online). The activity of BDC2.5 CD4+CD25− TH cells in the pancreatic lymph nodes of these mice was indistinguishable from that noted in the inguinal lymph nodes in the absence of antigen. It was possible that the in vitro activation and population expansion of the Treg cells before transfer enabled the Treg cells to compete more effectively for limited antigen in vivo. To address that issue, we determined whether the response of in vitro–expanded BDC CD4+CD25− TH cell populations could be controlled by Treg cells. The expanded CD4+CD25− TH cell populations swarmed and arrested at the same rate as freshly isolated CD4+CD25− TH cells in the pancreatic lymph nodes of NOD and NOD.Cd28−/− recipients, respectively (data not shown). Moreover, the functional activity of the expanded CD4+CD25− TH cell populations was controlled equally well by the BDC2.5 Treg cells (data not shown). These results demonstrate that static cluster formation and dynamic swarming by antigen-specific BDC2.5 CD4+CD25− TH cells occurs only in the islet-antigen draining lymph nodes and can be completely abrogated by increasing the frequency of islet antigen–specific Treg cells.
TH cell and Treg cell homing
To further investigate the factors regulating the initial activation of autoreactive TH cells and how the process is controlled by Treg cells, we examined the anatomic location of CD4+CD25− TH cell activation and their encounter with Treg cells in pancreatic lymph nodes. We labeled freshly purified BDC2.5 CD4+CD25− TH cells and expanded BDC2.5 Treg cell populations with CFSE and transferred the cells into separate prediabetic NOD.Cd28−/− mice. We killed the recipient mice 12 h after cell transfer and examined the distribution of CFSE+ cells in pancreatic and inguinal lymph node sections by immunohistochemistry. We stained B cells in the lymph node sections with antibody to B220 (anti-B220) to delineate the T cell and B cell zones. In the absence of antigen in the inguinal lymph node, both BDC2.5 Treg cells and CD4+CD25− TH cells homed to the paracortical T cell zone and showed a random distribution (Fig. 5a,b) similar to that noted with expanded polyclonal Treg and CD4+CD25− TH cell populations (data not shown). In contrast, in the pancreatic lymph node, BDC2.5 Treg and CD4+CD25− TH cells aggregated at the T cell–B cell boundary (Fig. 5c,d). Similar analysis of prediabetic NOD recipients provided comparable results (data not shown). These findings demonstrate that Treg cells and CD4+CD25− TH cells respond similarly to lymph node–homing cues and migrate to the T cell area. Our results further suggest that in the presence of antigen, both cell types are retained at the T cell–B cell boundary and are probably activated by antigen-bearing APCs present in this region. These results suggest that the APCs present at the T cell–B cell boundary are important for the activation of CD4+CD25− TH cells and Treg cells and raise the possibility that CD4+CD25− TH cells and Treg cells may interact directly in this region during suppression.
Figure 5.
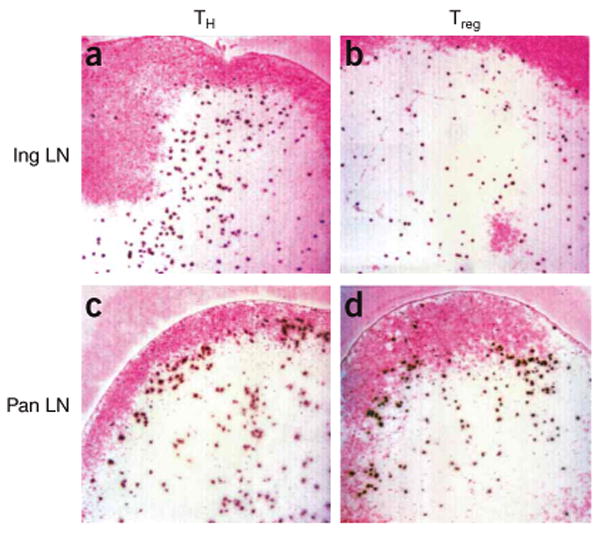
Autoreactive CD4+CD25− TH cells and Treg cells from BDC2.5 mice home to the T cell zone and preferentially accumulate at the T cell–B cell boundary in the presence of autoantigen. CFSE-labeled BDC2.5 CD4+CD25− TH cells (a,c) and Treg cells (b,d) were transferred into NOD.Cd28−/− mice and the distribution of the transferred cells in inguinal lymph nodes (a,b) and pancreatic lymph nodes (c,d) was analyzed by immunohistochemistry 12 h later. B cell zones were labeled with anti-B220 staining and were developed with Fast Red (pink). Transferred cells were identified with anti-fluorescein developed with diaminobenzidine (dark brown). Results are representative of at least four mice in each group from independent experiments.
Lack of stable TH cell–Treg cell interactions
In vitro studies have shown that Treg cell suppression requires cell-cell contact that can be mediated by direct T cell–T cell interactions between CD4+CD25− TH cells and Treg cells16. To directly examine the interactions between Treg cells and CD4+CD25− TH cells during in vivo suppression, we labeled expanded BDC2.5 Treg cell populations with the orange dye CMTMR (chloromethyl benzoyl amino tetramethylrhodamine) and transferred the cells into NOD.Cd28−/− mice 2 d before injecting CFSE-labeled BDC2.5 CD4+CD25− TH cells. We monitored the interaction between the two cell types using TPLSM between 12 and 24 h after transfer of the CD4+CD25− TH cells, as inhibition of swarming and cell arrest occurred during this time period. Single-time-point images showed that both CMTMR-labeled Treg cells and CFSE-labeled CD4+CD25− TH cells were present in similar areas of the pancreatic lymph node (Supplementary Fig. 1 online). The presence of Treg cells prevented the swarming and arrest of CD4+CD25− TH cells, correlating with functional results demonstrating active suppression (Fig. 1). These images showed that most CD4+CD25− TH cells and Treg cells were not in contact with each other at this time, and only a few seemed to be aggregating together (Supplementary Fig. 1 online). Time-lapse imaging showed that none of these interactions were stable and cells disassociated within minutes (Fig. 6a and Supplementary Video 7 online). To quantitatively assess the aggregation time between Treg cells and CD4+CD25− TH cells, we randomly selected 102 pairs of Treg and CD4+CD25− TH cells that seemed to be associated together and measured the duration of their contact. We compared the association time of Treg cell–TH cell pairs in the pancreatic lymph node, where TH cell activation was suppressed by Treg cells, and in the inguinal lymph node, where the Treg cell and CD4+CD25− TH cell associations were random with no activation or suppression. Such analysis showed that 95% of the Treg cell–TH cell pairs in the pancreatic lymph node disassociated within 2.5 min and that most of the cells paired for less than 1 min, an even shorter duration than the random association of Treg cells and CD4+CD25− TH cells the inguinal lymph node (Fig. 6b). We obtained similar results in NOD and NOD.Cd28−/− recipients at 12, 18 and 24 h after CD4+CD25− TH cell transfer. Thus, in vivo suppression of CD4+CD25− TH cell priming by cells is not associated with stable interaction between the CD4+CD25− TH cell and Treg cell types.
Figure 6.
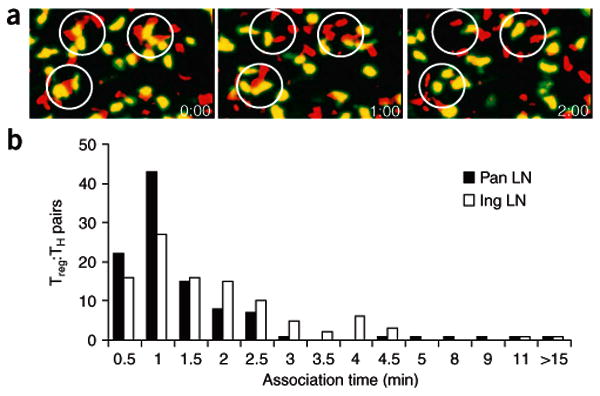
In vivo suppression by Treg cells is not associated with stable Treg cell–TH cell interactions. CFSE-labeled BDC2.5 CD4+CD25− TH cells were transferred into NOD.Cd28−/− mice 48 h after injection of CMTMR-labeled BDC2.5 Treg cells, and the movement of both cell types in explanted pancreatic and inguinal lymph nodes was monitored by time-lapse imaging with TPLSM 24 h after transfer of CD4+CD25− TH cells. (a) Time-lapse images of BDC2.5 CD4+CD25− TH cells (yellowish green) and Treg cells (red) in pancreatic lymph nodes, with Treg cell–TH cell aggregation circled at the beginning of imaging (time is in minutes:seconds). (b) Association time of 102 randomly selected Treg cell–TH cell pairs in pancreatic (filled symbols) and inguinal (open symbol) lymph nodes; numbers of pairs with various aggregation time are plotted. Data are representative of one of three independent experiments.
TH cells and Treg cells interact with DCs
The T cell–B cell boundaries near the high endothelial venules are enriched for tissue-emigrant DCs, poised to scan and stimulate newly arrived T cells26,27. The accumulation of CD4+CD25− TH cells and Treg cells at the T cell–B cell boundary suggested that the cells were being activated by these DCs. To directly examine the dynamic interaction of BDC2.5 CD4+CD25− TH cells and Treg cells with autoantigen-bearing DCs in the pancreatic lymph node, we developed a new approach to visualize endogenous islet antigen–bearing DCs. We backcrossed mice carrying an enhanced green fluorescent protein transgene under control of the mouse insulin I promoter30 (called ‘MIP.GFP mice’ here) with NOD mice. We analyzed by flow cytometry cells in the islet-draining pancreatic lymph nodes of these mice. GFP+ cells were readily detectable in the pancreatic lymph nodes of MIP.GFP mice (Fig. 7a, top left) but not in the inguinal lymph nodes of these mice (Fig. 7a, top middle) or in nontransgenic littermates (Fig. 7a, top right). Further analysis showed that 70–95% of these cells were CD11c+ CD8− DCs with variable CD11b expression (Fig. 7b and Table 2). The CD8+ and CD11b+ DC subpopulations were equally represented in the CD11c+GFP− populations in MIP.GFP mice and nontransgenic littermates, demonstrating normal DC development in these mice (data not shown). In addition, expression of GFP in the B220+CD11c+ plasmacytoid DCs was not detectable (data not shown). The numbers of GFP+ DCs detected in each pancreatic lymph node ranged from 20 to 300 and represented 0.3–10% of CD11c+ cells in the lymph node.
Figure 7.
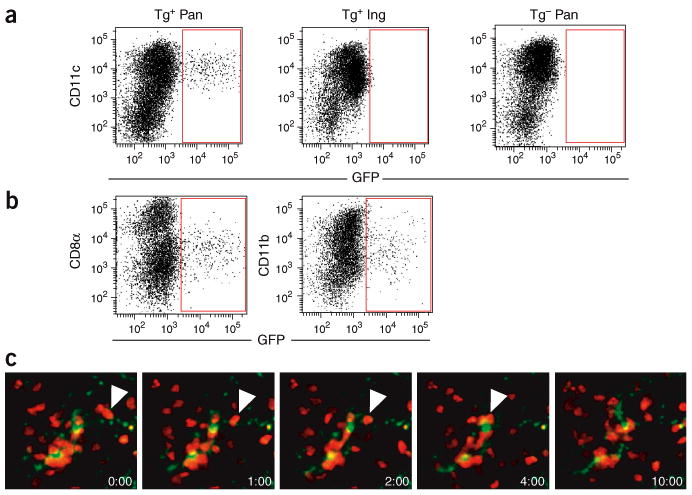
Islet antigen–bearing DCs form stable interaction with BDC2.5 CD4+CD25− TH cells. (a,b) Flow cytometry of CD11c and GFP expression on CD3−B220− propidium iodide–negative (PI−) cells in the pancreatic and inguinal lymph nodes of MIP.GFP mice (Tg+) and nontransgenic littermates (Tg−). (b) Phenotypic analysis of GFP+ cells in the pancreatic lymph nodes of MIP.GFP mice. Dot plots show CD8α, CD11b and GFP expression on CD3−B220−PI−CD11c+ cells. Results in a,b are representative of 19 MIP.GFP mice and 5 nontransgenic littermates. (c) Time-lapse images of GFP+ DCs (yellowish green) and CMTMR-labeled BDC2.5 CD4+CD25− TH cells (red) in the pancreatic lymph nodes of a NOD.MIP.GFP mouse 24 h after cell injection (time is in minutes:seconds). Each image in the sequence is generated by the projection of ten images spanning 20 μm in the ‘z’ direction 168–188 μm beneath the lymph node surface. White arrowheads indicate a BDC2.5 CD4+CD25− TH cell migrating along a thin dendrite of a GFP+ DC, ending by aggregating with other CD4+CD25− TH cells near the DC cell body at the 4-minute time point.
Table 2. GFP+ cells in the pancreatic lymph nodes of MIP.GFP mice.
| Cell type | 1 | 2 | 3 |
|---|---|---|---|
| CD11c+B220− | 80% | 95% | 72% |
| CD11c−B220+ | ND | 0 | 16% |
| CD11c+B220+ | ND | 0 | 0 |
| CD11c−B220− | ND | 5% | 12% |
Data represent the average percentage of cells expressing CD11c and B220 markers among cells in the CD3−GFP+ gate in three experiments (1, 2, 3).
To visualize the interaction of islet-reactive T cells with these DCs, we transferred CMTMR-labeled BDC2.5 CD4+CD25− TH cells into MIP.GFP mice and imaged the pancreatic lymph nodes with TPLSM. GFP+ cells were readily visualized in the pancreatic lymph nodes between 50 and 200 μm beneath the capsule of the lymph node, with brightly fluorescent cell bodies and, in some cases, faintly labeled dendrites. Some GFP+ cells aggregated together with the transferred CMTMR-labeled BDC2.5 TH cells (Fig. 7c and Supplementary Video 8 online). Time-lapse images showed that the interactions of the BDC2.5 CD4+CD25− TH cells with the GFP+ DCs were dynamic. The DCs actively moved their dendrites, whereas T cells aggregated and crawled along the surfaces of the DCs. The interactions persisted through out the 15- to 30-minute imaging period. The interaction between BDC2.5 CD4+CD25− TH cells and endogenous DCs presenting autoantigens resembled those reported for T cells responding to exogenously administered peptides presented by activated DCs22,24.
To determine if BDC2.5 Treg cells interacted with islet antigen–bearing DCs in vivo, we next analyzed the activity of these Treg cells in the lymph nodes. We transferred CFSE-labeled BDC2.5 Treg cells into NOD and NOD.Cd28−/− mice and imaged the cells 24 and 12 h later, respectively. In the pancreatic lymph node, BDC2.5 Treg cells arrested and formed static clusters in the NOD.Cd28−/− recipients and swarmed in NOD recipients (Fig. 8a,b and Supplementary Videos 9 and 10 online). The frequencies of static clustering and swarming activities of Treg cells were similar to those noted for the BDC2.5 CD4+CD25− TH cells (Table 1). Moreover, the pattern of their movement and velocity were almost identical to those of TH cells (data not shown). BDC2.5 Treg cells were highly motile with no evidence of aggregation in the inguinal lymph nodes of either mouse strain. To determine whether the Treg cells interacted with islet antigen–bearing DCs, we transferred CMTMR-labeled BDC2.5 Treg cells into MIP.GFP mice and imaged pancreatic lymph nodes 24 h later. The BDC2.5 Treg cells swarmed in the MIP.GFP mice, as noted in NOD recipients. Some of the swarms localized together with GFP+ DCs (Fig. 8c and Supplementary Video 11 online). The interactions of BDC2.5 Treg cells with DCs were indistinguishable from those noted for the CD4+CD25− TH cells. Thus, both CD4+CD25− TH cells and Treg cells stably interact with islet antigen–bearing DCs in the pancreatic lymph node. However, whereas the CD4+CD25− TH cell–DC engagement led to proliferation and differentiation and the eventual generation of pathogenic effector cells, Treg cell–DC interactions resulted in the suppression of CD4+CD25− TH cell priming and the prevention of autoimmune diabetes.
Figure 8.
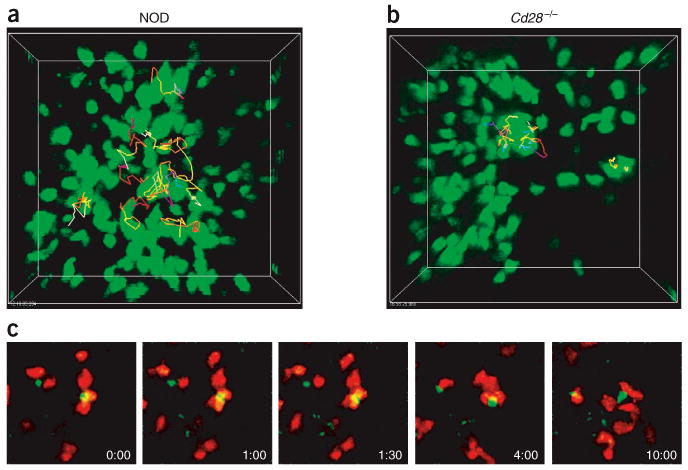
BDC2.5 Treg cells stably interact with islet antigen–bearing DCs. (a,b) Movement dynamics of BDC2.5 Treg cells in the pancreatic lymph nodes of NOD mice (a) and NOD.Cd28−/− mice (b), monitored as described for CD4+CD25− TH cells in Figure 2. (c) Time-lapse images of CMTMR-labeled BDC2.5 Treg cells (red) swarming around GFP+ DCs (yellowish green) in the pancreatic lymph nodes of NOD.MIP.GFP mice 24 h after cell injection (time is in minutes:seconds). Each image in the sequence is generated by the projection of eight images spanning 24 μm in the ‘z’ direction 155–180 μm beneath the surface of the lymph node. Data are representative of three or more experiments.
Discussion
Here we have analyzed the Treg cell control of autoreactive CD4+CD25− TH cell activation in the lymph nodes of NOD mice. Our results have shown that increasing numbers of antigen-specific Treg cells progressively inhibited CD4+CD25− TH cell priming, correlating with changes in the pattern of CD4+CD25− TH cell movement dynamics within the first 24 h after entry into the lymph node. CD4+CD25− TH cells and Treg cells homed to similar areas of the lymph nodes and their movement patterns were indistinguishable from each other. Moreover, at the time when CD4+CD25− TH cell priming was actively suppressed, we found no stable interactions between Treg cells and CD4+CD25− TH cells. In contrast, Treg cells formed long-lasting conjugates with islet antigen–bearing DCs, and such engagement preceded the inhibition of CD4+CD25− TH cell activation.
The patterns of T cell activity during early activation reported so far have been drawn from experiments in which antigens are administered in adjuvant or are presented by adoptively transferred, antigen-pulsed mature DCs, which resemble the process of T cell activation by foreign antigens during infection21–25. Those studies have defined multiple phases of T cell activation characterized by stochastic contacts of rapidly moving T cells with DCs, repeated transient interactions with DCs, stable T cell–DC conjugate formation, dissociation from DCs and, finally, resumption of free movement followed by the onset of proliferation. Those phases correspond with distinct movement patterns of T cells, including rapid motility, dynamic swarming and static clustering. We found that the movement patterns of BDC2.5 T cells activated by an autoantigen in the Treg cell–deficient NOD.Cd28−/− mice were very similar to those described in the literature. With increasing numbers of islet-specific Treg cells, both static clusters and dynamic swarms were completely abolished in both NOD mice and NOD.Cd28−/− mice. Notably, such graded changes in dynamic activity were accompanied by progressive decreases in T cell activation and proliferation.
The functional importance of repeated transient DC engagement (swarming) and stable conjugate formation (static clustering) is a subject of ongoing debate and investigation31–35. With advancements in in vivo imaging technology, increasing numbers of in vivo experiments have suggested that long-lasting conjugation with DCs precedes productive T cell activation21–25. Those reports have suggested that swarming and transient interactions between T cells and DC may sensitize naive T cells and/or DCs before stable conjugation. Our analysis has shown that although autoreactive T cells responding to an endogenous antigen in the NOD.Cd28−/− mice underwent both static clustering and swarming, static clustering was almost completely absent in the NOD recipients. The lack of cell arrest was not due to differences in activation kinetics in NOD versus NOD.Cd28−/− mice. Moreover, reconstitution of NOD.Cd28−/− mice with NOD Treg cells abolished CD4+CD25− TH cell arrest but preserved swarming activity. Those results suggested that the resident Treg cells in NOD mice prohibited static cluster formation, leading to reduced T cell priming. Concurrent transfer of Treg cells and TH cells did not inhibit proliferation of the CD4+CD25− TH cells, but instead blocked their differentiation. Thus, coinjected Treg cells may not affect the frequency of swarming activities but may limit the total duration of T cell swarming, thus preventing their differentiation.
Overall, our results support the idea that persistent T cell–APC engagement is necessary for productive activation and differentiation of autoreactive T cells. The difference between static clustering and swarming may represent a distinct threshold of T cell activation that is set by the balance of activation stimuli and endogenous regulatory mechanisms. T cell swarming in the absence of cell arrest has not been reported before, to our knowledge. This may be because the frequency of resident Treg cells specific for foreign antigens such as ovalbumin used in published studies is lower than that for self antigens36, making it less likely to observe the effects of resident Treg cells. Finally, strong inflammatory stimuli such as adjuvant and proinflammatory cytokines used in those studies may override endogenous regulatory mechanisms.
Comparison of Treg cell activity with that of the CD4+CD25− TH cells demonstrated notable similarities. Treg cells homed to the T cell zone in the lymph node and congregated at the T cell–B cell boundary during activation by autoantigens in a way indistinguishable from that of CD4+CD25− TH cells. Both cell types arrested and swarmed with similar frequencies and kinetics in the presence of antigen and both scanned lymph node with similar velocity in the absence of antigen in nondraining lymph nodes. We have noted that a small number of polyclonal Treg cells transferred into the NOD.Cd28−/− mice clustered at the T cell–B cell boundary in the pancreatic but not inguinal lymph nodes, supporting the idea that the regulation of cell arrest was dependent on activation of antigen-specific Treg cells present in the polyclonal population (data not shown). These results collectively suggest that the distinct functions of these two cell types is probably due to the differences in their gene expression programs after TCR activation.
Cumulative experimental evidence points to DCs as the driving force in shaping the immune response. Although mature, activated DCs induce T cell activation, immature DCs maintain self-tolerance in the steady state37. Thus, understanding DC homeostasis is important for deciphering the pathogenesis of autoimmune diseases such as type I diabetes. Here we developed a reporter mouse to examine the endogenous antigen–bearing DCs in the NOD model of type I diabetes. NOD.MIP.GFP mice had many GFP+ DCs in the pancreatic lymph nodes but not in other lymph nodes. In the steady state, between 0.3% and 10% of CD11c+ cells in the pancreatic lymph nodes of NOD mice were GFP+. It is likely that the actual frequencies of islet antigen–bearing DCs were higher, as GFP is degraded by the DC antigen-processing machinery and becomes undetectable over time. The subcellular distribution pattern is consistent with that described for gastric H+-K+ APTase–bearing DCs in an autoimmune gastritis model system, in which the DCs are juxtaposed to parietal cells in the gastric mucosa and carry engulfed H+-K+ APTase to the gastric lymph nodes38. Indeed, our TPLSM analysis has shown that these GFP+ DCs conjugated with islet antigen–specific BDC2.5 CD4+CD25− TH cells and Treg cells, demonstrating that the GFP-tagged DCs are actively presenting islet antigens in the draining lymph nodes of prediabetic mice.
The molecular and cellular basis of Treg cell–mediated suppression is unclear. Some in vitro assays have shown that suppression is mediated either by short-acting suppressor molecules or by membrane-bound molecules through repeated or prolonged contact between Treg cells and responders9,16. Our in vivo imaging results did not demonstrate either transient repeated contact or stable interactions between CD4+CD25− TH cells and Treg cells when CD4+CD25− TH cell priming was actively suppressed. In contrast, Treg cells formed long-lasting conjugates with DCs soon after arriving in the lymph node, thereby preventing clustering of DCs and CD4+CD25− TH cells that entered the lymph node at later time points. Those observations are consistent with the interpretation that Treg cells can directly inactivate DCs or that DC-activated Treg cells produce soluble mediators that prevent CD4+CD25− TH cell interaction with DCs. Preactivated NOD Treg cells cannot suppress the proliferation of CD8+ T cells from 8.3 TCR-transgenic mice stimulated with major histocompatibility complex–peptide monomers in the absence of APCs in vitro, suggesting that Treg cell suppression is mediated through DCs39. In support of that idea, activated Treg cells suppress the maturation of bone marrow–derived DCs in vitro, suggesting NOD Treg cells can directly target DCs to inhibit their functions39.
In conclusion, we propose that in the steady state, self antigen–specific Treg cells are constantly being activated by tissue-derived DCs, preventing the priming of autoreactive pathogenic cells. It will be important to further understand how Treg cells alter the functions of DCs and autoreactive T cells to safeguard self-tolerance and to determine how the failure of these mechanisms contributes to the development of autoimmunity. The system established here is thus poised to help delineate the in vivo mechanisms of Treg cell function in the control of autoimmune diabetes.
Methods
Mice
All mice were housed and bred in specific pathogen–free conditions at the Animal Barrier Facility of the University of California, San Francisco. C57BL/6.MIP.GFP mice obtained from G. Bell (University of Chicago, Chicago, Illinois) were backcrossed three to five generations to NOD mice. Yeti mice on a NOD background were used to generate the NOD.BDC2.5.Thy-1.1.Yeti mice. All animal experiments were approved by the Institutional Animal Care and Use Committee of the University of California, San Francisco.
Antibodies and other reagents
These studies used fluorescein isothiocyanate–conjugated monoclonal anti-CD4 (GK1.5) and biotin-conjugated monoclonal anti-CD11c (N418; produced in our lab); phycoerythrin-labeled monoclonal anti-CD25 (7D4) purchased from Southern Biotechnology Associates; and phycoerythrin-labeled anti-CD11b (M1/70), peridinin chlorophyll protein complex–labeled anti-CD3 (145-2C11), anti-B220 (RA3-6B2), allophycocyanin-labeled monoclonal antibodies to CD4 (RM4-5), to CD8 (53-6.7) and to CD62L (Mel-14), and streptavidin-allophycocyanin-indotricarbocyanine purchased from BD PharMingen or eBioscience. CFSE and CMTMR were purchased from Molecular Probes.
Adoptive transfer
For in vivo proliferation assays, lymph node samples were depleted of CD25+ cells by sequential incubation with anti-CD25 (clone 7D4 in culture supernatant) and complement, followed by Ficoll density-gradient centrifugation for removal of dead cells. The cells were then labeled with 2.5 μM CFSE, and 1 × 10⁶ cells were transferred into recipient mice by retro-orbital injection. Recipient mice were killed on day 4 after cell transfer and the dilution of CFSE in inguinal lymph node and pancreatic lymph node cell preparations was determined by flow cytometry. For induction of diabetes in NOD.Rag1−/− mice, CD25− cells from 4.1 TCR-transgenic mice were isolated from lymph nodes and spleens as described above and were stimulated for 3 d with plate-bound anti-CD3 (10 μg/ml) and anti-CD28 (1 μg/ml). Cells were then removed from the plate, followed by incubation for 7 d in medium containing human recombinant interleukin 2 (100 IU/ml). Viable CD4+ cells (4 × 10⁶ to 5 × 10⁶) were transferred into NOD.Rag1−/− recipient mice alone or together with equal numbers of BDC2.5 Treg cells. For TPLSM analysis, BDC2.5 CD4+CD25− TH cells were either freshly purified or their populations were expanded in vitro7,8. Cells were labeled with 5 μM CFSE before retro-orbital injection into prediabetic NOD or NOD.Cd28−/− recipient mice (3.5 × 10⁶ to 5 × 10⁶ cells/mouse). In some experiments, 3.5 × 10⁶ to 5 × 10⁶ unlabeled or CMTMR-labeled (20 μM) Treg cells were injected 1–2 d before the introduction of CFSE-labeled CD4+CD25− TH cells.
Flow cytometry
For in vivo CFSE dilution, inguinal and pancreatic lymph node cell preparations were labeled with anti-CD62L–phycoerythrin, anti-CD4–peridinin chlorophyll protein or allophycocyanin-indotricarbocyanine, and anti-Thy-1.1–allophycocyanin, and 0.5 × 10⁶ cells in the CD4 gate were acquired. For analysis of DCs in NOD.MIP.GFP mice, inguinal and pancreatic lymph nodes were disassociated by ‘teasing’ with a surgical scalpel followed by 20 min of digestion in collagenase D (100 U/ml in Hank's balanced-salt solution; Boehringer Mannheim). Cells were then labeled with biotinylated anti-CD11c, followed by streptavidin-allophycocyanin-indotricarbocyanine, anti-CD11b–phycoerythrin, anti-CD3 and anti-B220–peridinin chlorophyll protein and anti-CD8–allophycocyanin. Just before data acquisition on a flow cytometer, propidium iodine was added to a final concentration of 1 μg/ml. For analysis of GFP+ cells, lymph node cells were stained with anti-CD11c–biotin plus streptavidin-allophycocyanin-indotricarbocyanine, anti-B220–phycoerythrin, anti-CD3–peridinin chlorophyll protein and anti-CD8–allophycocyanin. GFP expression in the B220+CD3−CD11c− propidium iodine–negative or B220−CD3−CD11c+ propidium iodine–negative gate was analyzed with a FACSCalibur and CELLQuest software or an LSRII flow cytometer and FACSDiva software (Becton Dickinson).
TPLSM acquisition
A custom resonant-scanning instrument based on published designs40 containing a four–photomultiplier tube operating at video rate was used for two-photon microscopy. For imaging of islet-specific T cells in NOD mice, inguinal and pancreatic lymph nodes were immobilized on coverslips with the hilum facing away from the objective. Lymph nodes were maintained at 36 °C in RPMI medium bubbled with 95% O2 and 5% CO2 and were imaged through the capsule distal to the hilum. Samples were excited with a 5-W MaiTai TiSaphire laser tuned to a wavelength of 810 nm, and emission wavelengths of 500–540 nm (for CFSE and GFP), 567–640 nm (for CMTMR) and 380–420 nm (for detection of second-harmonic emission) were collected. A custom four-dimensional acquisition module in the VideoSavant digital video recording software (IO Industries) was used for image acquisition. Each lymph node was first surveyed for the presence of transferred cells. Adjacent z-stacks of up to 350 μm encompassing the top xy space of the entire lymph node were collected. For time-lapse image acquisition, each xy plane spanned 330 μm × 230 μm at a resolution of 0.6 μm per pixel, and ten video-rate frames were averaged, giving effective collection times of approximately 330 ms per image. Images of up to 50 xy planes with 2- to 5-μm z-spacing were acquired every 20, 30 or 60 s for 15–60 min.
TPLSM data analysis
Imaris (Bitplane) or Metamorph (Universal Imaging) was used for image analysis and three-dimensional tracking. The cell migration tracks generated by Imaris software were individually inspected to ensure accuracy in cell tracking. The verified tracks that were as least 5 min in duration were used to calculate the velocity of the cells in various categories. Statistical analysis of the data was done with Prizm Graphpad 3.0 software. Nonpara-metric one-way analysis of variance with Bonferroni's post-test was done to assess the significance of the differences among various groups of cells.
Immunohistochemistry
BDC2.5 CD4+CD25− TH cells and Treg cells were labeled with CFSE and were transferred into NOD.Cd28−/− mice separately. Pancreatic and inguinal lymph nodes were collected and were frozen in optimum cutting temperature compound (Tissue-Tek); cryosections 6 μm in thickness were prepared, were fixed in acetone and were incubated with biotin-conjugated anti-B220 (BD PharMingen) and horseradish peroxidase–conjugated anti-fluorescein (Roche), followed by streptavidin-conjugated alkaline phosphatase (DakoCytomation). Anti-B220 staining was developed with the alkaline phosphatase substrate FastRed (DakoCytomation) and anti-fluorescein staining was developed with the horseradish peroxidase substrate diaminobenzidine (DakoCytomation). Sections were dehydrated and mounted with Ultramount (DakoCytomation).
Supplementary Material
Acknowledgments
We thank S. Jiang, C. McArthur, C. Bennett, R.A. Hwang, F. Siedenberg, L. Braun, J. Belgum, S. Hayden, M. Sanderson and M. Bengttson for technical assistance, and members of the Bluestone laboratory for support. Supported by the Juvenile Diabetes Research Foundation (4-1999-841 and 32004232), National Insitutes of Health (R37 AI46643, P30 DK063720, R21 AI066097 and AI30663), Sandler–Howard Hughes Medical Institute Biomedical Research Support Program (5300246), Sandler New Technologies and the Canadian Institutes of Health Research and Alberta Heritage Foundation for Medical Research.
Footnotes
Note: Supplementary information is available on the Nature Immunology website.
COMPETING INTERESTS STATEMENT: The authors declare that they have no competing financial interests.
Reprints and permissions information is available online at http://npg.nature.com/reprintsandpermissions/
References
- 1.Sakaguchi S. Naturally arising Foxp3-expressing CD25+CD4+ regulatory T cells in immunological tolerance to self and non-self. Nat Immunol. 2005;6:345–352. doi: 10.1038/ni1178. [DOI] [PubMed] [Google Scholar]
- 2.Chatenoud L, Salomon B, Bluestone JA. Suppressor T cells–they're back and critical for regulation of autoimmunity! Immunol Rev. 2001;182:149–163. doi: 10.1034/j.1600-065x.2001.1820112.x. [DOI] [PubMed] [Google Scholar]
- 3.Wood KJ, Sakaguchi S. Regulatory T cells in transplantation tolerance. Nat Rev Immunol. 2003;3:199–210. doi: 10.1038/nri1027. [DOI] [PubMed] [Google Scholar]
- 4.Singh B, et al. Control of intestinal inflammation by regulatory T cells. Immunol Rev. 2001;182:190–200. doi: 10.1034/j.1600-065x.2001.1820115.x. [DOI] [PubMed] [Google Scholar]
- 5.Curotto de Lafaille MA, Lafaille JJ. CD4+ regulatory T cells in autoimmunity and allergy. Curr Opin Immunol. 2002;14:771–778. doi: 10.1016/s0952-7915(02)00408-9. [DOI] [PubMed] [Google Scholar]
- 6.Salomon B, et al. B7/CD28 costimulation is essential for the homeostasis of the CD4+CD25+ immunoregulatory T cells that control autoimmune diabetes. Immunity. 2000;12:431–440. doi: 10.1016/s1074-7613(00)80195-8. [DOI] [PubMed] [Google Scholar]
- 7.Tang Q, et al. In vitro-expanded antigen-specific regulatory T cells suppress autoimmune diabetes. J Exp Med. 2004;199:1455–1465. doi: 10.1084/jem.20040139. [DOI] [PMC free article] [PubMed] [Google Scholar]
- 8.Tarbell KV, Yamazaki S, Olson K, Toy P, Steinman RM. CD25+ CD4+ T cells, expanded with dendritic cells presenting a single autoantigenic peptide, suppress autoimmune diabetes. J Exp Med. 2004;199:1467–1477. doi: 10.1084/jem.20040180. [DOI] [PMC free article] [PubMed] [Google Scholar]
- 9.Thornton AM, Shevach EM. CD4+CD25+ immunoregulatory T cells suppress polyclonal T cell activation in vitro by inhibiting interleukin 2 production. J Exp Med. 1998;188:287–296. doi: 10.1084/jem.188.2.287. [DOI] [PMC free article] [PubMed] [Google Scholar]
- 10.Piccirillo CA, et al. CD4+CD25+ regulatory T cells can mediate suppressor function in the absence of transforming growth factor β1 production and responsiveness. J Exp Med. 2002;196:237–246. doi: 10.1084/jem.20020590. [DOI] [PMC free article] [PubMed] [Google Scholar]
- 11.Dieckmann D, Plottner H, Berchtold S, Berger T, Schuler G. Ex vivo isolation and characterization of CD4+CD25+ T cells with regulatory properties from human blood. J Exp Med. 2001;193:1303–1310. doi: 10.1084/jem.193.11.1303. [DOI] [PMC free article] [PubMed] [Google Scholar]
- 12.Apostolou I, Sarukhan A, Klein L, von Boehmer H. Origin of regulatory T cells with known specificity for antigen. Nat Immunol. 2002;3:756–763. doi: 10.1038/ni816. [DOI] [PubMed] [Google Scholar]
- 13.Levings MK, Sangregorio R, Roncarolo MG. Human CD25+CD4+ T regulatory cells suppress naive and memory T cell proliferation and can be expanded in vitro without loss of function. J Exp Med. 2001;193:1295–1302. doi: 10.1084/jem.193.11.1295. [DOI] [PMC free article] [PubMed] [Google Scholar]
- 14.Jonuleit H, et al. Identification and functional characterization of human CD4+CD25+ T cells with regulatory properties isolated from peripheral blood. J Exp Med. 2001;193:1285–1294. doi: 10.1084/jem.193.11.1285. [DOI] [PMC free article] [PubMed] [Google Scholar]
- 15.Levings MK, et al. Human CD25+CD4+ T suppressor cell clones produce transforming growth factor β, but not interleukin 10, and are distinct from type 1 T regulatory cells. J Exp Med. 2002;196:1335–1346. doi: 10.1084/jem.20021139. [DOI] [PMC free article] [PubMed] [Google Scholar]
- 16.Thornton AM, Shevach EM. Suppressor effector function of CD4+CD25+ immu-noregulatory T cells is antigen nonspecific. J Immunol. 2000;164:183–190. doi: 10.4049/jimmunol.164.1.183. [DOI] [PubMed] [Google Scholar]
- 17.Asseman C, Mauze S, Leach MW, Coffman RL, Powrie F. An essential role for interleukin 10 in the function of regulatory T cells that inhibit intestinal inflammation. J Exp Med. 1999;190:995–1004. doi: 10.1084/jem.190.7.995. [DOI] [PMC free article] [PubMed] [Google Scholar]
- 18.Read S, Malmstrom V, Powrie F. Cytotoxic T lymphocyte-associated antigen 4 plays an essential role in the function of CD25+CD4+ regulatory cells that control intestinal inflammation. J Exp Med. 2000;192:295–302. doi: 10.1084/jem.192.2.295. [DOI] [PMC free article] [PubMed] [Google Scholar]
- 19.Kingsley CI, Karim M, Bushell AR, Wood KJ. CD25+CD4+ regulatory T cells prevent graft rejection: CTLA-4- and IL-10-dependent immunoregulation of allore-sponses. J Immunol. 2002;168:1080–1086. doi: 10.4049/jimmunol.168.3.1080. [DOI] [PubMed] [Google Scholar]
- 20.Belkaid Y, Piccirillo CA, Mendez S, Shevach EM, Sacks DL. CD4+CD25+ regulatory T cells control Leishmania major persistence and immunity. Nature. 2002;420:502–507. doi: 10.1038/nature01152. [DOI] [PubMed] [Google Scholar]
- 21.Stoll S, Delon J, Brotz TM, Germain RN. Dynamic imaging of T cell-dendritic cell interactions in lymph nodes. Science. 2002;296:1873–1876. doi: 10.1126/science.1071065. [DOI] [PubMed] [Google Scholar]
- 22.Mempel TR, Henrickson SE, Von Andrian UH. T-cell priming by dendritic cells in lymph nodes occurs in three distinct phases. Nature. 2004;427:154–159. doi: 10.1038/nature02238. [DOI] [PubMed] [Google Scholar]
- 23.Miller MJ, Wei SH, Parker I, Cahalan MD. Two-photon imaging of lymphocyte motility and antigen response in intact lymph node. Science. 2002;296:1869–1873. doi: 10.1126/science.1070051. [DOI] [PubMed] [Google Scholar]
- 24.Miller MJ, Safrina O, Parker I, Cahalan MD. Imaging the single cell dynamics of CD4+ T cell activation by dendritic cells in lymph nodes. J Exp Med. 2004;200:847–856. doi: 10.1084/jem.20041236. [DOI] [PMC free article] [PubMed] [Google Scholar]
- 25.Bousso P, Robey E. Dynamics of CD8+ T cell priming by dendritic cells in intact lymph nodes. Nat Immunol. 2003;4:579–585. doi: 10.1038/ni928. [DOI] [PubMed] [Google Scholar]
- 26.Itano AA, et al. Distinct dendritic cell populations sequentially present antigen to CD4 T cells and stimulate different aspects of cell-mediated immunity. Immunity. 2003;19:47–57. doi: 10.1016/s1074-7613(03)00175-4. [DOI] [PubMed] [Google Scholar]
- 27.Itano AA, Jenkins MK. Antigen presentation to naive CD4 T cells in the lymph node. Nat Immunol. 2003;4:733–739. doi: 10.1038/ni957. [DOI] [PubMed] [Google Scholar]
- 28.Schmidt D, Verdaguer J, Averill N, Santamaria P. A mechanism for the major histocompatibility complex-linked resistance to autoimmunity. J Exp Med. 1997;186:1059–1075. doi: 10.1084/jem.186.7.1059. [DOI] [PMC free article] [PubMed] [Google Scholar]
- 29.Stetson DB, et al. Constitutive cytokine mRNAs mark natural killer (NK) and NK T cells poised for rapid effector function. J Exp Med. 2003;198:1069–1076. doi: 10.1084/jem.20030630. [DOI] [PMC free article] [PubMed] [Google Scholar]
- 30.Hara M, et al. Transgenic mice with green fluorescent protein-labeled pancreatic β-cells. Am J Physiol Endocrinol Metab. 2003;284:E177–E183. doi: 10.1152/ajpendo.00321.2002. [DOI] [PubMed] [Google Scholar]
- 31.Iezzi G, Scotet E, Scheidegger D, Lanzavecchia A. The interplay between the duration of TCR and cytokine signaling determines T cell polarization. Eur J Immunol. 1999;29:4092–4101. doi: 10.1002/(SICI)1521-4141(199912)29:12<4092::AID-IMMU4092>3.0.CO;2-A. [DOI] [PubMed] [Google Scholar]
- 32.Gett AV, Sallusto F, Lanzavecchia A, Geginat J. T cell fitness determined by signal strength. Nat Immunol. 2003;4:355–360. doi: 10.1038/ni908. [DOI] [PubMed] [Google Scholar]
- 33.Huppa JB, Gleimer M, Sumen C, Davis MM. Continuous T cell receptor signaling required for synapse maintenance and full effector potential. Nat Immunol. 2003;4:749–755. doi: 10.1038/ni951. [DOI] [PubMed] [Google Scholar]
- 34.Gunzer M, et al. Antigen presentation in extracellular matrix: interactions of T cells with dendritic cells are dynamic, short lived, and sequential. Immunity. 2000;13:323–332. doi: 10.1016/s1074-7613(00)00032-7. [DOI] [PubMed] [Google Scholar]
- 35.Gunzer M, et al. A spectrum of biophysical interaction modes between T cells and different antigen-presenting cells during priming in 3-D collagen and in vivo. Blood. 2004;104:2801–2809. doi: 10.1182/blood-2004-03-1193. [DOI] [PubMed] [Google Scholar]
- 36.Hsieh CS, et al. Recognition of the peripheral self by naturally arising CD25+ CD4+ T cell receptors. Immunity. 2004;21:267–277. doi: 10.1016/j.immuni.2004.07.009. [DOI] [PubMed] [Google Scholar]
- 37.Steinman RM, Hawiger D, Nussenzweig MC. Tolerogenic dendritic cells. Annu Rev Immunol. 2003;21:685–711. doi: 10.1146/annurev.immunol.21.120601.141040. [DOI] [PubMed] [Google Scholar]
- 38.Scheinecker C, McHugh R, Shevach EM, Germain RN. Constitutive presentation of a natural tissue autoantigen exclusively by dendritic cells in the draining lymph node. J Exp Med. 2002;196:1079–1090. doi: 10.1084/jem.20020991. [DOI] [PMC free article] [PubMed] [Google Scholar]
- 39.Serra P, et al. CD40 ligation releases immature dendritic cells from the control of regulatory CD4+CD25+ T cells. Immunity. 2003;19:877–889. doi: 10.1016/s1074-7613(03)00327-3. [DOI] [PubMed] [Google Scholar]
- 40.Sanderson MJ, Parker I. Video-rate confocal microscopy. Methods Enzymol. 2003;360:447–481. doi: 10.1016/s0076-6879(03)60123-0. [DOI] [PubMed] [Google Scholar]
Associated Data
This section collects any data citations, data availability statements, or supplementary materials included in this article.