

Abstract
The RNA-binding protein HuR is highly abundant in many cancers. HuR expression was recently found to be repressed by microRNA miR-519, which potently lowered HuR translation without influencing HuR mRNA abundance. Here, we examined the levels of HuR and miR-519 in pairs of cancer and adjacent healthy tissues from ovary, lung, and kidney. In the three sample collections, the cancer specimens showed dramatically higher HuR levels, unchanged HuR mRNA concentrations, and markedly reduced miR-519 levels, when compared with healthy tissues. As tested using human cervical carcinoma cells, miR-519 reduced tumorigenesis in athymic mice. Compared with the tumors arising from control cells, cells overexpressing miR-519 formed significantly smaller tumors, while cells expressing reduced miR-519 levels gave rise to substantially larger tumors. Evidence that the miR-519-elicited reduction of HuR was critical for its tumor suppressor influence was obtained by reducing HuR, as HuR-silenced cells formed markedly smaller tumors and were unable to form large tumors even after lowering miR-519 abundance. Together, our data reveal that miR-519 inhibits tumorigenesis in large part by repressing HuR expression.
Keywords: RNA-binding protein, post-transcriptional gene regulation, tumor suppressor microRNA, translational control
Introduction
By expressing distinct groups of proteins, cancer cells survive apoptosis, proliferate, escape senescence, develop local angiogenesis, evade immune surveillance, and colonize other tissues1. Some changes in cancer-related proteins arise from mutation, deletion or amplification of the genes that encode them. However, most cancer-specific protein expression patterns involve genes that are not mutated, but are expressed aberrantly2. Besides changes in transcription, modified protein expression patterns can arise through altered post-transcriptional mechanisms, including changes in pre-mRNA splicing and mRNA transport storage, degradation, and translation 3–5. These processes are mainly controlled by two types of RNA-binding factors: RNA-binding proteins (RBPs) and noncoding RNAs, particularly microRNAs6,7.
The impact of RBPs in cancer-associated gene expression is well recognized. Many oncoproteins, tumor suppressor proteins, and other cancer-related proteins are encoded by mRNAs whose half-lives and/or translation rates are tightly regulated. The sequences that confer differential turnover or translation typically reside in the 5′ and 3′-untranslated regions (UTRs) of the mRNA. Accordingly, several RBPs that associate with these regions and modulate mRNA turnover and translation (e.g., tristetraprolin, p37AUF1, and Sam68) were found to influence cancer-associated protein expression3,4,8–10. One of the RBPs most closely associated with tumorigenesis is HuR, a member of the Hu/elav (embryonic lethal abnormal vision) RBP family. HuR is expressed ubiquitously and throughout life11. It is primarily nuclear but translocates to the cytoplasm; in the cytoplasm, HuR stabilizes and/or modulates the translation of target mRNAs, in turn affecting the expression of encoded proteins, many of which inhibit apoptosis and promote cell division, angiogenesis, and tissue invasion12. In keeping with the proteins it regulates, HuR was found highly expressed in numerous cancers, and ectopic HuR overexpression in colon cancer cells promoted tumorigenesis13–15.
Recently, HuR expression was shown to be inhibited by microRNA miR-519. Mammalian microRNAs are small (~22 nt), evolutionarily conserved RNAs that assemble with members of the argonaute protein family into the miRNA-induced silencing complex (RISC)16. MicroRNA-RISC typically represses gene expression by promoting mRNA decay, and/or suppressing translation5,17. Besides affecting development and differentiation, microRNAs have been shown to play critical roles in cancer, where many microRNAs that function as tumor suppressors (e.g., miR-15a, miR-16, and let-7) and oncogenes (e.g., miR-155, miR-17~92 cluster, and miR-21) have been identified18. miR-519 potently repressed HuR translation without affecting HuR mRNA abundance and by inhibiting HuR, miR-519 suppressed cell proliferation19. Based on these observations, we postulated that miR-519 might function as a tumor suppressor microRNA. Here, we set out to examine this possibility directly by studying the levels of miR-519 and HuR in paired human tumors and adjacent healthy tissues. The discovery that miR-519 was markedly reduced across the tumor samples further supported its tumor-suppressor function. Such a function, as well as its dependence on the miR-519-elicited reduction of HuR, were investigated using a xenograft mouse model of human cancer.
Results and Discussion
Inverse correlation between miR-519 and HuR levels in paired tumor and non-tumor human tissues
Given the elevated abundance of HuR in most cancers examined13–15 and the repression of HuR by miR-51919, we investigated the relative abundance of HuR and miR-519 in pairs of human tumor and non-tumor samples from several organs. In each case, we examined HuR levels by Western blot analysis, and HuR mRNA and miR-519 levels by reverse transcription (RT) followed by quantitative (q)PCR analysis.
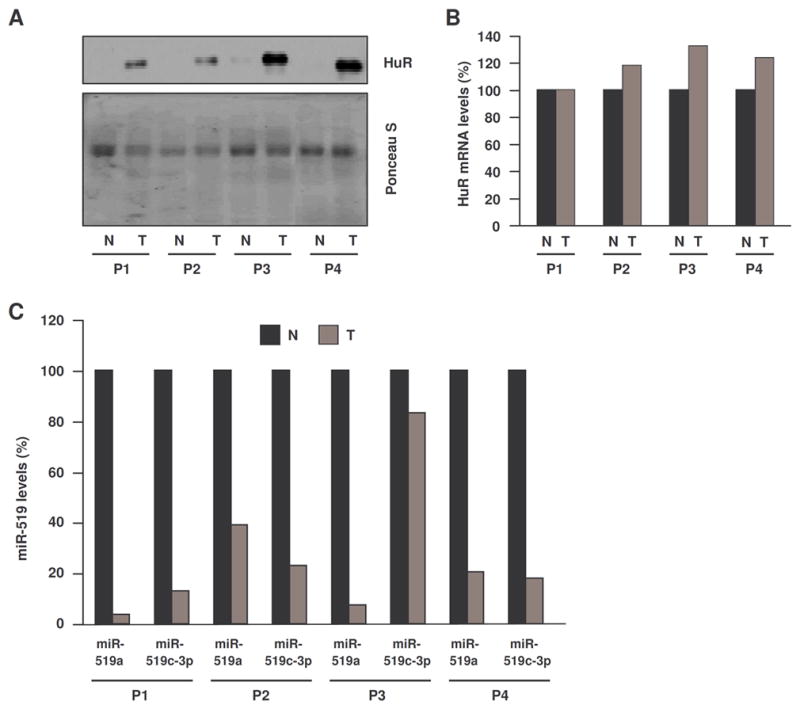
The results for ovarian tissues are summarized in Figure 1. HuR abundance was markedly higher in the four tumor samples (T, details in Materials and methods) compared with adjacent healthy ovarian tissues (N) (Figure 1A). Strikingly, however, the levels of HuR mRNA were unchanged between N and T samples in all of the pairs examined (Figure 1B), suggesting that HuR did not increase in tumors through elevated transcription or enhanced HuR mRNA stability. This pattern of HuR expression was reminiscent of that seen previously in ovarian tissues, where HuR levels were high in ovarian cancer cell line and low in untransformed ovarian epithelial cells, while HuR mRNA abundance was unaltered19. To study if changes in miR-519, which represses HuR translation but does not affect HuR mRNA levels, might be responsible for the different expression of HuR in T and N tissues, we measured miR-519 levels in each sample. All three miR-519 variants (miR-519a, miR-519b-3p, miR-519c-3p) were less abundant in T compared with N samples (Figure 1C). Together, these findings agree with the hypothesis that miR-519 could help to maintain low levels of HuR in normal tissues and that reduced miR-519 levels in cancer tissues could contribute to the upregulation of HuR levels.
Figure 1. Inverse relationship between HuR and miR-519 levels in ovarian tissues.

(A) Western blot analysis of HuR expression in ovarian tumor (T) and patient-matched normal ovary (N) from four patients (P1-P4). Sample loading was monitored by Ponceau S staining. (B) HuR mRNA abundance was measured by RT-qPCR analysis using HuR-specific primer pairs and normalized to 18S rRNA abundance (also measured by RT-qPCR) in each sample. Data are indicated as percent HuR mRNA in each T sample relative to N sample for each patient. (C) The abundance of miR-519a, miR-519b-3p, and miR-519c-3p in each sample pair was measured by RT-qPCR and normalized to U1 RNA levels. Data are indicated as percent miR-519 abundance in each T sample relative to each N sample for the same patient.
Testing pairs of kidney tissues revealed similar patterns of HuR and miR-519 levels. HuR was much more abundant in samples from four renal cell carcinoma (RCC) samples (T) relative to normal kidney tissue (N) (Figure 2A). By contrast, HuR mRNA levels were comparable in each N and T pair (Figure 2B). In agreement with the hypothesis that miR-519 reduction might contribute to the heightened HuR in the absence of a corresponding HuR mRNA upregulation, we observed potently reduced levels of miR-519a and miR-519c-3p in the tumor samples (miR-519b-3p was undetectable in the kidney).
Figure 2. Inverse relationship between HuR and miR-519 expression in kidney tissues.
(A) Western blot analysis of HuR expression in kidney tumor (T) and patient-matched normal kidney (N) from four patients (P1-P4). Loading was monitored by Ponceau S staining. (B) HuR mRNA abundance was measured by RT-qPCR analysis as explained in Fig. 1. (C) The abundance of miR-519a and miR-519c-3p (miR-519b-3p was undetectable) in each sample pair was measured as explained in Fig. 1. In panels (B) and (C), data indicate percent RNA abundance in each T sample relative to each N sample for the same patient.
The results in lung samples followed the same trend. HuR protein levels were distinctly elevated in the three lung cancer samples (T) compared with adjacent healthy lung (N) samples (Figure 3A). As in ovary and kidney, HuR mRNA abundance was only modestly changed between T and N samples (Figure 3B); likewise, miR-519 levels were much lower in tumor compared with normal tissues. Together, in all of the tumors and normal samples examined (ovary, kidney, and lung) HuR protein levels (but not HuR mRNA levels) were highly upregulated, while the levels of the HuR repressor miR-519 were strongly reduced.
Figure 3. Inverse relationship between HuR and miR-519 expression in lung tissues.

(A) Western blot analysis of HuR expression in lung tumor (T) and patient-matched normal lung (N) from three patients (P1-P3). Sample loading was monitored by Ponceau S staining. (B) HuR mRNA abundance was measured by RT-qPCR analysis as explained in Fig. 1. (C) The abundance of miR-519a, miR-519b-3p, and miR-519c-3p in each sample pair was measured as explained in Fig. 1. Data in panels (B) and (C) indicate percent RNA abundance in each T sample relative to each N sample for the same patient.
A recent screen for RBPs potentially implicated in cancer revealed that HuR mRNA abundance was unchanged between cancer tissues and normal tissues9. The discovery that HuR mRNA levels remain essentially unchanged while HuR protein levels change dramatically (Figures 1–3) underscores the importance of monitoring cancer-associated protein expression patterns, since these not always arise from changes in the encoding mRNAs.
miR-519 inhibits tumor growth in athymic mice
The above observations support the view that miR-519 could repress tumor growth by lowering HuR expression. To test this hypothesis, we modulated miR-519 levels in human cervical carcinoma HeLa cells, then tested their ability to form tumors in athymic mice, a well-established mouse model of tumorigenesis. miR-519 levels were elevated by expression of a precursor (Pre) miR-519 and were lowered by expression of a miR-519 antagomir, an RNA complementary (antisense, AS) to miR-519 (Figure 4A). By 3 weeks after injection into the flanks of athymic mice, cells in control (Ctrl siRNA), (Pre)miR-519, and (AS)miR-519 transfection groups gave rise to tumors of varying sizes (assessed by weighing the tumors). As shown in Figure 4B, compared with the tumors arising from control cells, tumors that developed from cells expressing lower miR-519 [(AS)miR-519] were larger, while cells in which miR-519 was overexpressed [(Pre)miR-519] gave rise to significantly smaller tumors.
Figure 4. Tumorigenesis by cells expressing different miR-519 and HuR levels.

(A) Forty-eight h after transfecting HeLa cells with the small RNAs indicated, HuR levels were measured by Western blot analysis (top, including loading control β-Actin) and miR-519c-3p levels by RT-qPCR analysis (bottom, normalized using U1 RNA). Western blot analysis is representative of 3 experiments, graph shows the means ±S.E.M. from 3 experiments. (B) HeLa cells transfected as in panel (a) were injected (2 million cells per flank) in athymic mice. Three weeks later, tumors were excised. The individual weights (dots), averages (horizontal lines) and significance (Mann-Whitney U test) from 13 mice per group (two independent injections) are shown.
The tumor-promoting influence of lowering miR-519 is reversed by HuR silencing
To test if the increased tumor growth seen in (AS)miR-519 cells was due, at least partly, to the upregulation of HuR levels in these cells, HuR was reduced by using small interfering (si)RNA, and the influence of (AS)miR-519 was tested under these conditions. Lowering of HuR decreased tumor growth, as reported earlier14. Importantly, when HuR was silenced, (AS)miR-519 overexpression no longer promoted tumorigenesis, as tumors in the HuR siRNA+(AS)miR-519 group were significantly smaller than those in the (AS)miR-519 group. These results indicate that the tumor-promoting effect of lowered miR-519 was largely dependent on the increase in HuR abundance.
As proposed by several groups, including ours, HuR can promote tumor development by enhancing the expression of proteins that inhibit apoptosis (e.g., prothymosin-α, bcl-2), promote proliferation (e.g., cyclins D1, E, A2, B1), increase angiogenesis (e.g., HIF-1α, VEGF), and enhance tumor invasion (e.g., matrix metalloprotease 9). Our results indicate that lowering miR-519 by transfection with (AS)miR-519 promotes tumor growth and that this effect depends largely on the upregulation of HuR, since HuR silencing significantly prevented the increase in tumorigenesis (Figure 4B). Conversely, we propose that miR-519 represses tumor growth by lowering HuR expression and hence the levels of the pro-oncogenic proteins expressed under HuR control. Experiments are underway to test if expression of an engineered HuR mutant with a disrupted miR-519 site in the coding region (and thus refractory to repression by miR-51919), renders cells resistant to the tumor suppressive influence of miR-519.
In sum, our data support a tumor-suppressor function for miR-519 and further indicate that the miR-519-mediated reduction of HuR plays a key role in this effect. Current efforts are aimed at elucidating the mechanism(s) whereby miR-519 abundance decreases in cancer cells. Future studies will address if measurements of miR-519 and/or HuR might be helpful diagnostic parameters in cancer and study the tumor-suppressor influence of miR-519 in mammalian genetic models. A thorough knowledge of the mechanisms that regulate miR-519 expression and function will help to elucidate the diagnostic, prognostic, and therapeutic potential of miR-519 and miR-519-regulated HuR in human malignancy.
Materials and methods
Tumor samples
Pathologist-dissected ovarian, kidney, and lung tumor samples, as well as adjacent healthy ovarian, kidney, and lung tissue samples from the same patient were obtained from anonymous donors through the Pathology Biorepository and Research Core of the University of Maryland Greenebaum Cancer Center. The ovarian tumors included two adenocarcinomas (P1, P2), one serous carcinoma, papillary (P3), one serous borderline tumor with focal micropapillary architecture (P4). The kidney tumors were renal cell carcinoma (RCC) grades 2, 3, 1 (P1, P2, and P3, respectively), and a clear-cell RCC grade 4 (P4). The lung tumors were adenocarcinoma moderately differentiated (P1), adenocarcinoma, invasive and moderately-to-poorly differentiated (P2), and squamous cell carcinoma, moderately differentiated (P3).
Cell culture, transfection, and small RNAs
Human cervical carcinoma HeLa cells were cultured in DMEM containing 5% FBS and A21780 and HOSE-B cells in RPMI containing 10% FBS. Cells (~50% confluence) were transfected using Oligofectamine (Invitrogen) with 100 nM small RNAs (Ambion): HuR siRNA, control siRNA, (Pre)miR 519 (designed to express UGGAGAUUUUCCUACGUGAAA), and (AS)miR-519 (UUUCACGUAGGAAAAUCUCCAA).
Western blot analysis
Lysates from tissue samples and cultured cells were prepared using RIPA buffer and processed as described20. Incubations with monoclonal antibodies recognizing HuR (Santa Cruz Biotech) and β-Actin (Abcam), were followed by incubations with appropriate secondary antibodies (Amersham) and by detection using enhanced luminescence (Amersham).
RNA quantification
RNA from tissues and cultured cells was prepared using TRIzol (Invitrogen). After reverse transcription (RT) using random hexamers and SSII reverse transcriptase (Invitrogen), real-time quantitative (q)PCR analysis was performed using gene-specific primers (GTGACATCGGGAGAACGAAT and GCGGTCACGTAGTTCACAAA for HuR, CCCTATCAACTTTCGATGGTAGTCG and CAATGGATCCTCGTTAAAGGATTT for 18S rRNA) and SYBR Green PCR master mix (Applied Biosystems). Mature miR-519 was quantified using QuantiMir RT. Primers used were AAAGTGCATCCTTTTAGAGTGT for miR-519a, AAAGTGCATCCTTTTAGAGGTT for miR-519b-3p, andAAGTGCATCTTTTTAGAGGAT for miR-519c-3p. Data were normalized to U1 using specific primer CGACTGCATAATTTGTGGTAGTGG.
Tumorigenesis assays using athymic mice
HeLa cells were transfected with the small RNAs indicated; 12 h later they were trypsinized, resuspended at 2 million cells/0.2 ml PBS, and injected into the lumbar regions of male athymic BALB/c nude mice (Hsd:Athymic Nude-Foxn1nu), 8 weeks old (Harlan, Summerfield, NJ). Three weeks later, mice were sacrificed and tumors were excised and weighed.
Acknowledgments
This research was supported by the NIA-IRP, NIH. We thank N.K. Hooten, D. Boyer, and the NIA Animal Facility (NIA-IRP, NIH). S.E.B. and G.M.W. were funded by American Cancer Society grant RSG-07-293-01-GMC.
References
- 1.Hanahan D, Weinberg RA. The hallmarks of cancer. Cell. 2000;100:57–70. doi: 10.1016/s0092-8674(00)81683-9. [DOI] [PubMed] [Google Scholar]
- 2.Sager R. Expression genetics in cancer: shifting the focus from DNA to RNA. Proc Natl Acad Sci USA. 1997;94:952–5. doi: 10.1073/pnas.94.3.952. [DOI] [PMC free article] [PubMed] [Google Scholar]
- 3.López de Silanes I, Quesada MP, Esteller M. Aberrant regulation of messenger RNA 3′-untranslated region in human cancer. Cell Oncol. 2007;29:1–17. doi: 10.1155/2007/586139. [DOI] [PMC free article] [PubMed] [Google Scholar]
- 4.Lukong KE, Chang KW, Khandjian EW, Richard S. RNA-binding proteins in human genetic disease. Trends Genet. 2008;24:416–25. doi: 10.1016/j.tig.2008.05.004. [DOI] [PubMed] [Google Scholar]
- 5.Kim VN, Han J, Siomi MC. Biogenesis of small RNAs in animals. Nat Rev Mol Cell Biol. 2009;10:126–39. doi: 10.1038/nrm2632. [DOI] [PubMed] [Google Scholar]
- 6.Moore MJ. From birth to death: the complex lives of eukaryotic mRNAs. Science. 2005;309:1514–8. doi: 10.1126/science.1111443. [DOI] [PubMed] [Google Scholar]
- 7.Keene JD. RNA regulons: coordination of post-transcriptional events. Nat Rev Genet. 2007;8:533–43. doi: 10.1038/nrg2111. [DOI] [PubMed] [Google Scholar]
- 8.Gouble A, Grazide S, Meggetto F, Mercier P, Delsol G, Morello D. A new player in oncogenesis:AUF1/hnRNPD overexpression leads to tumorigenesis in transgenic mice. Cancer Res. 2002;62:1489–95. [PubMed] [Google Scholar]
- 9.Brennan SE, Kuwano Y, Alkharouf N, Blackshear PJ, Gorospe M, Wilson GM. The mRNA-destabilizing protein tristetraprolin is suppressed in many cancers, altering tumorigenic phenotypes and patient prognosis. Cancer Res. 2009;69:5168–76. doi: 10.1158/0008-5472.CAN-08-4238. [DOI] [PMC free article] [PubMed] [Google Scholar]
- 10.Kim MY, Hur J, Jeong S. Emerging roles of RNA and RNA-binding protein network in cancer cells. BMB Rep. 2009;42:125–30. doi: 10.5483/bmbrep.2009.42.3.125. [DOI] [PubMed] [Google Scholar]
- 11.Masuda K, Marasa B, Martindale JL, Halushka MK, Gorospe M. Tissue- and age-dependent expression of RNA-binding proteins that influence mRNA turnover and translation. Aging. 2009;1:1–16. doi: 10.18632/aging.100073. [DOI] [PMC free article] [PubMed] [Google Scholar]
- 12.Hinman MN, Lou H. Diverse molecular functions of Hu proteins. Cell Mol Life Sci. 2008;65:3168–81. doi: 10.1007/s00018-008-8252-6. [DOI] [PMC free article] [PubMed] [Google Scholar]
- 13.Dixon DA, Tolley ND, King PH, Nabors LB, McIntyre TM, Zimmerman GA, et al. Altered expression of the mRNA stability factor HuR promotes cyclooxygenase-2 expression in colon cancer cells. J Clin Invest. 2001;108:1657–65. doi: 10.1172/JCI12973. [DOI] [PMC free article] [PubMed] [Google Scholar]
- 14.López de Silanes I, Fan J, Yang X, Zonderman AB, Potapova O, Pizer ES, et al. Role of the RNA-binding protein HuR in colon carcinogenesis. Oncogene. 2003;22:7146–54. doi: 10.1038/sj.onc.1206862. [DOI] [PubMed] [Google Scholar]
- 15.Heinonen M, Fagerholm R, Aaltonen K, Kilpivaara O, Aittomäki K, Blomqvist C, et al. Prognostic role of HuR in hereditary breast cancer. Clin Cancer Res. 2007;13:6959–63. doi: 10.1158/1078-0432.CCR-07-1432. [DOI] [PubMed] [Google Scholar]
- 16.Lim LP, Lau NC, Garrett-Engele P, Grimson A, Schelter JM, Castle J, et al. Microarray analysis shows that some microRNAs downregulate large numbers of target mRNAs. Nature. 2005;433:769–73. doi: 10.1038/nature03315. [DOI] [PubMed] [Google Scholar]
- 17.Chekulaeva M, Filipowicz W. Mechanisms of miRNA-mediated post-transcriptional regulation in animal cells. Curr Opin Cell Biol. 2009;21:452–60. doi: 10.1016/j.ceb.2009.04.009. [DOI] [PubMed] [Google Scholar]
- 18.Garzon R, Calin GA, Croce CM. MicroRNAs in Cancer. Annu Rev Med. 2009;60:167–79. doi: 10.1146/annurev.med.59.053006.104707. [DOI] [PubMed] [Google Scholar]
- 19.Abdelmohsen K, Srikantan S, Kuwano Y, Gorospe M. miR-519 reduces cell proliferation by lowering RNA-binding protein HuR levels. Proc Natl Acad Sci USA. 2008;105:20297–302. doi: 10.1073/pnas.0809376106. [DOI] [PMC free article] [PubMed] [Google Scholar]
- 20.Abdelmohsen K, Pullmann R, Jr, Lal A, Kim HH, Galban S, Yang X, et al. Phosphorylation of HuR by Chk2 regulates SIRT1 expression. Mol Cell. 2007;25:543–57. doi: 10.1016/j.molcel.2007.01.011. [DOI] [PMC free article] [PubMed] [Google Scholar]