

Abstract
Calcineurin (CaN, PP2B, PPP3), a heterodimeric Ca2+-calmodulin-dependent Ser/Thr phosphatase, regulates swimming in Paramecia, stress responses in yeast, and T-cell activation and cardiac hypertrophy in humans. Calcium binding to CaNB (the regulatory subunit) triggers conformational change in CaNA (the catalytic subunit). Two isoforms of CaNA (α, β) are both abundant in brain and heart and activated by calcium-saturated calmodulin (CaM). The individual contribution of each domain of CaM to regulation of calcineurin is not known. Hydrodynamic analyses of (Ca2+)4-CaM1-148 bound to βCaNp, a peptide representing its CaM-binding domain, indicated a 1:1 stoichiometry. βCaNp binding to CaM increased the affinity of calcium for the N- and C-domains equally, thus preserving intrinsic domain differences, and the preference of calcium for sites III and IV. The equilibrium constants for individual calcium-saturated CaM domains dissociating from βCaNp were ~1 μM. A limiting Kd ≤ 1 nM was measured directly for full-length CaM, while thermodynamic linkage analysis indicated that it was approximately 1 pM. βCaNp binding to 15N-(Ca2+)4-CaM1-148 monitored by 15N/1HN HSQC NMR showed that association perturbed the N-domain of CaM more than its C-domain. NMR resonance assignments of CaM and βCaNp, and interpretation of intermolecular NOEs observed in the 13C-edited and 12C-14N-filtered 3D NOESY spectrum indicated anti-parallel binding. The sole aromatic residue (Phe) located near the βCaNp C-terminus was in close contact with several residues of the N-domain of CaM outside the hydrophobic cleft. These structural and thermodynamic properties would permit the domains of CaM to have distinct physiological roles in regulating activation of βCaN.
Keywords: allostery, fluorescence, NMR, stoichiometry, energetics, binding, calcium
Introduction
Calcineurin (CaN, PP2B, PPP3), a calcium-calmodulin-dependent Ser/Thr phosphatase 1,2, plays an essential role in diverse cellular responses to influxes of calcium. Through its dephosphorylation of intracellular substrates, CaN regulates numerous signaling pathways that contribute to both pathological and normal developmental processes. These include exocytosis and backward swimming in Paramecia 3, regulation of environmental response to stress in fungi 4,5, and cardiac development, hypertrophy, neuronal plasticity, and T-cell activation in mammals 6.
Calcineurin is a heterodimer composed of a catalytic subunit A (CaNA, 57-61 kDa), and a Ca2+-binding regulatory subunit B (CaNB, 19 kDa). There are three human isoforms of the catalytic subunit (α, β, and γ CaNA). Extensive proteolytic and structural studies have revealed that the C-terminal region of CaNA contains multiple regulatory regions including a CaNB-binding helix, and a calmodulin-binding domain (CaM-BD) associated with an auto-inhibitory domain (AID) 7,8. The recognition sequences of the CaM-BDs of αCaNA and βCaNA differ at only a single residue (Val vs. Ile, Figure 1A). CaNB contributes to CaN activation by binding Ca2+ ions at its four EF-hand (helix-loop-helix) calcium-binding sites; this results in significant structural changes. Subsequent binding of CaM to CaNA increases the phosphatase activity of CaN by 10-fold 9,10. A high-resolution crystallographic structure of αCaN in the absence of CaM (1AUI.pdb) shows that the AID adopts a helical conformation and occludes the active site of the enzyme 11. Proteolytic removal of the AID is not sufficient to relieve inhibition completely, suggesting that other residues may provide additional level(s) of regulation through interaction with CaM 10,12. In this structure (1AUI.pdb), there is no electron density corresponding to the non-catalytic region of the CaNA beyond the helical sequence bound to CaNB 12-14. To date, there is no high-resolution structure of a CaN-CaM complex in its entirety.
FIGURE 1.

Structures of Calmodulin and Calcineurin. (A) Ribbon diagram of heterodimeric Calcineurin (1AUI.pdb), showing CaNA (green) and CaNB (purple). The dotted green line represents CaN residues that are absent from the electron density. The calcium-binding sites of CaNB are shown in yellow. Two metals ions, zinc (red) and iron (blue), are located in the active site of CaN; in the absence of CaM, this site is held inactive by the auto-inhibitory domain (orange). The sequence of the CaM-binding domains of α–CaN (residues 391-414) and β–CaN (residues 400-423) is boxed. (B) Ribbon diagram of (Ca2+)4-CaM (Paramecium CaM, 1CLM.pdb, 1.8 Å). Calcium-binding sites (yellow) I and II are in the N-domain (blue), and sites III and IV are in the C-domain (red). The N and C domains are linked via a flexible linker (black). (C) Ribbon diagram of (Ca2+)4-CaM bound to the CaM-binding domain of α–CaN (αCaNp, green) solved using X-ray crystallography (2R28.pdb). αCaNp1 is contacted by the N-domain of one CaM molecule (N1) and the C-domain of a second CaM molecule (C2), and αCaNp2 is contacted by N2 and C1. (D) Ribbon diagram of (Ca2+)4-CaM bound to αCaNp peptide (green) solved using NMR (2JZI.pdb). Ribbon diagrams were created using MacPymol™ (DeLano Scientific).
Calmodulin (Figure 1B) is a small (148 amino acid, ~17 kDa) calcium-binding protein that serves as an essential sensor of intracellular calcium in all eukaryotes. Like CaNB, CaM binds up to four calcium ions with its two homologous domains, which are connected by a flexible linker. The N-domain (containing sites I and II) and the C-domain (containing sites III and IV) bind calcium cooperatively, via their paired EF-hand calcium-binding motifs. Despite their high degree of identity at the levels of primary, secondary and tertiary structure, the C-domain exhibits about 10-fold higher calcium affinity than the N-domain in mammalian CaM (mCaM) and a ~25-fold higher calcium affinity in Paramecium CaM (PCaM) 15. The primary sequence of CaM is highly conserved among eukaryotes 16. PCaM (Figure 1B) is 88% identical to mCaM 17. The 4-helix bundle domains of CaM are similar to the 4-helix bundle domains of CaNB, particularly within the 12-residue Ca2+-binding loops.
In addition to regulating the catalytic activity of CaN, CaM contributes to the regulation of metabolic enzymes, cyclases, esterases, kinases, cytoskeletal proteins and ion channels 18-24. Upon Ca2+ binding, hydrophobic regions within the CaM domains are exposed to solvent, allowing CaM to associate with target proteins in an “open” conformation. Calcium-saturated CaM preferentially associates with basic, amphipathic, α-helical sequences (BAA motifs) and usually adopts a compact ellipsoidal (“wrap-around”) structure (Figure 1D), with the two CaM domains engulfing the CaM-BD of a target protein. This is seen in structures of CaM associated with its binding domain in myosin light chain kinase (MLCK), CaM kinase II (CaMKII) and nitric oxide synthase (NOS) 25,26. However, some targets are known to bind to CaM in the absence of calcium; these calcium-independent targets include neuromodulin, voltage-dependent sodium channel (VDSC), ryanodine receptor type I (RyR1) and N-methyl D-aspartate (NMDA) receptors 25-28. Some targets bind CaM having only one domain calcium-saturated [e.g. the SK-channel 27, adenylate cyclase from Bordetella pertussis 28 and Anthrax 29]. Thus, there is mounting evidence that CaM adopts multiple domain-specific conformations corresponding to different calcium-ligation states to associate with and regulate its protein targets. While the concentration of total intracellular CaM varies in different cell types (with a range of 2 to 25 μM 30), estimates of the concentration of free CaM are consistently lower (2-10 nM 31,32). This suggests that much of the CaM in cells is sequestered, with competition among targets for limiting levels of free CaM 33,34. Therefore, precise responses to intracellular calcium-fluxes will dictate whether a particular CaM target is preferentially activated.
Although it is widely recognized that the energetic coupling of target association and calcium-binding allows CaM to regulate its diverse targets 26-28,37, little is known about how the domain-specific calcium-binding properties of CaM are altered when bound to CaN. Calcium-saturated CaM ((Ca2+)4-CaM) is essential for the in vivo function of CaN 6. Early studies reported the dissociation constant of (Ca2+)4-CaM from CaN to be in the low nM range 35, but more recent estimates suggest that full-length CaM dissociates from CaN with a Kd in the pM range 36. We wished to determine the distinct roles played by the N-domain and C-domain of CaM in recognition and activation of βCaN, and investigate the degree to which interdomain communication within CaM may contribute to regulation and recognition of CaN.
In this study, we focus on CaM binding to βCaNp, a peptide representing residues 400-423 of βCaNA. Multiple hydrodynamic methods showed that CaM formed a 1:1 complex with βCaNp in solution. Using 15N/1HN HSQC NMR spectroscopy, we identified the CaM residues that were significantly perturbed upon binding to βCaNp. These perturbed residues were located in both the N and C-domains of CaM. Intermolecular NOEs observed from the 13C-edited and 12C,14N-filtered 3D NOESY spectrum indicated that βCaNp bound in an anti-parallel fashion in the 1:1 (Ca2+)4-CaM-βCaNp complex, (i.e., the C-terminus of the peptide was closest to in the N-domain of CaM). The sole aromatic residue of βCaNp interacted exclusively with the N-domain.
A thermodynamic analysis of the free energies governing the domain-specific and Ca2+-dependent interactions of CaM with βCaNp showed how each domain of CaM contributed to the formation of a high-affinity, 1:1 complex. The association of CaM1-148 with βCaNp greatly increased the calcium-binding affinities of both the N- and C-domains, but preserved the order-of-magnitude separation in affinities between them. A prediction of this finding is that CaM may bind to CaNA at very low cellular concentrations of calcium, but the N-domain may respond differentially to a higher calcium concentration to trigger conformational change or subsequent activation. Its lower intrinsic affinity for βCaNp leaves open the possibility that the N-domain of CaM also interacts with a surface elsewhere on CaN. Together, these studies provide insight into the allosteric mechanism whereby the CaM domains may play different roles in regulating activation of CaN.
Materials and Methods
Calmodulin Overexpression and Purification
All isotopes were obtained from Cambridge Isotope Laboratories, Andover, MA. IPTG-induced overexpression of CaM was performed using transformed BL21(DE3) cells containing the recombinant pT7-7 vector of full-length Paramecium CaM (CaM1-148, a gift from C. Kung, University of Wisconsin, Madison, WI), the corresponding N-domain fragment (CaM1-80), or C-domain fragment (CaM76-148) 37. 15N-labeled proteins were overexpressed in minimal media, using 2 g/L unlabeled glucose as a carbon source and 1 g/L 15NH4Cl as the sole nitrogen source. CaM labeled with both 13C and 15N were produced using 2 g/L [U-13C]-glucose as the sole carbon source and 1 g/L 15NH4Cl as the sole nitrogen source. The proteins were then purified as previously described 38. The recombinant proteins were 97-99% pure as judged by silver-stained SDS-PAGE gels. Protein concentrations were determined by UV spectroscopy of protein denatured with NaOH 39 or native at pH 7.4 40.
Peptides
A peptide (βCaNp: ARKEIIRNKIRAIGKMARVFSVLR, 2.826 kDa) representing residues 400-423 of the CaNA subunit of the β-isoform of CaN was custom-synthesized by the GenScript Corporation (Scotch Plains, NJ), with or without conjugation of FITC (fluorescein) to the amino-terminus of the peptide. The fluorescein-labeled peptide is designated as Fl-βCaNp. Both peptides were evaluated to be at least 95% pure by HPLC analysis and MALDI-TOF mass spectrometry. The region of βCaNp used in this study corresponds to residues 391-414 of the α-isoform (αCaNp), and differs at only one position (Val vs. Ile, Figure 1A).
Stokes Radius
To determine the hydrated radius of (Ca2+)4-CaM1-148 in the presence of Fl-βCaNp, analytical gel chromatography studies were performed with an ÄKTA FPLC (model UPC-900; Amersham Pharmacia Biotech) using a 10×300 mm, 24 mL Superdex-75 column (GE Healthcare), with a flow rate of 0.4 mL/min at room temperature (23 ± 1°C). The column was equilibrated with running buffer (50 mM HEPES, 10 mM CaCl2, 100 mM KCL, 50 μM EGTA, pH 7.42). Samples of calcium-saturated CaM1-148 were diluted to 10 μM using running buffer in the absence or presence of 12 μM βCaNp. Elution of protein samples (200 μL) was monitored at 280 nM. The Stokes radius (Rs) was calculated based on the elution volumes of Blue Dextran, acetone, and standard globular proteins [bovine serum albumin (BSA), ovalbumin, chymotrypsin, and ribonuclease A] used at 4 mg/mL each, as described previously 41. The average Rs from three determinations is reported in Figure 2A and Table 1. The Stokes radius value for Ca2+-CaM1-148 bound to melittin was reported previously by Sorensen et al 42.
FIGURE 2.

Hydrodynamic studies of calcium-saturated CaM1-148 alone (black bars) and in the presence of βCaNp (gray bar) or melittin (white bar). (A) Stokes radii and (B) sedimentation coefficients of calcium-saturated CaM1-148, alone and in the presence of excess peptide. Sedimentation of the CaM-peptide complex was monitored by absorbance at 280 nm in the case of melittin (Sorensen et al 2001 42) and at 494 nm in the case of Fl-βCaNp. NMR T2 relaxation rates were measured for Ca2+-saturated CaM1-148 in the presence of excess (C) βCaNp or (D) melittin. Graphs represent the distribution of residues at a given T2 value (in sec).
TABLE 1.
| Peptide | Stokes Radius (Å) |
Δ Åc | Sedimentation Coefficient (s) |
Δ sd | Average T2e (sec) |
|---|---|---|---|---|---|
| – | 24.72 ± 0.21 | – | 1.62 ± 0.07f | – | – |
| βCaNp | 23.32 ± 0.07 | 1.40 | 2.07 ± 0.08 | 0.45 | 0.053 |
| Melittin | 22.94 ± 0.32f | 1.78 | 2.00 ± 0.10f | 0.38 | 0.050 |
In the presence of 10 mM CaCl2
Peptides present in slight molar excess (see Materials and Methods)
δ Å = Å (CaM + peptide) - Å (CaM alone)
δ s = s (CaM + peptide) - s (CaM alone)
Average T2 values were calculated excluding mobile termini
Values previously reported by Sorensen et al 42
Sedimentation Coefficient
Sedimentation velocity studies of CaM1-148 with Fl-βCaNp were carried out at 22 ± 1°C, with a Beckman XL-I analytical ultracentrifuge, at 55,000 rpm. Stocks of CaM1-148 were equilibrated with running buffer (50 mM HEPES, 10 mM CaCl2, 1 mM MgCl2, 100 mM KCL, 5 mM NTA, 50 μM EGTA, pH 7.42). In all experiments, buffer from the final dialysis step was reserved to serve as a buffer blank. Samples of CaM1-148 were diluted to approximately 8.3 μM in the presence of a slight excess of Fl-βCaNp. Sedimentation was monitored at 494 nm every 90 s for 3.5 h. Data (Supplementary Figure 1) were analyzed using SEDFIT 43,44 assuming one or two species were present. The data fit best to a single-species model; the resolved sedimentation coefficient was reported in Figure 2B and Table 1. Sedimentation coefficients for Ca2+-CaM1-148 alone and bound to melittin were reported previously by Sorensen et al 42.
Hydrodynamic Study via NMR
Samples for 15N T2 relaxation measurements contained 500 μM 15N-CaM1-148 and a 10-20% molar excess of unlabeled βCaNp or melittin in a 90% H2O/10% H2O buffer (50 mM HEPES, 100 mM KCl, 50 μM EGTA, 5 mM CaCl2 and 1 mM MgCl2 at pH 7.4). 15N T2 data were recorded as previously described 45-47 at 22 °C on a Bruker Avance II 800 MHz NMR spectrometer equipped with a triple-resonance cryoprobe. Experiments were recorded with a sweep width of 15 ppm in the F2 dimension, with the 1H carrier set to the water signal, and a sweep width of 30.8 ppm in the F1 dimension, with the 15N carrier set to 117.0 ppm. The spectra were acquired using echo/antiecho gradient selection with a water-flip-back sequence. A total of 70 (t1) × 1024 (t2) complex points were recorded with 16 scans per increment for each spectrum. A total of nine 15N T2 experiments were collected with CPMG delays of 0, 17.28, 34.56, 51.84, 69.12, 86.40, 103.68, 138.24, and 172.80 ms for each sample. A recycle time of 3.3 s was used between scans. The 15N T2 data were processed with NMRPipe 48 and fitted to a two-parameter mono-exponential function by using peak heights with the NMRViewJ software 49. Average T2 values were calculated (excluding values from the CaM termini, Figure 2C and 2D).
NMR Spectroscopy
For the study of residue-specific responses of βCaNp binding to (Ca2+)4-CaM1-148, NMR data were collected at 29 °C on a Bruker Avance II 500 or 800 MHz NMR spectrometer with cryoprobe. Samples containing 400 μM 13C,15N-labeled CaM1-148 in complex with 400 μM unlabeled βCaNp in a buffered solution (10 mM d4-imidazole, 100 mM KCl, 10 mM CaCl2, 0.01% NaN3, pH 6.5) were used to collect data sets for the assignments of backbone, side-chain, and intra- and inter-molecular NOEs. The 1H, 15N, 13C resonances of the backbone were assigned using a suite of triple-resonance backbone experiments [HNCA, HN(CO)CA, HN(CA)CB, HN(COCA)CB, HNCO, and HN(CA)CO] 50. 1Hα and other side-chain signals were assigned from 3D H(CCO)NH-TOCSY, C(CO)NH-TOCSY, HCCH-TOCSY, and 13C-edited NOESY experiments 51,52. βCaNp peptide resonances were assigned from the 13C,15N-filtered 2D NOESY (with a mixing time of 120 ms) and TOCSY (with mixing times of 26-52 ms) experiments as previously described 53, and the intermolecular NOEs were assigned by acquiring the 3D 13C-edited and 12C,14N-filtered 3D NOESY experiments 54, with a mixing time of 130 ms. All spectra were processed with NMRPipe 48 and analyzed with CCPN and NMRViewJ software 49 Changes in the amide resonances of the 15N/1HN HSQC spectrum of the (Ca2+)4-CaM1-148–βCaNp complex relative to that of the (Ca2+)4-CaM1-148 without βCaNp were compared using a weighted average of chemical-shift changes (Figure 5B), given by Eq (1).
| (1) |
FIGURE 5.

HSQC spectra of calcium-saturated 13C,15N-CaM1-148 upon addition of βCaNp. (A) Spectra show CaM alone (black) and after the addition of equimolar βCaNp (green) (B). The difference in chemical shift value [Δδ (ppm)] is plotted for each assigned CaM residue (absent bar represents unassigned residue). Bars above graph represent the N-domain residues (blue), linker residues (black) and C-domain residues (red). (C) 15N-T2 value (sec) plotted for each CaM residue. Black arrowhead represents the average T2 value for the complex. (D) Ribbon diagram of Ca2+-CaM1-148 (1CLM.pdb). Thickness of ribbon corresponds to the degree of chemical shift perturbation of a particular residue upon the addition of βCaNp (e.g. thickest diameter corresponds to highest shift perturbation).
CaM Titration of Fl-βCaNp
Titrations of Fl-βCaNp with CaM1-148, CaM1-80 and CaM76-148 were monitored by observing the change in the fluorescence anisotropy of the fluorescein-labeled peptide (Figure 3) using a Fluorolog 3 (Jobin Yvon, Horiba) spectrofluorimeter, equipped with dual auto-assembly Glan-Thompson polarizers. The anisotropy of Fl-βCaNp was monitored using λex 496 nm and λem 520 nm with 2 nm excitation and 10 nm emission bandpasses. Anisotropy (r) was calculated as shown in Eq (2),
| (2) |
where IVV and IVH are the intensities of vertically- or horizontally-emitted light upon vertical excitation, respectively, and G is the instrument correction factor (G= IHV/IHH). Averages of three readings with a 1-s integration time at each point were recorded. Samples of 100 nM Fl-βCaNp in 50 mM HEPES, 100 mM KCl, 50 μM EGTA, 5 mM NTA, 1 mM MgCl2, pH 7.4 in the absence (apo) or presence of 10 mM CaCl2 (calcium-saturated) at 22 °C were titrated with concentrated apo or calcium-saturated CaM. At least three replicate titrations were conducted; averages and standard deviations are listed in Table 2.
FIGURE 3.

CaM titration of Fl-βCaNp. Representative titrations of Fl-βCaNp with apo (open symbols, dashed curves) and calcium-saturated conditions (closed circles, solid curves), with (A) CaM1-80, (B) CaM76-148, and (C) CaM1-148 are shown as normalized fluorescence anisotropy of Fl-βCaNp against the concentration of total CaM. Solutions contained 50 mM HEPES, 100 mM KCl, 5mM NTA, 0.05 mM EGTA, 1 mM MgCl2 total; pH 7.4 ± 10 mM CaCl2. Data points were normalized to endpoints resolved from fits of the data to eq 5. Titration of Fl-βCaNp with apo CaM1-80 and CaM76-148 (A and B open symbols) did not reach saturation; thus calcium was added to predict the final anisotropy value (shown by star). Curves shown are simulations based on eq 3, using the Ka resolved from the fits of the representative data shown (see Table 2). An inset shows normalized anisotropy plotted against the ratio of CaM1-148 (C) to βCaNp.
TABLE 2.
CaM-βCaNp Dissociation Constants
| Protein | Method | Apo | Ca2+-saturateda |
|---|---|---|---|
| CaM1–80 | Experimental | 600 ± 49 μM | 7.06 ± 0.3 μM |
| CaM76–148 | Experimental | 44.10 ± 4.0 μM | 0.96 ± 0.14 μM |
| CaM1–148 | Experimental | 25 ± 2.4 μM | ≤ 1 nM |
| Calculatedb | NA | ~ 1pM | |
| Calculatedc | NA | ΔG = −17.04 kcal/mol Kd = 0.24 pM |
In the presence of 10 mM CaCl2
[Kd(N)*Kd(C)] Product of Kd values for CaM1-80 and CaM76-148 (in the presence of 10 mM CaCl2)
Linkage analysis, see Results sections
Analysis of Equilibrium Constants for βCaNp
Estimates of binding constants for CaM binding to Fl-βCaNp were determined by fitting titration data to a one-site binding model using NONLIN 55. Fractional saturation of Fl-βCaNp was described by Eq (3):
| (3) |
where Ka represents the association constant for CaM binding to βCaNp, and [Xfree] is the free concentration of CaM in solution. That was calculated from the independent variables (total concentration of X, [Xtotal]) and (total concentration of M, [Mtotal]) according to the quadratic equation described by Eq (4):
| (4) |
where b is (1 + Ka[Mtotal] - Ka[Xtotal]). Under equilibrium conditions, the concentration of βCaNp ([Mtotal]) was low relative to the Kd (dissociation constant, 1/Ka) of CaM binding to the peptide. Thus, the free concentration of CaM was approximately the same as the total (i.e., [Xfree] ≅ [Xtotal]. This allowed for an accurate estimate of the association constant. However, under stoichiometric conditions, the ligand was limiting and [Xfree] was estimated iteratively in the nonlinear least squares function for binding [Eq (3)] as the best solution to the difference between [Xtotal] (calculated on the basis of the total ligand added) and [Xbound] (calculated as the product of [Mtotal] and fractional saturation). The value of a binding constant estimated in this way is highly correlated with the precision of the measurement of [Mtotal]; therefore, the dissociation constant of βCaNp for (Ca2+)4-CaM1-148 in Table 2 is reported as a limiting value. Experimental variations in the observed endpoints of individual titration curves were accounted for by Eq (5):
| (5) |
where refers to the average fractional saturation of the peptide as given by Eq (3), and Y[X]low corresponds to the intrinsic fluorescence anisotropy of Fl-βCaNp in the absence of CaM. The Span describes the magnitude and direction of signal change upon titration, which describes the difference between the high (Y[X]high) and low (Y[X]low) endpoints. The Span is positive for an increasing signal.
In most titrations, the upper and lower endpoints were well defined experimentally. However, in the equilibrium titrations of Fl-βCaNp with apo CaM1-80 and apo CaM76-148, the fluorescence anisotropy of Fl-βCaNp did not reach a plateau at the final CaM concentration tested. To estimate the final anisotropy that might have been reached if βCaNp had become saturated with apo CaM, the apo CaM-Fl-βCaNp sample was further titrated with standard buffer containing 1 M CaCl2to a final concentration of 10 mM CaCl2. The upper endpoint of anisotropy signal was fixed at this value in the nonlinear least squares analysis of the affected titrations. In all cases, the addition of calcium to the final solution of apo CaM-peptide was predicted to result in ≥ 98% saturation of the peptide with calcium-saturated CaM. Dissociation constants determined for the interaction of full-length and domain fragments of CaM with βCaNp are reported in Table 2. These equilibrium constants correspond to the horizontal reactions of the thermodynamic linkage scheme below (ΔG = − RT ln (1/Kd)).
Calcium Binding Titrations
Equilibrium calcium titrations of CaM1-148, CaM1-80 and CaM76-148 (all at 6 μM) in the absence or presence of βCaNp (12 μM, 2-fold excess) were monitored using a PTI-QM4 fluorimeter (Photon Technology International, Birmingham, N.J.), with 4 nm excitation and 6 nm emission bandpasses. Calcium titrations were conducted in the presence of X-Rhod-5F or Oregon Green 488 BAPTA-5N (Molecular Probes, Eugene, OR) to monitor the free calcium concentration at each point of the titration as determined using Eq (6) 56.
| (6) |
A Kd of 1.78 μM for X-Rhod-5F (λex of 576 nm, λemof 603 nm) and 32.24 μM for Oregon Green (λex of 494 nm, λemof 521 nm) was determined in 50 mM HEPES, 100 mM KCl, and 1 mM MgCl2 at 22 °C. Orgeon Green was used to determine [calcium] in titrations of CaM alone, and X-Rhod-5F was used for titrations in the presence of βCaNp. Samples of CaM in the absence or presence of βCaNp in 50 mM HEPES, 100 mM KCl, 0.05 mM EGTA, 5 mM NTA and 1 mM MgCl2, pH 7.4 at 22°C were titrated with varying volumes of 5, 50, and 500 mM CaCl2 stocks in matching buffer delivered with a microburet fitted with a 250 μL Hamilton syringe. Fluorescence signals for X-Rhod-5F between approximately 1 and 10 nM [Ca2+]free (within 0 and 10% of the total span) were consistently noisy; therefore, for most titrations, they were manually smoothed using a quadratic polynomial function.
For CaM alone (i.e., in the absence of βCaNp), calcium binding to sites I and II of CaM1-80 and CaM1-148 was monitored by observing a decrease in the intensity of intrinsic fluorescence of phenylalanine residues (λex of 250 nm, λem of 280 nm) as reported previously 15,57, while calcium binding to sites III and IV of CaM76-148 and CaM1-148 was monitored by observing an increase in the intensity of intrinsic fluorescence of the single tyrosine residue (Y138) in site IV (λex of 277 nm, λem of 295 nm).
In the presence of excess βCaNp, calcium-binding to CaM1-80 and CaM76-148 was monitored in the same manner. However, for CaM1-148, binding of βCaNp significantly weakened the net decrease in the intensity of the Phe (250/280) signal from CaM1-148. It was not a reliable indicator of Ca2+ binding to N-domain sites I and II. The single Tyr in the C-domain responded to Ca2+ binding to sites III and IV by increasing in intensity as was the case in the absence of βCaNp. Notably, a second transition of decreasing intensity of the Tyr signal occurred at higher calcium concentrations. This was interpreted as representing calcium binding to sites I and II, as explained below. Three to eight independent titrations of each sample were conducted. Figure 4 (A, B, C and E) shows representative normalized ((F-Fmin)/(Fmax-Fmin)) titrations of CaM in the absence or presence of excess βCaNp.
FIGURE 4.

Equilibrium calcium titrations of CaM in the presence and absence of βCaNp. Titrations of 6 μM CaM1-80 (A), CaM76-148 (B), and CaM1-148 (C & E) in the presence and absence of 12 μM βCaNp, as monitored by changes in the fluorescence intensity of Phe (squares) and Tyr (circles). Curves were simulated using the free energies resolved for calcium binding to CaM in the presence (solid symbols and lines) and absence (open symbols, dashed lines) of βCaNp (Table 3). The curve for calcium binding to sites I and II of CaM1-148 in the presence of βCaNp (E, dotted line) was simulated using free energies corresponding to the decreasing phase of the biphasic Tyr signal as described in Materials and Methods and Results sections. The ligation species with population abundances that were > than 0.05 are shown for (D) CaM alone or (F) in the presence of βCaNp.
Analysis of Free Energy of Calcium Binding
Gibbs free energies for calcium binding to the pair of sites in a CaM domain were determined by nonlinear least squares analysis, using a model-independent Adair function for two sites as shown in Eq (7a):
| (7a) |
where is the average degree of saturation for two sites, K1 describes binding of the first calcium to that domain and is the sum of two intrinsic microscopic binding constants (k1 and k2) that may or may not be equal, K2 is a macroscopic binding constant that describes the total free energy of calcium binding to that domain and is the product of k1, k2, and kc (cooperativity constant), and [X] indicates the concentration of free calcium. This equation describes calcium binding to two potentially non-equivalent, cooperative sites within a domain 58. The parameters ΔG1 and ΔG2 are macroscopic binding free energies, with ΔGi equal to –RT·lnKi. The parameter ΔG2 represents the total free energy of saturating both calcium-binding sites in either domain, while ΔG1 corresponds to the total free energy of saturating one calcium-binding site in either domain.
The equilibrium calcium titration data for CaM1-148 in the absence of βCaNp, and CaM1-80 and CaM76-148 ± βCaNp were fit to the function [f(X)] shown in Eq (7b) using nonlinear least squares analysis 55:
| (7b) |
This allowed fitting of the experimental signal to account for experimental variations in the asymptotes of the titration profiles. As described in Eq (7a), refers to the average fractional saturation of the calcium-binding sites, YX[low] corresponds to the value of the fluorescence intensity of the titration being fit in the absence of calcium, and the parameter Span accounts for the magnitude and direction of the signal change upon titration. Except where noted in Table 3, values for all parameters were fit simultaneously using nonlinear least squares analysis. The quality of each fit was evaluated as described 17,56,57. Averages and standard deviations for the free energies of calcium-binding for each CaM sample tested are reported in Table 3.
TABLE 3.
Free Energies of Calcium Binding to CaM In the Presence of βCaNp
| βCaNp | aΔG1app | aΔG2app | ΔΔG2b | |
|---|---|---|---|---|
| Sites I & II | ||||
|
| ||||
| CaM1-80 | − | −6.02 ± 0.09 | −12.16 ± 0.07 | −0.39 |
| + | −6.34 ± 0.23 | −12.55 ± 0.29 | ||
| CaM1-148 | − | −6.35 ± 0.25 | −12.21 ± 0.06 | −6.09 |
| + | −8.68 (fixed) | −18.30 ± 0.39 | ||
|
| ||||
| Sites III & IV | ||||
|
| ||||
| CaM76-148 | − | −7.32 ± 0.20 | −15.71 ± 0.05 | −2.62 |
| + | −9.21 ± 0.06 | −18.33 ± 0.19 | ||
| CaM1-148 | − | −7.25 ± 0.08 | −16.03 ± 0.04 | −4.75 |
| + | −10.09 ± 0.70 | −20.78 ± 0.27 | ||
Gibbs free energies (in kcal/mol (1 kcal = 4.184 kJ)) are described. Reported free energies and errors represent averages and standard deviations for three or more trials.
ΔΔG2 (kcal/mol) = ΔG2 (βCaNp) - ΔG2 (no βCaNp)
The equilibrium calcium titration data resolved from Tyr fluorescence of CaM1-148 in the presence of βCaNp (Figure 4E) were fit to a biphasic function [f(X)] as shown in Eq (7c) using nonlinear least squares analysis 55:
| (7c) |
where and refer to the average fractional saturation of the calcium-binding sites corresponding to the first (increasing phase) and second (decreasing phase) transitions, respectively. YX[low] is as described above, and SpanA and SpanB account for the magnitude and direction of the signal change of the first and second transitions, respectively. The first transition represented calcium binding to sites III and IV. Because the second transition (TN) was not observed in titrations of CaM76-148 in the presence of βCaNp, it was attributed to calcium binding to sites I and II. Biphasic structural responses of CaM to calcium binding to each domain have been reported for CaM bound to other targets 59, and has been detected using other methods such as proteolytic footprinting 56,60. In some cases (noted in Table 3), it was not possible to determine a unique value of ΔG1, for TN, whereas the evaluation of ΔG2 was very robust. Using NONLIN, a manual grid search was conducted for values of ΔG1 that gave the lowest square root of variance. These free energies correspond to the vertical reactions of the thermodynamic linkage scheme above.
Population Distribution of Ligation Species
In Figures 4D and 4F, the fractional abundance of liganded species of CaM were calculated using the standard equation for a Boltzmann distribution. The probability (fs) of a single species (s) of a macromolecule is given by Eq (8),
| (8) |
where [X] is the ligand activity, ΔGs is the Gibbs free energy (−RT·ln(Ks)) of species s and j represents the stoichiometry of ligand(s) binding to species s. Each free energy (ΔGs) is the sum of intrinsic and cooperative interactions that apply to that species. The denominator of this expression, Z, represents the binding polynomial for the macromolecule.
The partition function describing the 16 possible species of CaM requires four intrinsic equilibrium constants (kI, kII, kIII and kIV) for calcium binding to each site, and at least two intradomain cooperativity terms (kI–II and kIII–IV). More specifically, the binding polynomial Z is (1 + (kI + kII + kIII + kIV)·[X] + (kI·kII·kI–II + kI·kIII + kI·kIV + kII·kIII + kII·kIV + kIII·kIV·kIII–IV)·[X]2 + (kI·kII·kIII·kI–II + kIII·kIV·kIII–IV·kI + kIII·kIV·kIII–IV·kII + kI·kII·kI–II·kIV)*[X]3 + kI·kII·kIII·kIV·kI–II·kIII–IV[X]4). Individual states are expressed as a linear array of 4 digits according to whether each of the four sites is vacant (0) or occupied (1) (e.g., apo CaM is represented as [0000] whereas CaM with sites III and IV occupied is [0011]).
Curves shown in Figures 4D and 4F were simulated using Eq (8) assuming kI = kII, kIII = kIV, and ΔG1 values resolved from fits of the CaM1–148 ± βCaNp data to eq 7b or eq 7c. In the absence of βCaNp, these values were: kI = kII = 5.07E4 M−1; kIII = kIV = 2.35E5 M−1; cooperativity terms kI–II and kIII–IV were 1.73 and 54.39 M−1, respectively. In the presence of βCaNp, these values were: kI = kII = 2.70E6 M−1; kIII = kIV = 2.99E7 M−1; kI–II = 19.90 M−1 and kIII–IV = 11.14 M−1.
Model of βCaNp bound to (Ca2+)4-CaM1-148
Models of PCaM bound to βCaNp were created using MacPyMOL 1.1r1 (DeLano Scientific, CA), based on the coordinates of CaM from 2HQW.pdb, 2JZI.pdb, and 2R28.pdb. The unlabeled βCaNp peptide used in this study was fixed as having α-helical dihedral angles and docked with the CaM molecule in these structures of (Ca2+)4-CaM1-148 with βCaNp oriented such that its single Phe residue (F419) was located close enough to P43 of CaM to be consistent with the strong intermolecular NOEs as observed in the 13C-edited and 12C-filtered 3D NOESY experiments (Figure 7A). This orientation was consistent with additional NOEs observed between the C-domain of CaM and the N-terminal end of βCaNp.
FIGURE 7.

Comparison of the CaM-βCaNp binding interface in three complexes. Ribbon diagram of CaM (N-domain; blue, C-domain; red) bound to βCaNp (green/yellow), stoichiometry and peptide orientation, and location of the sole Phe residue (βCaNpPhe) for the model, (A, βCaNp), the crystal structure (B, αCaNp, 2R28.pdb, *indicates only one CaM-αCaNp unit shown in Figure 1C) and the NMR solution structure (C, αCaNp, 2JZI.pdb). In each structure, I/V at peptide position 5 (yellow) and F at position 20 (green) of βCaNp, P43 (gray), and FLMMN residues (blue; [red for FLMMC residues in C]) are shown. Anti-parallel binding is represented with opposite facing arrows; parallel binding is represented with arrows facing same direction.
Analysis of Structural Contacts
Distances between residues of CaM and the CaM-BDs in several CaM-target structures were calculated using Contacts of Structural Units (CSU) analysis 61. All distances ≤ 4.5 Å were classified as representing a contact regardless of whether it was favorable or not. MacPyMOL 1.1r1 (DeLano Scientific, CA) was used to align the Cα atoms of the FLMM residues 16 in the N-domain of the structural model of (Ca2+)4-CaM1-148-βCaNp described above with other high resolution CaM-peptide complex structures (αCaNp [2R28.pdb and 2JZI.pdb], CNG channel [1SY9.pdb], skMLCK [2BBM.pdb], CaMKK [1CKK.pdb], Cav1.2 [2BE6.pdb], and hRYR1 [2BCX.pdb]), based on the Cα atoms for the corresponding four residues.
Results
The major objectives of this study were to determine stoichiometric, thermodynamic and structural properties governing the calcium-dependent and domain-specific interactions between CaM and the isolated CaM-BD of βCaN. The stoichiometry of this complex was determined using independent methods for measuring reversible association in solution. The free energy of association of CaM with βCaNp was measured using fluorescence anisotropy, and the allosteric effects of βCaNp on the calcium-binding energetics of each CaM domain were estimated from titrations monitored by intrinsic steady-state fluorescence of CaM. The residue-specific responses of 13C-15N-CaM to βCaNp binding, and the orientation of peptide binding in the protein-ligand complex, were determined using NMR spectroscopy.
Stoichiometry of the CaM-βCaNp Complex
For quantitative analysis of the affinity of βCaNp for calcium-saturated CaM1-148, it was essential to determine the stoichiometry of the CaM-βCaNp complex at each set of solution conditions used for studies of calcium and peptide binding. Three hydrodynamic methods were applied. The Stokes radius (Rs) of (Ca2+)4-CaM1-148–βCaNp was determined using analytical gel permeation chromatography (Figure 2A). Whereas the Rs of (Ca2+)4-CaM1-148 (10 μM) was 24.7 ± 0.21 Å, the Rs of the ternary complex [(Ca2+)4-CaM1-148–βCaNp] was 23.3 ± 0.07 Å, indicating that when bound to βCaNp, CaM1-148 adopts a more compact structure than when in isolation. The Rs observed for CaM1-148 in the presence of βCaNp was nearly identical to that of (Ca2+)4-CaM1-148 in complex with melittin (22.9 ± 0.32 Å), another peptide that forms a 1:1 complex with CaM 42. In all cases, the complex eluted as a single symmetric peak, with no evidence of interaction with the column resin.
Additional evidence for the prevalence of a 1:1 complex was provided by sedimentation velocity experiments, in which (Ca2+)4-CaM1-148 was present at a concentration (8.3 μM) similar to that in the experiments described above (Figure 2B). The sedimentation coefficient for (Ca2+)4-CaM1-148–βCaNp was 2.07 s, and the corresponding molecular mass was calculated to be 19.4 kDa, which is nearly identical to the theoretical mass (19.6 kDa) of the complex. That sedimentation coefficient closely matches that of (Ca2+)4-CaM1-148 bound to melittin (2.00 s) 42. The βCaNp- and melittin-bound complexes of peptide bound to CaM1-148 were larger by the same margin than isolated (Ca2+)4-CaM1-148.
The 15N-T2 relaxation times of 15N-(Ca2+)4-CaM1-148 (500 μM) alone were compared to values measured in the presence of a slight excess of βCaNp (Figure 2C) or melittin (Figure 2D). The average T2 values of the complex of CaM bound to βCaNp (0.053 ± 0.006 sec) or melittin (0.050 ± 0.006 sec) were nearly identical, indicating that the two complexes are of similar size. Results from all of the hydrodynamic measurements are summarized in Table 1. All are consistent with the formation of a CaM-peptide complex with a stoichiometry of 1:1.
Affinity of CaM for Fl-βCaNp
As shown in Figure 3, CaM titrations of Fl-βCaNp monitored by fluorescence anisotropy were used to determine the binding affinities of CaM1-80 (N-domain), CaM76-148 (C-domain), and CaM1-148 for Fl-βCaNp, under both calcium-depleted (apo) and calcium-saturated (10 mM CaCl2) conditions. In all cases, the binding of apo CaM was weak. As noted in the Materials and Methods section, it was not possible to saturate Fl-βCaNp with apo CaM1-80 or apo CaM76-148. Therefore, the anisotropy signal of the upper plateau was estimated by adding a saturating level of Ca2+ (indicated by the star on the right axis). As listed in Table 2, the dissociation constant for (Ca2+)2-CaM1-80 binding to Fl-βCaNp (solid curve, Figure 3A) was estimated to be 7.06 μM; this was ~100-fold more favorable than the Kd (600 μM) of apo CaM1-80 binding to Fl-βCaNp (dashed curve). Calcium had a similar effect on CaM76-148 (Figure 3B), where the Kd (0.96 μM) of (Ca2+)2-CaM76-148 binding to Fl-βCaNp (solid curve) was ~50-fold more favorable than that of apo CaM76-148 (44.10 μM) binding (dashed curve). At each level of calcium, binding of Fl-βCaNp to CaM76-148 was favored relative to that of CaM1-80.
Binding of Fl-βCaNp to (Ca2+)4-CaM1-148 was stoichiometric (i.e. there was a limiting concentration of free CaM1-148). Therefore, simulated binding curves (according to eq 3) for several Kd (1/Ka) values were used to estimate an apparent Kd (Kdapp) of Fl-βCaNp for calcium-saturated CaM1-148 (Supplementary Figure 2A). From this analysis, an upper limit for Kdapp was estimated to be 1 nM. The actual Kd value may be more favorable (lower). However, using the estimate of 1 nM, the affinity of Fl-βCaNp for (Ca2+)4-CaM1-148 was at least 105-fold more favorable than its affinity for apo CaM (Figure 3C). Simulations of equilibrium titrations based on the resolved dissociation constants are shown in Supplementary Figure 3. These represent the horizontal reactions in the linkage scheme.
Effect of βCaNp on Calcium Binding to CaM
Binding of peptide and calcium to calmodulin are linked equilibria. Equilibrium Ca2+ titrations were performed to determine how binding of βCaNp affected the calcium-binding properties of CaM1-80, CaM76-148, and CaM1-148 (Figure 4 and Table 3). Changes in the intrinsic fluorescence properties of CaM were used to monitor calcium binding to CaM as described in Materials and Methods. At the conclusion of the titration, the concentration of complex [(Ca2+)4-CaM-βCaNp] was identical to total [CaM]. However, because the affinity of apo CaM for βCaNp was weak, the presence of 2 equivalents of βCaNp did not saturate apo CaM; based on the Kd listed in Table 2, the concentration of complex would be ≤ 14% of total [apo CaM] before addition of calcium. Therefore, the ΔG2 of calcium binding to CaM in the presence of βCaNp is reported as the apparent free energy (ΔG2app).
Calcium binding to the isolated N-domain of CaM is shown in Figure 4A and to the C-domain in Figure 4B. The presence of 2 equivalents of βCaNp (solid symbols) did not significantly change the free energy of Ca2+-binding to sites I and II in CaM1-80 (ΔΔG2app value of −0.39 kcal/mol, Figure 4A) relative to the N-domain alone (open symbols). In contrast, the calcium-binding affinity of sites III and IV of CaM76-148 (Figure 4B) significantly increased in the presence of βCaNp (solid symbols, ΔG2app value of −18.33 ± 0.19 kcal/mol). The ΔΔG2app of −2.62 kcal/mol represents an increase of ~100-fold in calcium-binding affinity of CaM76-148.
The same methods of steady-state fluorescence were applied to monitor calcium titrations of CaM1-148. In the presence of βCaNp, the Tyr signal exhibited a biphasic response (Figure 4E). The increasing phase of this titration represented calcium binding to sites III and IV in the C-domain. A global fit of the biphasic-binding curve according to Eq (7c) showed that the total free energy was −20.78 ± 0.27 kcal/mol (Figure 4E). This ΔG2app value was more favorable by 4.75 kcal/mol than calcium binding to the sites III and IV of CaM1-148 in the absence of βCaNp.
The decreasing phase of the biphasic Tyr signal reported in Figure 4E was interpreted as monitoring calcium binding to sites I and II in the N-domain when βCaNp was bound to CaM1-148 (Materials and Methods). In the analysis according to Eq (7c), the estimate of ΔG2app was −18.30 ± 0.39 for calcium binding to sites I and II of CaM1-148. Thus, binding became more favorable by 6.09 kcal/mol (1.34 kcal/mol greater than the βCaNp-mediated shift observed for sites III and IV). Although βCaNp binding significantly increased the calcium-binding affinities of both domains of CaM1-148, there was still an order-of-magnitude separation between the calcium-binding affinities between the two domains (sites III and IV were filled at a lower [Ca2+] than sites I and II). This predicts that the fractional population of half-saturated CaM-βCaNp complex (i.e., with only the C-domain sites being calcium-saturated) will exceed 50% at a calcium concentration corresponding to the maximal intensity of the Tyr signal (Figure 4E, peak of increasing phase).
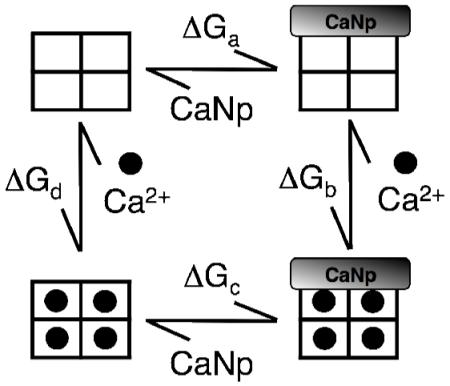
Thermodynamic Linkage Analysis
A thermodynamic linkage diagram depicting calcium and peptide binding to CaM was shown in Materials and Methods. Conservation of energy (ΔGa + ΔGb = ΔGc + ΔGd) requires that the sum of energies of ΔGa (peptide binding to apo CaM) and ΔGb (calcium binding to a peptide-CaM complex) be equal to the sum of ΔGc (calcium binding to CaM) and ΔGd (binding of peptide to calcium-saturated to CaM); therefore, the value of one can be calculated from the other three. Using estimates of the binding affinity of apo CaM1-148 for βCaNp (Table 2), and knowledge of the calcium-binding affinity of each pair of sites in CaM1-148 in the absence and presence of peptide (Table 3), it was possible to calculate the total free energy of βCaNp binding to (Ca2+)4-CaM1-148 (−17.04 kcal/mol). This corresponded to a Kd value of ~1 pM, 3 orders of magnitude lower than the upper limit of 1 nM estimated from the experimental stoichiometric data that were limited by signal-to-noise ratio for the peptide anisotropy.
βCaNp binding to (Ca2+)4-CaM Monitored by NMR
Figure 5A shows an overlay of 15N/1HN-HSQC spectra of (Ca2+)4-CaM alone (black) and with saturating βCaNp (green) which binds to (Ca2+)4-CaM1-148 in slow exchange on the NMR scale, due to the high affinity of this interaction (Kd of ≤ 1 nM). βCaNp binding caused dramatic chemical shift perturbations of the CaM resonances, as shown in Figure 5A. The backbone resonances of (Ca2+)4-CaM1-148 had been assigned previously 62; those of CaM1-148 in the (Ca2+)4-CaM-βCaNp complex were assigned in this study to identify the residue-specific chemical shift perturbations. Preliminary backbone assignments were made using the PINE server (www.pine.nmrfam.wisc.edu); they were then checked manually and corrected based on intra-residue spin systems and inter-residue connectivities resulting in assignment of 97% of backbone resonances. Residue-specific chemical shift perturbations are shown in Figure 5A. A small subset of residues is labeled to illustrate peak movement.
A bar graph illustrating the absolute chemical shift perturbations of each resonance that resulted from βCaNp binding to (Ca2+)4-CaM1-148 is shown in Figures 5B. Our analysis indicated that, on average, (a) residues in the N-domain (1-75) were more significantly perturbed (Δ ppmN = 0.22) than residues in the C-domain (81-148, Δ ppmC = 0.12) and (b) the linker region (residues 76-80) between domains experienced the largest chemical shift perturbations (Δ ppmLinker = 0.77) (Figure 5D). These data with the determined stoichiometry of 1:1 for (Ca2+)4-CaM1-148-βCaNp suggest that this complex adopts a tertiary structure with a canonical “wrap-around” fold similar to the CaM/αCaNp complex (Figure 1D)].
Orientation of βCaNp Bound to CaM
The orientation of βCaNp bound to the two domains of (Ca2+)4-CaM1-148 was determined by assigning the unlabeled βCaNp in the (Ca2+)4-CaM1-148-βCaNp complex and selectively assigning the unambiguous intermolecular NOEs between βCaNp and CaM. In this endeavor, we took advantage of the unique residues present in this complex. For example, the sole aromatic residue of βCaNp, F419, located near the C-terminus of the peptide, can be easily identified from the doubly 14N- and 12C-filtered 2D NOESY and TOCSY spectra. The aromatic ring protons of F419 exhibited more than a dozen NOEs to CaM in the 13C-edited and 13C,15N-filtered 3D NOESY spectrum. In particular, F419 gave strong NOEs to a proline spin system in CaM. There are only two Pro residues in CaM, and both are located in the N-domain, with P43 situated in the target binding pocket and P66 located near the Ca2+-binding loops. Since the Pro residues have been assigned, these intermolecular NOES can be unambiguously assigned to P43 as shown in Figure 6. Therefore, these data clearly indicate that βCaNp binds to (Ca2+)4-CaM in an anti-parallel fashion with the C-terminal peptide interacting with the N-domain of CaM.
FIGURE 6.

Slices of the 3D NMR spectra collected on calcium-saturated 13C,15N-CaM1-148 in complex with the unlabeled βCaNp. (A and D) slices from 13C-edited and 12C,14N-filtered 3D NOESY spectrum. (B and E) slices from 3D HCCH-TOCSY spectrum. (C and F) slices from 13C-edited 3D NOESY spectrum. Panels A-C were taken at the Cα of P43, while panels D-F were taken at the Cα of P43. The 1H assignments are indicated at the top. Intermolecular NOEs are labeled.
We have also partially assigned the other sidechains of CaM using C(CO)NH-TOCSY and HCCH-TOCSY experiments and other intermolecular NOEs. Some of these assigned intermolecular NOEs are included in the supplementary materials. For example, the side chain of A88 and V91 in the C-domain of CaM, as well as V35 in the N-domain, were found to make contacts with I412 in βCaNp (Supplementary Figures 4-6). These contacts further support the orientation initially determined based on intermolecular NOEs between CaM P43 and βCaNp F419. These contacts also support a “wrap-around” structure. In the extended form of (Ca2+)4-CaM1-148 (1CLM, Figure 1B) the V35 sidechain is more than 30Å away from A88 and V91, making it impossible for both regions to simultaneously contact I412 in βCaNp. In the representative “wrap-around” structure (2JZI, Figure 1D), these same sidechains come within 5Å of one another.
These results clearly showed that the Ca2+-saturated 1:1 CaM-βCaNp complex exhibited anti-parallel peptide binding — the C-terminal end of the peptide interacted with the N-domain of CaM, and vice versa. It is beyond the scope of this study to determine a structure of the CaM-βCaNp complex using NMR. However, based on the observed contacts, a model of βCaNp docked to (Ca2+)4-CaM1-148 was made using PyMol (Figure 7A). We compared features of the CaM-peptide interface in this model to those observed previously in an analysis of 13 ellipsoidal CaM-peptide complexes. In those, all but one BAA motif CaM-BD was observed to bind to CaM in an anti-parallel conformation. For BAA motifs having a single aromatic amino acid, that F, Y, or W was observed to contact a tetrad of CaM residues (FLMMC) that defined a common hydrophobic pocket in the C-domain; none interacted with the corresponding pocket (FLMMN) in the N-domain 16.
The HSQC NMR analysis showed that three (F19, M51, M71) of the four FLMMN residues of (Ca2+)4-CaM1-148 were significantly perturbed upon βCaNp binding (Figure 5B). This suggests that these residues of the N-domain underwent conformational change upon association with βCaNp, possibly affected by the presence of F419, a bulky residue. The FLMMC residues of (Ca2+)4-CaM1-148 were not significantly perturbed, indicating that βCaNp binding results in little further conformational change in this pocket.
Comparison of CaM binding to βCaNA and αCaNA
Sequences of the CaM-BDs of the α- and β-isoforms of CaN are almost identical (Figure 1A), with a single difference at position 6, which is Val in αCaNp and Ile in βCaNp. Therefore, it is of interest to compare this NMR analysis of (Ca2+)4-CaM-βCaNp to the three deposited structures of (Ca2+)4-CaM bound to αCaNp (residues 391-414).
Two independent crystallographic studies found a 2:2 stoichiometry of (CaM-αCaNp)2 (2W73.pdb and 2R28.pdf), with the N-domain of one CaM molecule (N1) and the C-domain of the second (C2) engulfing αCaNp1 (and vice versa, i.e. N2-C1 engulfing αCaNp2)63-65. Although this is a tetramer (see Figure 1C) that is larger than what was observed for βCaNp binding to CaM, the anti-parallel binding orientation of the peptide with respect to the CaM domains is the same as in our model.
Contacts of Structural Units (CSU) analysis of 2R28.pdb (Supplementary Figure 7) revealed that residues I400 and I403 of αCaN were identified as having the highest number of contacts with the C-domain of CaM, interacting with CaM in a manner similar to Ile residues of CaMKIIp (1CDM.pdb). Residue F410 of αCaNp was close to the CaM N-domain pocket (Figure 7B), making contacts with three FLMMN residues (F19, M51, and M71). In 2R28.pdb, the distance (9 Å) between F410 and P43 is too far to produce the strong NOEs that were observed in (Ca2+)4-CaM-βCaNp. Therefore, despite their shared orientation, there are structural differences between the interaction surface in (Ca2+)4-CaM-βCaNp and ((Ca2+)4-CaM-αCaNp)2. Positions of the single aromatic in each CaN peptide are shown relative to nearby CaM residues in the righthand panels of Figure 7. Notably, in 2R28, the residue at position 6 of αCaNp makes no contacts within 4.5 Å of either domain of CaM, making it unlikely to be a determinant of orientation or stoichiometry for CaM binding.
A deposited structure of CaM-αCaNp determined by NMR (Figure 1D, 2JZI.pdb, no publication) has a CaM-peptide stoichiometry of 1:1, but the peptide was bound in a “parallel” orientation. The sole aromatic residue (F410) of αCaNp (corresponding to F419 in βCaNp) interacted with the C-domain pocket of CaM (Figure 7C). This orientation was not observed in (Ca2+)4-CaM-βCaNp.
Contacts Between CaM Clefts and BAA Motifs
In complexes of CaM bound to BAA motifs such as those found in the NMDA Receptor NR1C1 (2HQW), high resolution structures show that the hydrophobic cleft of the C-domain is occupied by an aromatic sidechain of the peptide16,66. In Figure 8A, the aromatic residues in 8 CaM-BDs are listed according to the domain of CaM that is contacted (e.g., in the CNG sequence, a tryptophan (W) contacts the N-domain while a phenylalanine (F) sidechain contacts the C-domain of CaM). CaMKII is unusual by having no aromatic residues in the CaM-BD. Thus, the CaM-βCaNp complex contrasts with this by having the N-domain of CaM making the highest number of interactions with the sole aromatic residue (F419) of the peptide. Further structural and enzymatic experiments are necessary to determine how this unique feature of βCaNp binding contributes to the activation of CaN by CaM.
FIGURE 8.

Comparison of CaM-Binding Domain Contacts and Structures. (A) Predicted CaM-binding motifs versus actual contacts observed in structures. Numbers represent the CaM-binding motifs predicted using classical methods. Residues highlighted in gray were both predicted and observed to serve as CaM contacts. Residues highlighted in yellow were falsely predicted. Residues with black bars were not predicted, but served as major anchor residues in structures. The aromatic contact occupying either the N-domain (blue) or the C-domain (red) is shown. (B) Position of the N-domain aromatic residue of the CaM-binding domain of the CNG channel (blue, 1SY9.pdb), skMLCK (orange, 2BBM.pdb), CaMKK (magenta, 1CKK.pdb), CaV1.2 (gray, 2BE6.pdb), hRYR1 (black, 2BCX.pdb) and αCaNp (cyan, 2R28.pdb and red, 2JZI.pdb), and βCaNp (green, Model). Structures were aligned based on the Cα atoms of the N-domain FLMM residues. (C) The locations of the aromatic residues shown in (B) relative to F19 of the N-domain FLMM tetrad.
Classical sequence comparison methods 21 for identifying canonical CaM-BDs predict that for αCaNp that residues corresponding to positions 1-5-8-14 (I396, I400, I403, and V419) serve as primary CaM contacts. However, CSU analysis of 2R28.pdb also identified the C-terminal Phe residue (F410) as mediating several CaM contacts (Supplementary Figure 7). For comparison, we conducted CSU analysis of eight CaM-target complexes (seven BAA-motifs, and one IQ motif) 16 and ranked the residues predicted to form multiple contacts with those actually observed in high resolution structures (Figure 8A, gray boxes). Although there was much agreement between predictions and observations, there were cases in which a residue in CaM predicted to have many close contacts with a target protein did not. These false positives are shown in Figure 8A as yellow boxes below the gray box. Some of the residues with multiple contacts identified by the CSU analysis of experimental data had not been predicted by classical sequence-matching methods. These false negatives are shown in Figure 8A as black boxes above the gray box.
The structural model CaM-βCaNp complex presented here is one in which the sole aromatic residue (F) of the target preferentially binds to the N-domain of CaM. Although there are high resolution structures available for several CaM-target complexes in which one aromatic residue of the target occupies the FLMMN pocket, these examples also have an aromatic residue in the FLMMC pocket of CaM. To determine whether there are differences in how the FLMMN pocket is utilized when only one aromatic residue is present in the target sequence, we compared the structural model of the CaM-βCaNp complex with other structures containing aromatic residues contacting the N-domain. These included CaM bound to the CaM-BD of the CNG channel (1SY9.pdb), skMLCK (2BBM.pdb), CaMKK (1CKK.pdb), Cav1.2 (2BE6), and hRYR (2BCX.pdb).
When the Cα atoms of the FLMMN residues were aligned, significant differences in the positions of the aromatic residues were observed (Figure 8B). With the exception of residue F419 of βCaNp in the model shown in Figure 7A (green) and residue F410 of αCaNp in the 2R28.pdb structure (cyan), each aromatic residue occupies the same position relative to the FLMMN pocket, suggesting the N-domain of CaM contacts CaNp in a manner distinguishable from other targets. In addition, the position and orientation of the aromatic residue of the peptide relative to F19 of CaM is unique for the Phe residue of βCaNp (Figure 8C). In the structural model in Figure 7A, F419 of βCaNp is > 10 Å from F19 of CaM, and is pointing away from the FLMMN pocket, while the canonical anchor residues found in other BAA motif CaM-BDs are ~5 Å from F19. This suggests that the N-domain of CaM recognizes the sole Phe residue of βCaNp in a unique manner.
Discussion
CaN, a CaM-regulated heterodimeric phosphatase, is found in all eukaryotes. It is known to have a role in calcium dynamics and chemotaxis in Paramecium 3, fungal virulence 67 and numerous disease states of humans including cardiac hypertrophy, and immunosuppression 6. Two CaN isoforms (α and β) are both abundant in brain and heart. The identified CaM-BD of CaN is in a region of the catalytic subunit (CaNA) that is intrinsically disordered or highly mobile in the high resolution structure of αCaN and close to the AID (auto-inhibitory domain; Figure 1). The CaM-BD sequence of α CaN has been observed to adopt a helical structure similar to those observed for other BAA motif CaM-BDs despite their limited sequence homology 68-70. Even within the same family of target proteins having highly similar sequences, subtle differences in the network of contacts between CaM and its CaM-BDs may result in thermodynamically reversed differences in calcium-dependent affinity for a similar target (cf. voltage-dependent sodium channels NaV1.2 71 and NaV1.5 72).
For some CaM-target interactions, differences in subcellular location and concentration contribute to the order and extent of target activation by CaM 31,32. In other cases, CaM discriminates between co-localized targets by preferentially using its N- or C-domain, or binding when partially calcium-saturated. It is well established that CaM binding to the CaM-BD of CaN relieves auto-inhibition, thereby increasing catalytic activity. Although the general features of this allosteric interaction have been well characterized, little was known about whether and how the two domains of CaM have distinct roles in recognition of βCaN. We have explored calcium-dependent interactions and provide the first evidence showing sequential calcium binding to the complex, and the orientation of βCaNp bound to (Ca2+)4-CaM.
Energetics of CaM Binding to βCaNp
Three independent hydrodynamic studies (Stokes radius, sedimentation coefficient, and NMR T2; Figure 2) demonstrated that the (Ca2+)4-CaM-βCaNp complex formed a 1:1 complex with a conformation nearly identical to that of (Ca2+)4-CaM1-148 bound to melittin. Values of 15N-T2 determined by NMR provided residue-specific information showing that the linker residues (76-80) were more constrained in (Ca2+)4-CaM-βCaNp than CaM alone. Data were consistent with a peptide-induced collapse of CaM from an extended to a compact ellipsoidal conformation, as shown in Figure 1D.
A comparison of the binding affinities of apo and calcium-saturated CaM1-148, CaM1-80, and CaM76-148 for βCaNp provided insight into the domain-specific and calcium-dependent mechanisms by which CaM associates with βCaNp. For all titrations in the absence of calcium, CaM binding to βCaNp was weak (Kd of 25 μM for CaM1-148, 44 μM for CaM76-148 and 600 μM for CaM1-80), in agreement with previous reports indicating that CaN activation by CaM requires calcium 9. Although the calcium-saturated C-domain fragment of CaM had a slightly higher affinity for βCaNp than did the N-domain fragment (Kd of ~1 vs 7 μM, respectively), only CaM1-148 had high affinity for the peptide. Because experimental titrations were stoichiometric at the concentration of peptide used, a limiting value (≤ 1nM) of the dissociation constant was reported in Table 3. The value was consistent with the limit of 0.1 nM reported by Hubbard and Klee based on equilibrium competition experiments 35.
Although the sensitivity of fluorescence anisotropy for measuring equilibrium binding titrations limited the range of free energies that could be determined directly, a more accurate estimate was calculated by applying thermodynamic linkage analysis to free energies estimated from titrations conducted under equilibrium conditions (e.g., βCaNp binding apo CaM and calcium-binding titrations of CaM with and without peptide). A dissociation constant for the (Ca2+)4-CaM1-148-βCaNp complex was estimated to be ~1 pM (Table 2). This is a self-consistent estimate and is close to the avidity of 7 pM that would result if each domain fragment of CaM bound independently to the peptide (i.e., the product of Kd values for the C- (1 μM) and N-domain (7 μM) corresponds to a Kd of 7 pM for CaM1-148, the covalent linkage of the N- and C-domains).
However, it is about an order of magnitude more favorable than the value (28 pM) reported by Quintana et al 36 who estimated affinity of CaM for full-length CaN by taking the ratio of rate constants. The difference may reflect differences in accessibility of residues in the CaM-BD in CaN versus their exposure in βCaNp, or it may reflect limits of detection because high-affinity interactions are notoriously difficult to measure accurately. Although the energetics may differ, the structure of CaM bound to a CaM-BD peptide and its corresponding full-length target may be identical, as demonstrated by Wand and coworkers for CaM binding to CaMKI 73,
Effects of βCaNp on Calcium Binding
The association of CaM with a target protein or drug alters calcium-binding properties in a direction and with a magnitude that selectively affects individual targets. Targets that have BAA motifs generally increase the calcium affinity of CaM by promoting conformational changes in the relative orientation of paired helices that comprise each domain and are propagated to the Ca2+-binding loops. However, other target sequences, such as IQ motifs found in neuromodulin, neurogranin, myosin and many ion channels, usually decrease calcium affinity by binding preferentially to apo CaM 74.
Intrinsic Phe and Tyr fluorescence intensities were used to determine how the calcium affinity of CaM1-80, CaM76-148 and CaM1-148 changed when bound to βCaNp. Because of the weak affinity of βCaNp for each domain fragment, it was expected that βCaNp would have little effect on the calcium affinities of sites I and II in CaM1-80 (Figure 4A). Essentially this titration was monitoring free CaM1-80. βCaNp had a small effect on CaM76-148 where the free energy of calcium binding to sites III and IV became more favorable by 2.03 kcal/mol (Figures 4B). This difference between CaM1-80 and CaM76-148 was expected because Fl-βCaNp bound 7-fold more favorably to CaM76-148.
In the calcium titration of CaM76-148 bound to βCaNp, the fluorescence intensity of Tyr increased monotonically and reached a plateau at high calcium. In the absence of peptide, the intensity of Tyr in CaM1-148 is similarly monotonic, and unaffected by calcium binding to the N-domain 15. In contrast, calcium binding to a complex of CaM1-148 and βCaNp caused a conformational change in CaM whereby a standard calcium-dependent increase in Tyr intensity (corresponding to Ca2+-binding to sites III and IV) was followed by a subsequent decrease corresponding to calcium binding to the N-domain sites I and II. This calcium-induced reversal of intensity provides additional evidence that interdomain interactions are altered by βCaNp binding.
βCaNp significantly increased the calcium affinity of both the N- and C-domains of CaM1-148 (Figures 4C and 4E). The changes in free energy of calcium binding (6.09 kcal/mol for the N-domain and 4.75 kcal/mol for the C-domain) retained the property of sequential binding of calcium to the domains. The distribution of calcium-ligation species for CaM alone (Figure 4D) and for CaM bound to βCaNp (Figure 4F) were similar, with the population of intermediate species of CaM shifting from completely apo (denoted 0000), to having sites III and IV filled (0011), to having all sites saturated (1111) as a function of increasing levels of calcium. However, midpoints of titrations significantly shifted when CaM bound βCaNp, indicating lower calcium concentrations were required to saturate calcium-binding sites. The most abundant intermediate (0011) was maximally populated at a much lower Ca2+ concentration (27 nM vs. 2 μM), but to a similar extent (60% vs. 70%) as in CaM alone. Simulated titration curves for calcium binding to each domain are shown in Figure 9A. Sequential binding to the C- and N-domains contrasts quantitatively with effects of CaM targets such as CaMKII that increase Ca2+-binding affinity in both domains such that they become equivalent (see Figure 9B) 59,75,76, or to effects of IQ motifs that selectively lower calcium-binding affinity of the C-domain, as shown in Figure 9C. We hypothesize that retaining sequential calcium-binding affinity when bound to βCaNp makes each domain of CaM poised to act on CaN at different calcium levels 77,78. βCaNp-induced allosteric changes in the domain-specific calcium affinity of CaM may contribute to mechanisms of regulation of CaN during fluxes in cellular calcium levels.
FIGURE 9.

Fractional saturation curves plotted against [Ca2+]Free representing simulations of calcium binding to sites I & II (blue line) and sites III & IV (red line) of CaM1-148 in the presence of (A) βCaNp, (B) CaMKIIp and (C) NaV1.2p with free energies reported in Table 2 (βCaNp), and values previously published for CaMKIIp (Evans & Shea, 2009) and NaV1.2p (Theoharis et al, 2008). The curve for calcium binding to sites I and II of CaM1-148 in the presence of βCaNp (A, red line) was simulated using free energies corresponding to the decreasing phase of the biphasic Tyr signal as described in Materials and Methods and Results sections. The ligation species corresponding to apo (0000), sites I & II filled (1100), sites III & IV filled (0011) and all sites filled (1111) are shown for CaM in the presence of (D) βCaNp, (E) CaMKIIp and (F) NaV1.2p.
Analysis of βCaNp-induced differences in (Ca2+)4-CaM1-148 (Figure 5A) by 14N/1HN-HSQC chemical-shift mapping (Figure 5B) showed significant global perturbations. The average change in chemical shift for residues in the N-domain (residues 1-75, Δ ppmN = 0.22) was 1.8 times that for the residues in the C-domain (residues 81-148, Δ ppmC = 0.12), but residues within the linker (76-80) underwent the largest average chemical shift perturbation (Δ ppmLinker = 0.77). The large change of the linker and a greater perturbation of the N-domain than the C-domain is similar to what had been observed for association of CaM with melittin 76. These NMR data, coupled with fluorescence signals observed during calcium titrations, suggest tertiary rearrangement of the two domains of CaM upon association with βCaNp and structural evidence for changes in interdomain cooperativity.
Comparison to CaMKII
Although CaN and CaMKII are target proteins that have opposing intracellular functions (phosphatase versus kinase), they regulate shared targets (such as NF-AT) and are activated by Ca2+-saturated CaM. As shown in Figure 8A, both βCaNp and CaMKIIp rely on non-aromatic residues to contact the C-domain of CaM. The measured limit for the affinity of (Ca2+)4-CaM for βCaNp is within the range of Kd values (nM to subpicomolar) reported for (Ca2+)4-CaM binding to a CaM-BD CaMKIIp 59,79. Comparing studies of CaM domain fragments binding to βCaNp and CaMKIIp conducted under identical soluiton conditions, we noted that (Ca2+)2-CaM76-148 bound to both peptides with a Kd of 1 μM (0.95 in Table 2 of 57, vs. 0.96, Table 2, this study). Binding of (Ca2+)2-CaM1-80 to these same peptides was less favorable but more favorable for βCaNp (7 μM) than for CaMKIIp (~33 μM).
Recent reports addressing the interactions of CaM with CaN and CaMKII in ventricular myocytes suggest that slight differences in affinity enable CaM to respond differentially to Ca2+ signals, and thus to activate one pathway over the other 80,81. This emphasizes the value of understanding differences in the CaM binding affinity for distinct CaM-BD sequences. These energetics govern the intricate balance of protein-protein interactions in CaM-mediated signaling.
Classical CaM-Binding Motifs
In a previous analysis of 17 canonical CaM-target complexes using the Contacts of Structural Units program (CSU), aromatic residues of target sequences were observed to preferentially utilize the CaM C-domain, rather than the N-domain, as their target-docking site, and to do so exclusively when only one aromatic residue was present in the target sequence 16. This interaction involved a tetrad of residues in the CaM C-domain (FLMMC); these form a hydrophobic pocket that accommodates the anchor residue(s) of many targets analyzed. The anchor residue tends to be an aromatic amino acid. Although there is an equivalent pocket in the N-domain (FLMMN), it is not utilized as frequently or as consistently. The interaction of βCaNp with CaM is notable for having the sole aromatic residue interact with the N-domain; but it does not make canonical contacts observed for other BAA motif sequences.
There are discrepancies between residues in a target CaM-BD that are predicted and observed to be at the interface with CaM. This suggests that common motif-recognition approaches to predict CaM-BDs based on primary sequence alone may have excluded essential residues, while over-emphasizing the contributions of others. This should be considered when analyzing sequences of newly identified proteins, and designing experiments aimed at evaluating CaM-target interactions.
Summary
CaM forms an equimolar, anti-parallel complex with the CaM-BD of βCaN; the complex is energetically very favorable and calcium binding to both domains of CaM is enhanced by formation of a complex with βCaNp. However, the intrinsic property of sequential calcium binding to the domains of CaM is preserved, favoring sites III an IV. Some reports have suggested that regions outside of the canonical CaM-BD of CaNA may experience CaM-dependent regulation 13,14. Based on thermodynamic and structural data presented here, we speculate that the N-domain of CaM serves a unique role in the regulation of CaN by responding to higher calcium level than the C-domain, and that it contributes to differentiation among many CaM targets.
Supplementary Material
Sedimentation velocity experiment of 8.3 μM (Ca2+)4-PCaM1-148 in the presence of a slight excess of Fl-bCaNp. Sedimentation of Fl-βCaNp was monitored by absorbance at 494 nm using a Beckman XL-I analytical ultracentrifuge. Data analysis is described in Materials and Methods. Sedimentation data fit using SEDFIT 43,44 with model of a single species. The resulting molecular mass (19.4 kDa) corresponded closely with the theoretical mass (19.6 kDa) and not to a 2:2 (39.2 kDa) or 1:2 (22.4 kDa) complex.
(A) Change in fluorescence anisotropy of Fl-βCaNp upon titration with CaM1-148 in the presence of saturating calcium. The normalized anisotropy is plotted against the ratio of CaM1-148 to βCaNp. Curves through the data were simulated to a one-site binding isotherm for several Kd values: 1 pM (solid line), 1 nM (dotted line), 10 nM (large dashed line), and 100 nM (dotted/dashed line). Inset shows a detail view of the data near the break point. (B) To illustrate the separation in Kd values, simulated curves were plotted as a function of [CaM]Free.
Fractional saturation curves plotted against [CaM]Free representing simulations of CaM1-148 (black), CaM76-148 (red) and CaM1-80 (blue) in the presence (A, calcium-saturated) or absence (B, Ca2+-depleted) of 10 mM CaCl2 binding to Fl-βCaNp with equilibrium constants reported in Table 2.
Intermolecular NOEs between the protons of I412 of βCaNp and A88 protons of 13C,15N-CaM1-148. NOEs detected from the A88 Cα (A-C) and Cβ (D-F). Shown are (A, D) 13C filtered NOESY spectra (βCaNp protons), (B, E) HCCH-TOCSY spectra (CaM protons), and (C, F) 13C NOESY spectra (all protons). Peptide shifts are indicated by black lines and text while CaM shifts are indicated in red. The arrow in panel D points to a weak intermolecular NOE.
Intermolecular NOEs between the protons of I412 of βCaNp and the γ2 methyl proton of residue V35 from 13C,15N-CaM1-148. Shown are (A) 13C filtered NOESY spectra (βCaNp protons), (B) HCCH-TOCSY spectra (CaM protons), and(C) 13C NOESY spectra (all protons). Peptide shifts are indicated by black lines and text while CaM shifts are indicated in red.
Intermolecular NOEs between the protons of I412 of βCaNp and the V91 beta protons of 13C,15N-CaM1-148. Shown are (A) 13C filtered NOESY spectra (βCaNp protons), (B) HCCH-TOCSY spectra (CaM protons), and (C) 13C NOESY spectra (all protons). Peptide shifts are indicated by black lines and text, while CaM shifts are indicated in red.
Distribution of CaM contacts in the CaM-αCaNp complex in 2R28.pdb. (A) Sequence map of CaM residues within 4.5 Å of individual residues of αCaNp1 and αCaNp2 in crystallographic 2:2 structure in 2R28.pdb. Residues highlighted in yellow represent the FLMM residues of CaM. The 1-5-8-14 BAA motif residues of βCaNp are shaded in gray. In both CaM-βCaNp complexes, F410 (boxed) had the highest number of contacts to a single N-domain. Residues 391-395 of αCaNp2 made no contacts with CaM. Residues located at the terminal ends of the peptide, which had no contact with CaM, are not shown. Occupancy of the (B) N-domain FLMM pocket and (C) C-domain FLMM pocket by F410 (green) and I400 and I403 (gray) anchor residues.
Acknowledgments
We would like to thank Claude Klee for a gift of βCaNp used in preliminary studies, Brenda Sorensen for performing initial Ca2+-binding and NMR studies, and the University of Iowa Carver College of Medicine NMR Facility for implementing pulse sequences used for backbone assignments. We thank the reviewers for constructive suggestions.
Abbreviations
- BAA
Basic amphipathic α-helix
- CaM
Calmodulin
- CaM1—148
CaM full-length, residues 1-148
- CaM1—80
CaM N-domain fragment, residues 1-80
- CaM76—148
CaM C-domain fragment, residues 76-148
- CaM-BD
CaM-binding domain
- CaN
Calcineurin
- CaNA
A subunit of calcineurin
- CaNB
B subunit of calcineurin
- αCaNp
CaM-binding domain of CaNA (residues 391-414 of the α isoform)
- βCaNp
CaM-binding domain of CaNA (residues 400-423 of the β isoform)
- EGTA
Ethylene glycol bis(α-aminoethyl ether)-N, N, N’, N’-tetraacetic acid
- HEPES
N-(2-hydroxy-ethyl)piperazine-N’-2-ethanesulfonic acid
- HSQC
Heteronuclear single quantum correlation
- mCaM
Mammalian CaM
- NOESY
Nuclear Overhauser effect spectroscopy
- PCaM
Paramecium CaM
- Phe
Phenylalanine
- T2
Transverse relaxation
- TOCSY
Total correlation spectroscopy
- Tyr
Tyrosine
Footnotes
These studies were supported by a Univ. of Iowa Center for Biocatalaysis and Bioprocessing Fellowship and an American Heart Association Predoctoral Fellowship to S.E.O., a grant from the Roy J. Carver Charitable Trust to L.Y. (01-244) and a grant from the National Institutes of Health (RO1 GM 57001) to M.A.S.
SUPPORTING INFORMATION AVAILABLE – Figures include simulated binding curves of βCaNp binding to CaM and fractional saturation curves, NOESY data indicating additional CaM-βCaNp contacts, and a diagram depicting CSU analysis of 2R28.pdb. This material is available free of charge via the Internet at (enter correct URL for journal).
References
- 1.Klee CB, Krinks MH. Purification of Cyclic 3′,5′-Nucleotide Phosphodiesterase Inhibitory Protein by Affinity Chromatography on Activator Protein Coupled to Sepharose. Biochemistry. 1978;17(1):120–125. doi: 10.1021/bi00594a017. [DOI] [PubMed] [Google Scholar]
- 2.Stewart AA, Ingebritsen TC, Manalan A, Klee CB, Cohen P. Discovery of a Ca2+ -and Calmodulin-Dependent Protein Phosphatase Probable identity with calcineurin (CaM-BP80) FEBS Lett. 1982;137(1):80–84. doi: 10.1016/0014-5793(82)80319-0. [DOI] [PubMed] [Google Scholar]
- 3.Fraga D, Sehring IM, Kissmehl R, Reiss M, Gaines R, Hinrichsen R, Plattner H. Protein phosphatase 2B (PP2B, calcineurin) in Paramecium: Partial characterization reveals that two members of the unusually large catalytic subunit family have distinct roles in calcium dependent processes. Eukaryot Cell. doi: 10.1128/EC.00322-09. [DOI] [PMC free article] [PubMed] [Google Scholar]
- 4.Cyert MS. Calcineurin signaling in Saccharomyces cerevisiae: how yeast go crazy in response to stress. Biochemical and Biophysical Research Communications. 2003;311(4):1143–1150. doi: 10.1016/s0006-291x(03)01552-3. [DOI] [PubMed] [Google Scholar]
- 5.Kraus PR, Heitman J. Coping with stress: calmodulin and calcineurin in model and pathogenic fungi. Biochemical and Biophysical Research Communications. 2003;311(4):1151–1157. doi: 10.1016/s0006-291x(03)01528-6. [DOI] [PubMed] [Google Scholar]
- 6.Rusnak F, Mertz P. Calcineurin: form and function. Physiol Rev. 2000;80(4):1483–1521. doi: 10.1152/physrev.2000.80.4.1483. [DOI] [PubMed] [Google Scholar]
- 7.Hubbard MJ, Klee CB. Functional Domain Structure of Calcineurin A: Mapping by Limited Proteolysis. Biochemistry. 1989;28:1868–1874. doi: 10.1021/bi00430a066. [DOI] [PubMed] [Google Scholar]
- 8.Hashimoto Y, Perrino BA, Soderling TR. Identification of an autoinhibitory domain in calcineurin. J Biol Chem. 1990;265(4):1924–1927. [PubMed] [Google Scholar]
- 9.Klee CB, Draetta GF, Hubbard MJ. Calcineurin. AdvEnzymol. 1988;61:150–200. doi: 10.1002/9780470123072.ch4. [DOI] [PubMed] [Google Scholar]
- 10.Perrino BA, Ng LY, Soderling TR. Calcium regulation of calcineurin phosphatase activity by its B subunit and calmodulin. Role of the autoinhibitory domain. JBiolChem. 1995;270:340–346. doi: 10.1074/jbc.270.1.340. [DOI] [PubMed] [Google Scholar]
- 11.Kissinger CR, Parge HE, Knighton DR, Lewis CT, Pelletier LA, Tempczyk A, Kalish VJ, Tucker KD, Showalter RE, Moomaw EW, et al. Crystal structures of human calcineurin and the human FKBP12-FK506-calcineurin complex. Nature. 1995;378(6557):641–644. doi: 10.1038/378641a0. [DOI] [PubMed] [Google Scholar]
- 12.Perrino BA. Regulation of calcineurin phosphatase activity by its autoinhibitory domain. Arch Biochem Biophys. 1999;372(1):159–165. doi: 10.1006/abbi.1999.1485. [DOI] [PubMed] [Google Scholar]
- 13.Wang H, Du Y, Xiang B, Lin W, Li X, Wei Q. A renewed model of CNA regulation involving its C-terminal regulatory domain and CaM. Biochemistry. 2008;47(15):4461–4468. doi: 10.1021/bi702539e. [DOI] [PubMed] [Google Scholar]
- 14.Shen X, Li H, Ou Y, Tao W, Dong A, Kong J, Ji C, Yu S. The secondary structure of calcineurin regulatory region and conformational change induced by calcium/calmodulin binding. J Biol Chem. 2008;283(17):11407–11413. doi: 10.1074/jbc.M708513200. [DOI] [PubMed] [Google Scholar]
- 15.VanScyoc WS, Sorensen BR, Rusinova E, Laws WR, Ross JB, Shea MA. Calcium binding to calmodulin mutants monitored by domain-specific intrinsic phenylalanine and tyrosine fluorescence. Biophysical Journal. 2002;83(5):2767–2780. doi: 10.1016/S0006-3495(02)75286-7. [DOI] [PMC free article] [PubMed] [Google Scholar]
- 16.Ataman ZA, Gakhar L, Sorensen BR, Hell JW, Shea MA. The NMDA Receptor NR1 C1 Region Bound to Calmodulin: Structural Insights into Functional Differences between Homologous Domains. Structure. 2007;15(12):1603–1617. doi: 10.1016/j.str.2007.10.012. [DOI] [PMC free article] [PubMed] [Google Scholar]
- 17.Jaren OR, Harmon S, Chen AF, Shea MA. Paramecium Calmodulin Mutants Defective in Ion Channel Regulation Can Bind Calcium and Undergo Calcium-Induced Conformational Switching. Biochemistry. 2000;39:6881–6890. doi: 10.1021/bi000037w. [DOI] [PubMed] [Google Scholar]
- 18.Saimi Y, Kung C. Calmodulin as an Ion-Channel Subunit. Annual Review of Physiology. 2002;64:289–311. doi: 10.1146/annurev.physiol.64.100301.111649. [DOI] [PubMed] [Google Scholar]
- 19.Crivici A, Ikura M. Molecular and Structural Basis of Target Recognition by Calmodulin. Annual Review of Biophysics and Biomolecular Structure. 1995;24:85–116. doi: 10.1146/annurev.bb.24.060195.000505. [DOI] [PubMed] [Google Scholar]
- 20.Yuan T, Vogel HJ, Sutherland C, Walsh MP. Characterization of the Ca2+-dependent and -independent interactions between calmodulin and its binding domain of inducible nitric oxide synthase. FEBS Lett. 1998;431(2):210–214. doi: 10.1016/s0014-5793(98)00750-9. [DOI] [PubMed] [Google Scholar]
- 21.Yap KL, Kim J, Truong K, Sherman M, Yuan T, Ikura M. Calmodulin Target Database. Journal of Structural and Functional Genomics. 2000;1(1):8–14. doi: 10.1023/a:1011320027914. [DOI] [PubMed] [Google Scholar]
- 22.Vetter SW, Leclerc E. Novel aspects of calmodulin target recognition and activation. European Journal of Biochemistry. 2003;270:404–414. doi: 10.1046/j.1432-1033.2003.03414.x. [DOI] [PubMed] [Google Scholar]
- 23.Chin D, Means AR. Calmodulin: a prototypical calcium sensor. Trends in Cell Biology. 2000;10(8):322–328. doi: 10.1016/s0962-8924(00)01800-6. [DOI] [PubMed] [Google Scholar]
- 24.Hoeflich KP, Ikura M. Calmodulin in Action: Diversity in Target Recognition and Activation Mechanisms. Cell. 2002;108:739–742. doi: 10.1016/s0092-8674(02)00682-7. [DOI] [PubMed] [Google Scholar]
- 25.Ikura M, Clore GM, Gronenborn AM, Zhu G, Klee CB, Bax A. Solution structure of a calmodulin-target peptide complex by multidimensional NMR. Science. 1992;256:632–638. doi: 10.1126/science.1585175. [DOI] [PubMed] [Google Scholar]
- 26.Meador WE, Means AR, Quiocho FA. Target enzyme recognition by calmodulin: 2.4 Å Structure of a calmodulin-peptide complex. Science. 1992;257:1251–1255. doi: 10.1126/science.1519061. [DOI] [PubMed] [Google Scholar]
- 27.Schumacher MA, Rivard AF, Bachinger HP, Adelman JP. Structure of the gating domain of a Ca2+-activated K+ channel complexed with Ca2+/calmodulin. Nature. 2001;410(6832):1120–1124. doi: 10.1038/35074145. [DOI] [PubMed] [Google Scholar]
- 28.Wolff J, Newton DL, Klee CB. Activation of Bordetella pertussis Adenylate Cyclase by the Carboxy-Terminal Tryptic Fragment of Calmodulin. Biochemistry. 1986;25:7950–7955. doi: 10.1021/bi00372a025. [DOI] [PubMed] [Google Scholar]
- 29.Drum CL, Yan S, Bard J, Shen Y, LU D, Soelaiman S, Grabarek Z, Bohm A, Tang W. Structural basis for the activation of anthrax adenylyl cyclase exotoxin by calmodulin. Nature. 2002;415:396–402. doi: 10.1038/415396a. [DOI] [PubMed] [Google Scholar]
- 30.Kakiuchi S, Yasuda S, Yamazaki R, Teshima Y, Kanda K, Kakiuchi R, Sobue K. Quantitative determinations of calmodulin in the supernatant and particulate fractions of mammalian tissues. Journal of Biochemistry. 1982;92(4):1041–1048. doi: 10.1093/oxfordjournals.jbchem.a134019. [DOI] [PubMed] [Google Scholar]
- 31.Wu X, Bers DM. Free and bound intracellular calmodulin measurements in cardiac myocytes. Cell Calcium. 2007;41(4):353–364. doi: 10.1016/j.ceca.2006.07.011. [DOI] [PMC free article] [PubMed] [Google Scholar]
- 32.Black DJ, Tran QK, Persechini A. Monitoring the total available calmodulin concentration in intact cells over the physiological range in free Ca2+ Cell Calcium. 2004;35(5):415–425. doi: 10.1016/j.ceca.2003.10.005. [DOI] [PubMed] [Google Scholar]
- 33.Persechini A, Stemmer PM. Calmodulin is a limiting factor in the cell. Trends in Cardiovascular Medicine. 2002;12:32–37. doi: 10.1016/s1050-1738(01)00144-x. [DOI] [PubMed] [Google Scholar]
- 34.Tran QK, Black DJ, Persechini A. Intracellular coupling via limiting calmodulin. J Biol Chem. 2003;278(27):24247–24250. doi: 10.1074/jbc.C300165200. [DOI] [PubMed] [Google Scholar]
- 35.Hubbard MJ, Klee CB. Calmodulin Binding by Calcineurin Ligand-Induced Renaturation of Protein Immobilized on Nitrocellulose. JBiolChem. 1987;262:15062–15070. [PubMed] [Google Scholar]
- 36.Quintana AR, Wang D, Forbes JE, Waxham MN. Kinetics of calmodulin binding to calcineurin. Biochemical and Biophysical Research Communications. 2005;334:674–680. doi: 10.1016/j.bbrc.2005.06.152. [DOI] [PubMed] [Google Scholar]
- 37.Sorensen BR, Shea MA. Interactions between domains of apo calmodulin alter calcium binding and stability. Biochemistry. 1998;37:4244–4253. doi: 10.1021/bi9718200. [DOI] [PubMed] [Google Scholar]
- 38.Putkey JA, Slaughter GR, Means AR. Bacterial expression and characterization of proteins derived from the chicken calmodulin cDNA and a calmodulin processed gene. Journal of Biological Chemistry. 1985;260(8):4704–4712. [PubMed] [Google Scholar]
- 39.Beaven GH, Holiday ER. Ultraviolet absorption spectra of proteins and amino acids. Advances in Protein Chemistry. 1952;7:319–386. doi: 10.1016/s0065-3233(08)60022-4. [DOI] [PubMed] [Google Scholar]
- 40.Crouch TH, Klee CB. Positive Cooperative Binding of Calcium to Bovine Brain Calmodulin. Biochemistry. 1980;19:3692–3698. doi: 10.1021/bi00557a009. [DOI] [PubMed] [Google Scholar]
- 41.Sorensen BR, Shea MA. Calcium Binding Decreases the Stokes Radius of Calmodulin and Mutants R74A, R90A, and R90G. Biophys J. 1996;71:3407–3420. doi: 10.1016/S0006-3495(96)79535-8. [DOI] [PMC free article] [PubMed] [Google Scholar]
- 42.Sorensen BR, Eppel JT, Shea MA. Paramecium Calmodulin Mutants Defective in Ion Channel Regulation Associate with Melittin in the Absence of Calcium but Require It for Tertiary Collapse. Biochemistry. 2001;40(4):896–903. doi: 10.1021/bi0023091. [DOI] [PubMed] [Google Scholar]
- 43.Schuck P. Size-distribution analysis of macromolecules by sedimentation velocity ultracentrifugation and lamm equation modeling. Biophys J. 2000;78(3):1606–1619. doi: 10.1016/S0006-3495(00)76713-0. [DOI] [PMC free article] [PubMed] [Google Scholar]
- 44.Brown PH, Schuck P. Macromolecular size-and-shape distributions by sedimentation velocity analytical ultracentrifugation. Biophys J. 2006;90(12):4651–4661. doi: 10.1529/biophysj.106.081372. [DOI] [PMC free article] [PubMed] [Google Scholar]
- 45.Stone MJ, Fairbrother WJ, Palmer AG, 3rd, Reizer J, Saier MH, Jr., Wright PE. Backbone dynamics of the Bacillus subtilis glucose permease IIA domain determined from 15N NMR relaxation measurements. Biochemistry. 1992;31(18):4394–4406. doi: 10.1021/bi00133a003. [DOI] [PubMed] [Google Scholar]
- 46.Barbato G, Ikura M, Kay LE, Pastor RW, Bax A. Backbone dynamics of calmodulin studied by 15N relaxation using inverse detected two-dimensional NMR spectroscopy: The central helix is flexible. Biochemistry. 1992;31:5269–5278. doi: 10.1021/bi00138a005. [DOI] [PubMed] [Google Scholar]
- 47.Yu L, Zhu CX, Tse-Dinh YC, Fesik SW. Backbone dynamics of the C-terminal domain of Escherichia coli topoisomerase I in the absence and presence of single-stranded DNA. Biochemistry. 1996;35(30):9661–9666. doi: 10.1021/bi960507f. [DOI] [PubMed] [Google Scholar]
- 48.Delaglio F, Grzesiek S, Vuister GW, Zhu G, Pfeifer J, Bax A. NMRPipe: a multidimensional spectral processing system based on UNIX pipes. J Biomol NMR. 1995;6(3):277–293. doi: 10.1007/BF00197809. [DOI] [PubMed] [Google Scholar]
- 49.Johnson BA, Blevins RA. NMR View: A Computer Program for the Visualization and Analysis of NMR Data. Journal of Biomolecular NMR. 1994;4(5):603–614. doi: 10.1007/BF00404272. [DOI] [PubMed] [Google Scholar]
- 50.Yamazaki T, Lee W, Arrowsmith CH, Muhandiram DR, Kay LE. A Suite of Triple Resonance NMR Experiment for the Backbone Assignment of 15N, 13C, 2H Labeled Proteins with High Sensitivity. Journal of the American Chemical Society. 1994;116(26):11655–11666. [Google Scholar]
- 51.Fesik SW, Zuiderweg ER. Heteronuclear Three-Dimensional NMR Spectroscopy. A Strategy for the Simplification of Homonuclear Two-Dimensional NMR Spectra. Journal of Magnetic Resonance. 1988;78:588–593. [Google Scholar]
- 52.Clore GMaG AM. Multidimensional Heteronuclear Magnetic Resonance of Proteins. Methods Enzymol. 1994;239:349–363. doi: 10.1016/s0076-6879(94)39013-4. [DOI] [PubMed] [Google Scholar]
- 53.Ikura M, Bax A. Isotope-Filtered 2D NMR of a Protein-Peptide Complex: Study of a Skeletal Muscle Myosin Light Chain Kinase Fragment Bound to Calmodulin. JAmChemSoc. 1992;114:2433–2440. [Google Scholar]
- 54.Vuister GW, Kim SJ, Wu C, Bax A. NMR evidence for similarities between the DNA-binding regions of Drosophila melanogaster heat shock factor and the helix-turn-helix and HNF-3/forkhead families of transcription factors. Biochemistry. 1994;33(1):10–16. doi: 10.1021/bi00167a002. [DOI] [PubMed] [Google Scholar]
- 55.Johnson ML, Frasier SG. Nonlinear least-squares analysis. Methods Enzymol. 1985;117:301–342. [Google Scholar]
- 56.Pedigo S, Shea MA. Quantitative endoproteinase GluC footprinting of cooperative Ca2+ binding to calmodulin: Proteolytic susceptibility of E31 and E87 indicates interdomain interactions. Biochemistry. 1995;34:1179–1196. doi: 10.1021/bi00004a011. [DOI] [PubMed] [Google Scholar]
- 57.VanScyoc WS, Shea MA. Phenylalanine fluorescence studies of calcium binding to N-Domain fragments of Paramecium calmodulin mutants show increased calcium affinity correlates with increased disorder. Protein Science. 2001;10(9):1758–1768. doi: 10.1110/ps.11601. [DOI] [PMC free article] [PubMed] [Google Scholar]
- 58.Shea MA, Sorensen BR, Pedigo S, Verhoeven A. Proteolytic Footprinting Titrations for Estimating Ligand-Binding Constants and Detecting Pathways of Conformational Switching of Calmodulin. Methods in Enzymology. 2000;323:254–301. doi: 10.1016/s0076-6879(00)23370-3. [DOI] [PubMed] [Google Scholar]
- 59.Evans TI, Shea MA. Energetics of calmodulin domain interactions with the calmodulin binding domain of CaMKII. Proteins. 2009;76(1):47–61. doi: 10.1002/prot.22317. [DOI] [PMC free article] [PubMed] [Google Scholar]
- 60.Shea MA, Verhoeven AS, Pedigo S. Calcium-Induced Interactions of Calmodulin Domains Revealed by Quantitative Thrombin Footprinting of Arg37 and Arg106. Biochemistry. 1996;35:2943–2957. doi: 10.1021/bi951934g. [DOI] [PubMed] [Google Scholar]
- 61.Sobolev V, Sorokine A, Prilusky J, Abola EE, Edelman M. Automated analysis of interatomic contacts in proteins. Bioinformatics. 1999;15(4):327–332. doi: 10.1093/bioinformatics/15.4.327. [DOI] [PubMed] [Google Scholar]
- 62.Jaren OR, Kranz JK, Sorensen BR, Wand AJ, Shea MA. Calcium-Induced Conformational Switching of Paramecium Calmodulin: Changes in the Protein Backbone Observed by Heteronuclear NMR Studies. Biochemistry. 2002;41(48):14158–14166. doi: 10.1021/bi026340+. [DOI] [PubMed] [Google Scholar]
- 63.Ye Q, Li X, Wong A, Wei Q, Jia Z. Structure of calmodulin bound to a calcineurin Peptide: a new way of making an old binding mode(,) Biochemistry. 2006;45(3):738–745. doi: 10.1021/bi0521801. [DOI] [PubMed] [Google Scholar]
- 64.Ye Q, Wang H, Zheng J, Wei Q, Jia Z. The complex structure of calmodulin bound to a calcineurin peptide. Proteins. 2008;73(1):19–27. doi: 10.1002/prot.22032. [DOI] [PubMed] [Google Scholar]
- 65.Majava V, Kursula P. Domain swapping and different oligomeric States for the complex between calmodulin and the calmodulin-binding domain of calcineurin a. PLoS ONE. 2009;4(4):e5402. doi: 10.1371/journal.pone.0005402. [DOI] [PMC free article] [PubMed] [Google Scholar]
- 66.Meador WE, Means AR, Quiocho FA. Modulation of calmodulin plasticity in molecular recognition on the basis of X-ray structures. Science. 1993;262:1718–1721. doi: 10.1126/science.8259515. [DOI] [PubMed] [Google Scholar]
- 67.Odom A, Muir S, Lim E, Toffaletti DL, Perfect J, Heitman J. Calcineurin is required for virulence of Cryptococcus neoformans. EMBO J. 1997;16(10):2576–2589. doi: 10.1093/emboj/16.10.2576. [DOI] [PMC free article] [PubMed] [Google Scholar]
- 68.Ishida H, Vogel HJ. Protein-peptide interaction studies demonstrate the versatility of calmodulin target protein binding. Protein Pept Lett. 2006;13(5):455–465. doi: 10.2174/092986606776819600. [DOI] [PubMed] [Google Scholar]
- 69.Rhoads AR, Friedberg F. Sequence motifs for calmodulin recognition. FASEB J. 1997;11(5):331–340. doi: 10.1096/fasebj.11.5.9141499. [DOI] [PubMed] [Google Scholar]
- 70.Ikura M, Ames JB. Genetic polymorphism and protein conformational plasticity in the calmodulin superfamily: two ways to promote multifunctionality. Proc Natl Acad Sci U S A. 2006;103(5):1159–1164. doi: 10.1073/pnas.0508640103. [DOI] [PMC free article] [PubMed] [Google Scholar]
- 71.Theoharis NT, Sorensen BR, Theisen-Toupal J, Shea MA. The Neuronal Voltage-Dependent Sodium Channel Type II IQ Motif Lowers the Calcium Affinity of the C-Domain of Calmodulin. Biochemistry. 2008;47(1):112–123. doi: 10.1021/bi7013129. [DOI] [PubMed] [Google Scholar]
- 72.Shah VN, Wingo TL, Weiss KL, Williams CK, Balser JR, Chazin WJ. Calcium-dependent regulation of the voltage-gated sodium channel hH1: intrinsic and extrinsic sensors use a common molecular switch. Proc Natl Acad Sci U S A. 2006;103(10):3592–3597. doi: 10.1073/pnas.0507397103. [DOI] [PMC free article] [PubMed] [Google Scholar]
- 73.Kranz JK, Lee EK, Nairn AC, Wand AJ. A direct test of the reductionist approach to structural studies of calmodulin activity: relevance of peptide models of target proteins. Journal of Biological Chemistry. 2002;277:16351–16354. doi: 10.1074/jbc.C200139200. [DOI] [PubMed] [Google Scholar]
- 74.Jurado LA, Chockalingam PS, Jarrett HW. Apocalmodulin. Physiology Reviews. 1999;79(3):661–682. doi: 10.1152/physrev.1999.79.3.661. [DOI] [PubMed] [Google Scholar]
- 75.Peersen OB, Madsen TS, Falke JJ. Intermolecular tuning of calmodulin by target peptides and proteins: differential effects on Ca2+ binding and implications for kinase activation. Protein Science. 1997;6(4):794–807. doi: 10.1002/pro.5560060406. [DOI] [PMC free article] [PubMed] [Google Scholar]
- 76.Newman RA, Van Scyoc WS, Sorensen BR, Jaren OR, Shea MA. Interdomain coopertivity of calmodulin to melittin preferentially increases calcium affinity of sites I and II. Proteins: Structure, Function, and Bioinformatics. 2008;71(4):1792–1812. doi: 10.1002/prot.21861. [DOI] [PubMed] [Google Scholar]
- 77.Tadross MR, Dick IE, Yue DT. Mechanism of local and global Ca2+ sensing by calmodulin in complex with a Ca2+ channel. Cell. 2008;133(7):1228–1240. doi: 10.1016/j.cell.2008.05.025. [DOI] [PMC free article] [PubMed] [Google Scholar]
- 78.Liang H, DeMaria CD, Erickson MG, Mori MX, Alseikhan BA, Yue DT. Unified mechanisms of Ca2+ regulation across the Ca2+ channel family. Neuron. 2003;39(6):951–960. doi: 10.1016/s0896-6273(03)00560-9. [DOI] [PubMed] [Google Scholar]
- 79.Tse JK, Giannetti AM, Bradshaw JM. Thermodynamics of calmodulin trapping by Ca2+/calmodulin-dependent protein kinase II: subpicomolar Kd determined using competition titration calorimetry. Biochemistry. 2007;46(13):4017–4027. doi: 10.1021/bi700013y. [DOI] [PubMed] [Google Scholar]
- 80.Song Q, Saucerman JJ, Bossuyt J, Bers DM. Differential integration of Ca2+-calmodulin signal in intact ventricular myocytes at low and high affinity Ca2+-calmodulin targets. J Biol Chem. 2008;283(46):31531–31540. doi: 10.1074/jbc.M804902200. [DOI] [PMC free article] [PubMed] [Google Scholar]
- 81.Saucerman JJ, Bers DM. Calmodulin mediates differential sensitivity of CaMKII and calcineurin to local Ca2+ in cardiac myocytes. Biophys J. 2008;95(10):4597–4612. doi: 10.1529/biophysj.108.128728. [DOI] [PMC free article] [PubMed] [Google Scholar]
Associated Data
This section collects any data citations, data availability statements, or supplementary materials included in this article.
Supplementary Materials
Sedimentation velocity experiment of 8.3 μM (Ca2+)4-PCaM1-148 in the presence of a slight excess of Fl-bCaNp. Sedimentation of Fl-βCaNp was monitored by absorbance at 494 nm using a Beckman XL-I analytical ultracentrifuge. Data analysis is described in Materials and Methods. Sedimentation data fit using SEDFIT 43,44 with model of a single species. The resulting molecular mass (19.4 kDa) corresponded closely with the theoretical mass (19.6 kDa) and not to a 2:2 (39.2 kDa) or 1:2 (22.4 kDa) complex.
(A) Change in fluorescence anisotropy of Fl-βCaNp upon titration with CaM1-148 in the presence of saturating calcium. The normalized anisotropy is plotted against the ratio of CaM1-148 to βCaNp. Curves through the data were simulated to a one-site binding isotherm for several Kd values: 1 pM (solid line), 1 nM (dotted line), 10 nM (large dashed line), and 100 nM (dotted/dashed line). Inset shows a detail view of the data near the break point. (B) To illustrate the separation in Kd values, simulated curves were plotted as a function of [CaM]Free.
Fractional saturation curves plotted against [CaM]Free representing simulations of CaM1-148 (black), CaM76-148 (red) and CaM1-80 (blue) in the presence (A, calcium-saturated) or absence (B, Ca2+-depleted) of 10 mM CaCl2 binding to Fl-βCaNp with equilibrium constants reported in Table 2.
Intermolecular NOEs between the protons of I412 of βCaNp and A88 protons of 13C,15N-CaM1-148. NOEs detected from the A88 Cα (A-C) and Cβ (D-F). Shown are (A, D) 13C filtered NOESY spectra (βCaNp protons), (B, E) HCCH-TOCSY spectra (CaM protons), and (C, F) 13C NOESY spectra (all protons). Peptide shifts are indicated by black lines and text while CaM shifts are indicated in red. The arrow in panel D points to a weak intermolecular NOE.
Intermolecular NOEs between the protons of I412 of βCaNp and the γ2 methyl proton of residue V35 from 13C,15N-CaM1-148. Shown are (A) 13C filtered NOESY spectra (βCaNp protons), (B) HCCH-TOCSY spectra (CaM protons), and(C) 13C NOESY spectra (all protons). Peptide shifts are indicated by black lines and text while CaM shifts are indicated in red.
Intermolecular NOEs between the protons of I412 of βCaNp and the V91 beta protons of 13C,15N-CaM1-148. Shown are (A) 13C filtered NOESY spectra (βCaNp protons), (B) HCCH-TOCSY spectra (CaM protons), and (C) 13C NOESY spectra (all protons). Peptide shifts are indicated by black lines and text, while CaM shifts are indicated in red.
Distribution of CaM contacts in the CaM-αCaNp complex in 2R28.pdb. (A) Sequence map of CaM residues within 4.5 Å of individual residues of αCaNp1 and αCaNp2 in crystallographic 2:2 structure in 2R28.pdb. Residues highlighted in yellow represent the FLMM residues of CaM. The 1-5-8-14 BAA motif residues of βCaNp are shaded in gray. In both CaM-βCaNp complexes, F410 (boxed) had the highest number of contacts to a single N-domain. Residues 391-395 of αCaNp2 made no contacts with CaM. Residues located at the terminal ends of the peptide, which had no contact with CaM, are not shown. Occupancy of the (B) N-domain FLMM pocket and (C) C-domain FLMM pocket by F410 (green) and I400 and I403 (gray) anchor residues.