

Abstract
SeqA is an Escherichia coli DNA-binding protein that acts at replication origins and controls DNA replication. However, binding is not exclusive to origins. Many fragments containing two or more hemi-methylated GATC sequences bind efficiently. Binding was optimal when two such sequences were closely apposed or up to 31 bases apart on the same face of the DNA helix. Binding studies suggest that neighboring bound proteins contact each other to form a complex with the intervening DNA looped out. There are many potential binding sites distributed around the E.coli chromosome. As replication produces a transient wave of hemi-methylation, tracts of SeqA binding are likely to associate with each fork as replication progresses. The number and positions of green fluorescent protein–SeqA foci seen in living cells suggest that they correspond to these tracts, and that the forks are tethered to planes of cell division. SeqA may help to tether the forks or to organize newly replicated DNA into a structure that aids DNA to segregate away from the replication machinery.
Keywords: Escherichia coli/hemi-methylation/nucleoid segregation/replication forks/SeqA protein
Introduction
The Escherichia coli SeqA protein recognizes origins of replication of the bacterial chromosome, oriC, and the P1 plasmid, P1oriR, at multiple GATC adenine methylation sites. It binds to the hemi-methylated, post-replicative forms of these sequences and sequesters the DNA to prevent premature re-initiation (Lu et al., 1994; Brendler et al., 1995; Slater et al., 1995). In vitro studies show that binding is not exclusive to replication origins: other fragments with hemi-methylated GATC sites can bind SeqA efficiently as long as certain conditions are met (Brendler et al., 1995; Brendler and Austin, 1999).
There is an absolute requirement for more than one hemi-methylated GATC site on each bound fragment. SeqA protects both DNA strands in a discrete patch at each hemi-methylated GATC sequence. Each of the four GATC bases is contacted and each is essential for binding. Although the recognized sequence is symmetric, the footprint shows some asymmetry, with the orientation of the bound protein dictated by the position of the unique methyl group (Brendler and Austin, 1999).
The requirement for two hemi-methylated sites on a single fragment does not appear to reflect an extended recognition sequence encompassing two hemi-methylated GATC repeats. No particular sequence, other than the GATC bases themselves, is required, and binding occurs with at least two different spacings between the GATC residues. Moreover, the methyl groups of two hemi-methylated sites can be either in cis or in trans to each other, and when three sites are present on a fragment, all three positions appear to be occupied at the same time (Brendler and Austin, 1999). These observations are most easily explained if the protein recognizes the individual hemi-methylated sites as a dimer, but must undergo an interaction with a nearby bound protein for stable binding to occur (Brendler and Austin, 1999). Here, we investigate this unusual binding property in order to shed light on the mechanism and biological significance of SeqA binding.
The SeqA protein forms discrete foci within the cell, as detected by immunofluorescence microscopy in fixed cells (Hiraga et al., 1998) or by visualization of a SeqA–green fluorescent protein (GFP) fusion in living cells (Onogi et al., 1999). Formation of foci was dependent on DNA methylation. These foci did not co-localize with oriC as they persisted in oriC deletion strains (Hiraga et al., 1998; Onogi et al., 1999). They were thought to represent some special binding site involved in chromosome organization (Hiraga et al., 1998), or the clustering of specific regions of the DNA left persistently hemi-methylated when the replication forks passed along the chromosome (Onogi et al., 1999).
In fixed preparations, the number of SeqA foci seen by immunofluorescence microscopy increased with increasing growth rate. The cells frequently appeared to have two, four or eight foci, suggesting that SeqA was bound to some fixed locus in the general vicinity of the chromosomal origin (Hiraga et al., 1998). The mean number of foci in rapidly growing cells was between five and six (Hiraga et al., 1998). However, in rapidly growing living cells, a SeqA–GFP fusion protein generally formed only a single focus at the cell center, or two widely spaced foci along the long axis of the cell. The foci appeared to undergo dynamic behavior during the cell cycle, dividing at the cell center and moving out to the 1/4 and 3/4 positions prior to cell division. This suggested that they may be involved in segregation of chromosomes to daughter cells (Onogi et al., 1999).
Results
SeqA binding is dependent on the relative alignment of two sites on the face of the DNA helix
A series of oligonucleotides was constructed with two hemi-methylated GATC sites present in an otherwise randomly chosen sequence. The position of the first site was fixed but the position of the second site, which had the methyl group on the same strand as the first, was varied to give a series of spacings between 4 bp (where the two GATC sequences are immediately adjacent to each other) and 34 bp. Results of SeqA binding experiments are shown in Figure 1. At the closest spacing of 4, no binding was seen. Maxima were seen at spacings of ∼7, 12, 21 and 31 bp. Minima were seen at 9, 16, 25–27 and 34 bp. The intensity of the bands was measured and plotted against spacing in the lower panel of Figure 1. When the spacing was ≥11 bp, binding was favored when the two sites were approximately on the same face of the helix (assuming a helical turn of 11 bp). Little or no binding was seen when the sites were approximately centered on opposite helical faces. Peak binding efficiency appeared to decrease with increasing numbers of helical turns.
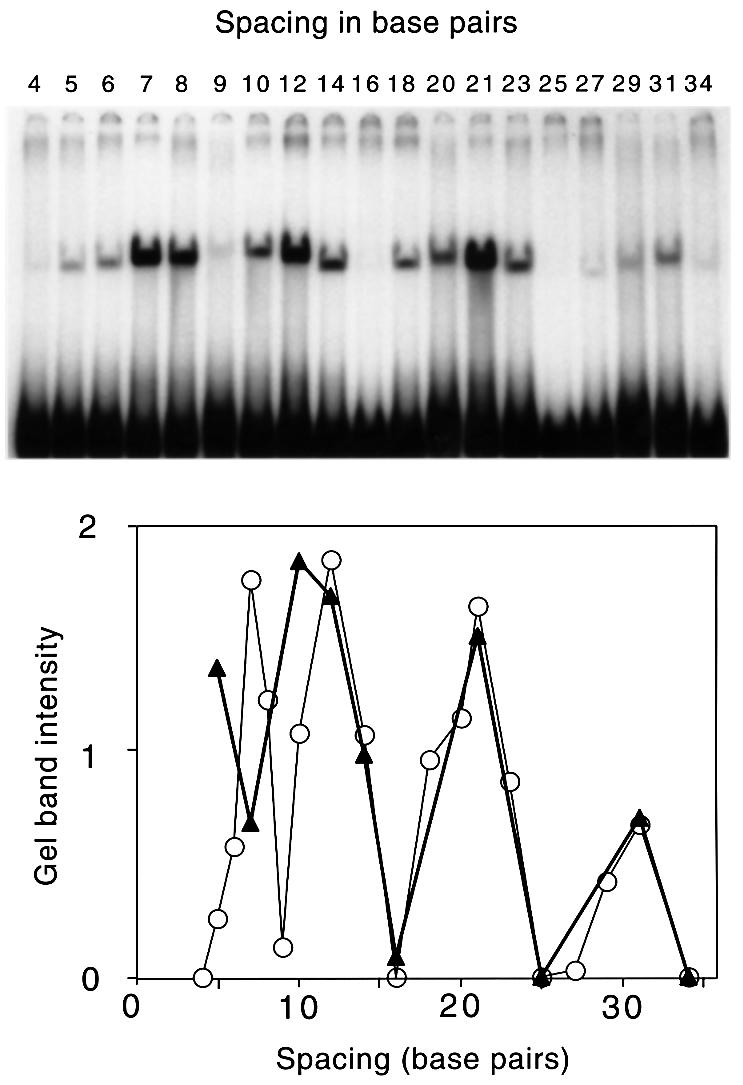
Fig. 1. SeqA binding by EMSA. Using a DNA fragment containing two hemi-methylated GATC sequences, the position of the first hemi-methylated GATC was kept constant. The position of the second GATC was varied. The upper panel shows the EMSA results obtained, with the spacing between the modified adenines ranging from 4 to 34 bp. The small variations in the mobility of the retarded complexes is presumably due to differences in topology of the complexes as the spacing is changed. The N6-methyl adenines were both on the same strand (cis configuration). The lower panel is a plot of the intensities of the bands obtained from the displayed gel (open symbols) and from that from a similar experiment in which each substrate had two hemi-methylated GATC sites with the methyl groups in trans (closed symbols). Only pairs of sites in the cis configuration are likely to be produced by passage of the replication fork (Figure 3C). The graph shows that 12 different spacings give significant binding. In addition, interpolation of the data suggests that spacings of 11, 13, 19, 22 and 30 bp can bind. Efficient binding at a spacing of 11 bp was shown previously (Brendler and Austin, 1999).
When sites were closer than one turn of the helix, the binding rules appeared to be more complex. Binding was absent or weak when the spacing was very close (4, 5 or 6 bp), but was possible at spacings of 7 or 8, but not 9 bp. It seems probable that spacings of <6 bp are disfavored because proteins bound to the two sites interfere with each other. Other close spacings may be permissible because they promote the appropriate direct contact between bound proteins.
Similar spacing rules apply when two sites have their methyl groups in trans
The substrates used in the gel shown in Figure 1 all had both sites with the methyl group on the same strand (cis configuration). However, substrates with two sites in trans can also bind SeqA (Brendler and Austin, 1999). The effect of spacing on binding to these trans-constructs was much the same as with the cis-constructs, with maxima occurring approximately at one, two and three turns of the helix apart (Figure 1, lower panel). Again, close spacing gave binding, but the permissive spacing appeared to be shifted to a closer position with good binding at a 5 bp spacing but less binding at 7 bp, in contrast to binding with the cis-constructs where 5 bp gave no binding and a 7 bp spacing bound efficiently (Figure 1). If the proteins are in direct contact with each other at close spacings, these differences presumably reflect a difference in the relative conformation of the cis and trans complexes that affects the ability of the proteins to fit together when close to each other.
SeqA binding to separated sites loops out the intervening DNA
As SeqA binding requires multiple sites, it seems probable that there is a requirement for contact between adjacent bound units for binding stability. At all but the closest spacings, efficient binding required the sites to be centered approximately on the same face of the DNA helix. This would follow if the required protein–protein contacts between bound units occurred by bending of the intervening DNA to bring the proteins into contact. Alternatively, contact could be maintained between the bound sites by binding additional SeqA proteins to the intervening DNA. We carried out DNA footprinting to examine this latter possibility.
The bound protein forms discrete regions of protection covering ∼6 bp centered on each of the hemi-methylated GATC sites present. When three such sites were present (I, II and III, Figure 2), all three were protected and appeared to be occupied by bound SeqA protein simultaneously (Brendler and Austin, 1999). Figure 2 shows the result of inactivating the center site (II), either by having it fully unmethylated or by changing the GATC sequence to AGCT. The center site was no longer protected, but the outer sites (I and III) remained protected over the same regions as before. Thus, the intervening region between well spaced sites does not appear to be occupied by additional SeqA proteins. We conclude that bound SeqA proteins are likely to maintain contact with each other by looping out the intervening DNA. The bound complexes of the substrates used in the footprinting experiment would therefore resemble those illustrated in Figure 3.
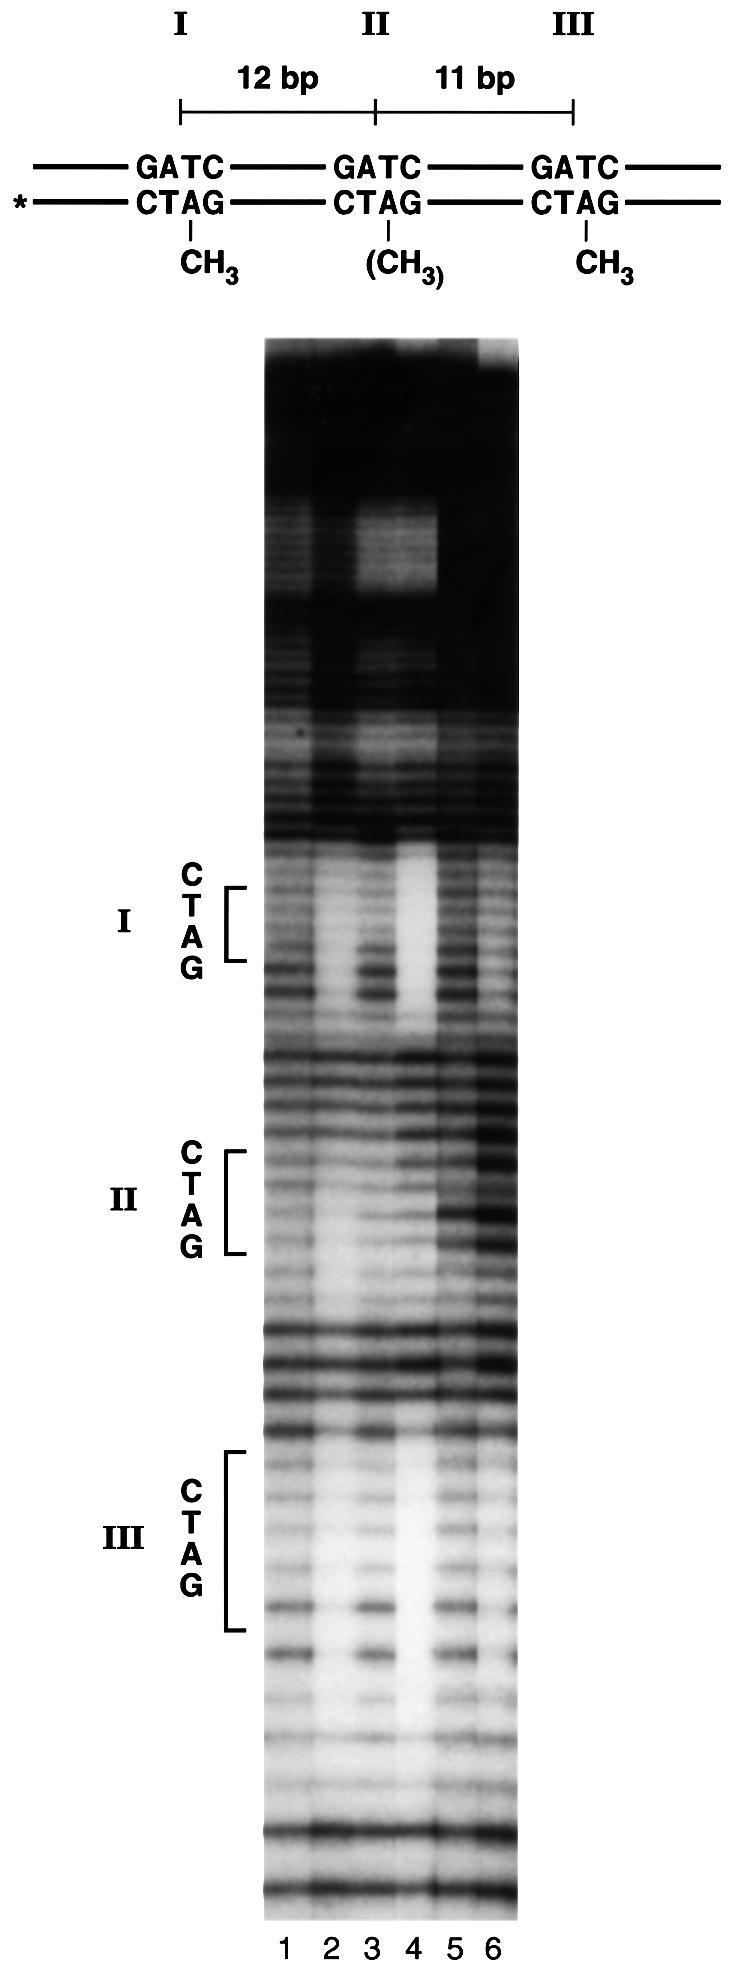
Fig. 2. Copper–phenanthroline footprint analysis of a substrate with three or two hemi-methylated GATC sites. Oligonucleotide containing three hemi-methylated GATC sites (I, II, III), or two hemi-methylated sites (I, III) labeled on the 5′ end of the bottom strand (asterisk) were subjected to 1,10-phenanthroline–copper cleavage. Lanes 1 and 2, three hemi-methylated sites without and with SeqA, respectively; lanes 3 and 4, the same experiment using a variant with the center site (II) unmethylated; lanes 5 and 6, the same experiment using a variant with the center site (II) unmethylated and changed in sequence to AGCT.

Fig. 3. Proposed structures for SeqA–DNA complexes. (A) An oligonucleotide with three hemi-methylated GATC sequences (Figure 2) binds SeqA dimers to form a folded structure with the proteins contacting each other with the intervening DNA looped out. (B) The bound substrates lacking the central site, due to mutation or lack of methylation, form a similar structure, but with the entire central region looped out and accessible to cleavage in the footprinting reaction (Figure 2). (C) Passage of the replication fork duplicates and converts the fully methylated GATC sites (shaded boxes) to hemi-methylated sites (black boxes). Clusters of bound SeqA proteins form at suitably spaced hemi-methylated sites. Clusters may also bind to each other, further compacting the DNA. Dam methylase eventually restores full methylation and SeqA binding decays behind the fork region. Thus, a tract of SeqA binding follows the fork around the chromosome.
SeqA binds to appropriate hemi-methylated sequences when they are present in supercoiled DNA
We developed a method to produce radiolabeled plasmid DNA enriched for hemi-methylated GATC sites. We prepared covalently closed supercoiled pGB2 plasmid DNA (Churchward et al., 1984) by this method and also unmethylated or fully methylated control samples (see Materials and methods). Using a nitrocellulose filter binding assay, we found that the DNA enriched for hemi-methylated GATC sites bound SeqA more efficiently than the fully methylated or unmethylated DNA over a range of different SeqA concentrations (Figure 4). Cutting the DNA with a restriction enzyme increased the efficiency of binding to the hemi-methylated form at lower SeqA concentrations, and binding to the fully methylated and unmethylated forms was suppressed, increasing the discrimination for the hemi-methylated form considerably (Figure 4). Circular DNA, relaxed by treatment with topoisomerase I, gave very similar results to the linear DNA (data not shown). As SeqA concentration was increased, binding of the linear DNA saturated with ∼40% of the DNA bound to the filter (Figure 4 and data not shown). This suggests that 40% of the hemi-methylation enriched DNA was, in fact, hemi-methylated. Taking this into consideration, and that the fully methylated DNA preparation presumably contains a small proportion of hemi-methylated molecules, the ability of SeqA to discriminate between hemi- and fully methylated supercoiled DNA is probably several fold greater than Figure 4 might suggest. We conclude that hemi-methylated pGB2 DNA is a substrate for SeqA binding, and that SeqA retains its ability to discriminate between hemi-methylation and the other methylation states when binding to supercoiled circular DNA. However, the protein appears to bind more efficiently to relaxed or linear DNA and shows better discrimination for the hemi-methylated form of such substrates.

Fig. 4. SeqA binding to circular supercoiled DNA. SeqA binding was measured by a filter binding assay. Upper panel, circular supercoiled DNA of plasmid pGB2 contained unmethylated (circles) or fully methylated GATC sequences (squares) or was enriched for hemi-methylated GATC sequences (triangles) as described in Materials and methods. Each binding reaction contained 250 ng of DNA in a 25 µl reaction. A similar experiment using 25 ng of DNA/assay gave similar results (data not shown). Lower panel, the supercoiled circular DNA was made linear by cutting with NdeI restriction endonuclease and the binding experiment was repeated. Circular, relaxed DNA produced by treating the supercoiled DNA with topoisomerase I gave very similar results to those with the linear DNA (data not shown). The discrimination for SeqA binding to hemi-methylated DNA is greater than it appears here, because only ∼40% of the DNA in the enriched DNA preparation is hemi-methylated.
Lack of SeqA binding to widely spaced pairs of hemi-methylated GATC sites
Plasmid pGB2 DNA contains 23 GATC sites. Unlabeled, supercoiled circular DNA enriched for hemi-methylated GATC sites was cut with restriction endonucleases and end-labeled to produce fragments with a variety of numbers of GATC sequences (Table I). Similar unmethylated and fully methylated samples were also prepared. The samples were then incubated with SeqA protein, and the bound fragments trapped on a filter, eluted and separated by gel electrophoresis. Very little DNA was recovered from the unmethylated and fully methylated samples, and the barely visible bands seen on the gels after long exposure approximated the pattern of the input DNA (data not shown). In contrast, the sample enriched for hemi-methylated DNA gave strong binding signals corresponding to two of the 15 fragments scored (Table I). As predicted, fragments with one or no GATC sites failed to bind. Fragments with two sites 77, 183 or 262 bp apart also failed to bind. It can reasonably be assumed that the first fragment has two sites on the same face of the helix. Thus, sites seven turns of the helix apart may be too widely spaced to promote binding. This is consistent with the observation that the binding efficiency decreases sharply as the number of turns of the helix in the spacing increases (Figure 1).
Table I. Seq A binding to hemi-methylated GATC sites.
| Fragmenta | Number ofGATC sites | Spacingb | Binding |
|---|---|---|---|
| A | 1 | No | |
| B | 0 | No | |
| C | 2 | 262 | No |
| D | 3 | 21, 38, 59 | No |
| E | 1 | No | |
| F | 7 | 11, 12, 20, 31, 31, 129, etc.c | Yes |
| G | 2 | 183 | No |
| H | 2 | 77 | No |
| I | 4 | 10, 18, 75, 85, 93, 103 | Yes |
| J | 1 | No | |
| K | 0 | No | |
| L | 0 | No | |
| M | 0 | No |
aPartially hemi-methylated pGB2 DNA (see Materials and methods) was digested with MseI, NdeI and ApaLI. Fragments are labeled alphabetically in descending order of size, ranging from 449 to 101 bp. Ten fragments below 100 bp are omitted. None of these contain GATC sites, and none bound to SeqA.
bSpacing of GATC sites (in base pairs) counting from G to G of GATC sequences. Both adjacent and non-adjacent pairs are included. Those spacings expected to bind SeqA according to this study are shown in bold.
cSpacings corresponding to non-adjacent GATC sites are omitted for simplicity.
The two bound fragments had four and seven sites, respectively, and both had site spacings such that two or more sites would lie within 31 bp of each other on the same face of the helix (Table I). Thus, the pGB2 fragments appear to obey the binding rules established above. The exception to this was fragment D (Table I), which failed to bind despite having three sites, two of which are 21 bp apart. Perhaps this reflects the presence of some unusual sequence context or secondary structure that prevents SeqA binding to this fragment. Alternatively, the third, inappropriately spaced site might interfere with binding.
Potential SeqA binding sites on the E.coli chromosome
We have presented evidence that SeqA can bind many sequences containing more than one hemi-methylated GATC as long as one of a number of different spacings is present. Sites up to 31 bp apart are recognized, and the limit to spacing length appears to lie between 31 and 77 bp. Our data on binding to pairs of sites with methyl groups in cis shows that there are at least 17 different spacings that can bind SeqA (see legend to Figure 1). The E.coli chromosome contains many pairs of GATC sites that would satisfy this requirement if the sites were hemi-methylated. Analysis of the E.coli genome revealed 1750 pairs of GATC sites with spacings up to 31 bp that should be optimal for SeqA binding. These are rather evenly distributed around the chromosome (Figure 5). As the replication forks pass around the chromosome, the newly replicated DNA is transiently hemi-methylated (Ogden et al., 1988). The average half-life of hemi-methylated sites is probably of the order of a few minutes after the passage of the fork before the DNA adenine methylase restores full methylation (Campbell and Kleckner, 1990). If we assume a 2 min lifetime for the average hemi-methylated site and a 40 min replication time for the chromosome, a tract containing ∼100 suitably spaced pairs of hemi-methylated GATC sites would be expected to follow the progression of each fork. Persistent tracts of bound SeqA may therefore decorate the DNA behind the replication forks as illustrated in Figure 3C.

Fig. 5. Potential SeqA binding sites on the E.coli chromosome. The physical map shows the positions of 1750 pairs of GATC sequences in the E.coli genome (Blattner et al., 1997) whose spacing meets the criteria we have established for SeqA binding when the sites are hemi-methylated. Spacing is measured between the first bases of the relevant GATC sites. Thus, GATCGATC has a spacing of 4. The distribution of sites with respect to spacing is shown below. Spacings shown to bind SeqA in Figure 1 are shown in bold type. The other five spacings are likely to bind by interpolation of the data in Figure 1.
The relationship of the number of fluorescent SeqA foci in living cells to the number of replication forks
We suggest that the proposed tracts of bound SeqA that track the replication forks constitute the SeqA protein foci seen by fluorescence microscopy (Hiraga et al., 1998; Onogi et al., 1999). If this is the case, and if the tracts are spatially separated in the cells, the number of replication forks and the number of SeqA foci should show a fixed relationship. We carried out studies in living cells using a GFP–SeqA fusion kindly supplied by J.Pogliano and D.Helinski. We found that this fusion protein is an active SeqA protein in vivo: its expression from the same inducible plasmid as was used in the microscopy studies was able to restore the synchronous initiation of replication that is lost in a seqA mutant, as judged by flow cytometry (Figure 6). We counted SeqA foci in cells grown in different media at 30°C, a temperature at which GFP folds into its active form. We found that the average number of foci per cell increased sharply with increasing growth rate (Table II). The increased number of foci per cell observed at the highest growth rate is not an artifact due to gross overproduction of the GFP–SeqA fusion protein. Western blotting in comparison to a purified protein standard showed that there were ∼250 molecules of GFP–SeqA per cell under the experimental conditions used to visualize foci (see Materials and methods); a modest addition to the 1000 molecules of wild-type SeqA present in the cells (Slater et al., 1995). When GFP protein without the SeqA residues was expressed at the same level, no foci were seen (data not shown).

Fig. 6. Suppression of a seqA mutant by the GFP–SeqA fusion protein. Cells carrying a null mutation in seqA, CC4242 seqAΔ::tet and plasmid pGAP40 were grown without (A) or with (B) IPTG to induce synthesis of the GFP–SeqA fusion protein. The broad distribution of chromosome numbers in (A) indicates asynchrony of initiation of the seqA mutant cells after replication run-off (Materials and methods; Boye et al., 1996). Induction of expression of the GFP–SeqA fusion protein in (B) restores synchrony so that the chromosome distribution is similar to that of the cells without the seqA mutation (CC4238; C and D). Arrows indicate numbers of chromosomes per cell after the run-off.
Table II. The relationship between the average number of replication forks and the average number of SeqA foci.
| Medium | Generationtime at37°C (min) | Theoretical averagenumber of forksper cella | Average number offorks per cell at30°C (measured)b | Average numberof SeqA fociper cellc |
|---|---|---|---|---|
| M9 glucose | 63 | 2.1 | NA | 1.6 |
| M9 glucose casamino acids | 34 | 4.7 | 2.4 | 2.6 |
| LB broth | 24 | 10 | 5.8 | 6.3 |
NA, data not available. No satisfactory run-off was obtained under these conditions (see Materials and methods).
aCalculated from the 37°C growth rate as described in Materials and methods.
bAs determined by flow cytometry (see Materials and methods).
cAs determined by fluorescence microscopy; 100–200 cells were scored for each culture.
The distributions of numbers of foci were fairly smooth (Figure 7). Our findings contrast with the results previously reported for foci in living cells, where most cells appeared to have only one or two foci at high growth rates, and in fixed cells, where the number of foci increased sharply with growth rate, but cells with two, four or eight foci predominated (Hiraga et al., 1998).

Fig. 7. SeqA foci in cells at different growth rates. Graphs show the distributions of numbers of GFP–SeqA foci in ∼100 cells scored. Micrographs show representative cells grown in the three different media at 30°C: (A) M9 glucose (doubling time 72 min); (B) M9 glucose plus casamino acids (43 min); (C) LB broth (34 min).
We compared the average number of foci per cell at each growth rate with the average number of forks per cell (Table II). The latter values were estimated from the 30°C cultures used for microscopy using flow cytometry. There appears to be an ∼1:1 correspondence between the number of foci and the number of forks. However, we were unable to determine the number of forks for the slowest growth rate by this method (see Materials and methods). There is also reason to believe that the other values for fork numbers may be underestimated: we measured the growth rates of the cells in the same media at 37°C and calculated the average number of forks expected from known cell cycle parameters (Bremer and Dennis, 1987). Although these theoretical values apply to cells growing at 37°C, they should approximate the values for cells growing in the same media at 30°C, because the composition of the cells does not alter significantly within this temperature range (Helmstetter, 1987). The theoretical values are higher than those obtained by flow cytometry (Table II). Thus, the actual number of foci observed may be somewhat less than the number of forks in the average cell (Table II).
SeqA foci at a very low growth rate
Figure 8 shows the SeqA foci observed in cells growing in minimal medium with glycerol as a carbon source. The doubling time of the cells was ∼160 min at 30°C. Under these conditions, there should be a significant period in the cell cycle when no replication is ongoing (Bremer and Dennis, 1987). Thus, no replication forks should be present in a proportion of the cells. As shown, many cells have no foci under these conditions (31%). This is consistent with the hypothesis that the SeqA foci are tracts of bound SeqA that follow the replication forks. Approximately 60% of the cells had one focus and 9% had two, thus fitting the trend to fewer foci with increasing growth rate seen in Figure 7.
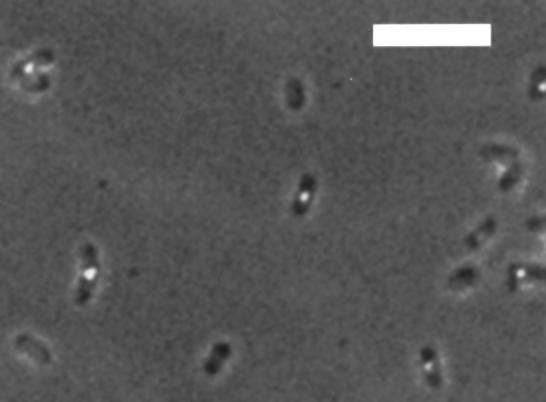
Fig. 8. SeqA foci in cells at a very slow growth rate. Cells were grown in M63 medium with 0.4% glycerol as a carbon source (doubling time ∼160 min at 30°C). Thirty-one percent of the cells had no foci. Sixty percent of the cells had one focus, and 9% had two. The bar is a 5 µm scale indicator.
The location of SeqA foci
The location of SeqA foci in some cells at the slower growth rates showed a comparable pattern with that previously described (Hiraga et al., 1998; Onogi et al., 1999), with cells showing single foci in the cell center, or pairs symmetrically displaced from the center and often at the 1/4 and 3/4 positions (Figures 7A, i–iv, B, i–iv, and 8). However, prominent classes of cells had pairs of foci at the cell center, either aligned with the short axis of the cell or at an oblique angle to it (Figure 7A, v–viii), or had similar pairs at one or both of the 1/4 and 3/4 positions (Figure 7A, v and vii, and B, v–x). Remarkably, a majority of cells with four foci (17 of 27 scored) appeared to have two pairs where each pair was aligned and spaced similarly at the 1/4 and 3/4 positions (see examples, Figure 7B, vii and x).
At the highest growth rate, the cells had multiple foci. These were harder to count as they were often crowded together. Some cells appeared to have >10 foci under these conditions (Figure 7C). The number of foci tended to increase as a function of cell size (data not shown). It is difficult to say whether these multiple foci were placed at specific locations in the cell. However, there were very few foci seen in the central portion of the cells (Figure 7C), and >90% of the cells had an equitable distribution of foci in each half of the cell. The central focus-free regions appeared to correspond to the cytoplasmic space between the separating nucleoids (data not shown).
Discussion
Our results suggest an obligatory side-to-side association of bound SeqA proteins between adjacent hemi-methylated GATC binding sites. At very close spacing, this requirement is probably satisfied by direct contact between the bound units, and the success or failure of binding depends on the relative configuration of the bound proteins and whether they interfere with each other. When suitable wider spacings are encountered, the side-to-side contact appears to be maintained by looping out the intervening DNA. SeqA can bind to suitably spaced sites on supercoiled DNA, but binds with greater affinity to relaxed DNA, and shows better discrimination for the hemi-methylated form of this DNA. We have argued that large tracts of hemi-methylated DNA are likely to track the replication forks. This region immediately following the fork is likely to be in the relaxed state due to the discontinuous nature of DNA strand synthesis. Such tracts would consist of several clusters of bound SeqA molecules (Figure 3C). The clusters may also associate with their neighbors to form a discrete mass or filament of protein with DNA loops. These may form the basis for the discrete SeqA foci seen in living cells. The bound protein would dissociate as it regresses from the fork due to completion of methylation as the DNA matures. New binding of SeqA would occur adjacent to the fork as new hemi-methylated sites are formed by replication. This would result in a net motion of the focus along the DNA in concert with the fork. However, as the forks are thought to be tethered at the plane of cell division (Gordon and Wright, 1998; Lemon and Grossman, 1998; Koppes et al., 1999), the foci would appear to remain stationary during replication as the DNA passes through the replication factory.
Our observations are consistent with this hypothesis. The number of foci increases with increasing growth rate, as is predicted for the number of replication forks. There may be, on average, fewer foci than forks, but this could reasonably be expected if the two forks often lie close to each other, or are separated only in the vertical plane as viewed under the microscope so that two foci merge into one. Note that the two forks must lie together at both initiation and termination of DNA replication. At a very slow growth rate, where a proportion of the cells should have no replication forks at all, many cells had no foci.
We do not know why our results differ from those reported previously, where most cells at higher growth rates had one or two foci (Hiraga et al., 1998), or fell into distinct classes with one, two, four or eight foci per cell (Onogi et al., 1999). In an idealized cell cycle, cells can have either one or two separate nucleoids, and up to three overlapping, synchronous rounds of replication. This would result in cells with either 0, 2, 4, 6, 12 or 14 forks (Bremer and Dennis, 1987). However, any variations in inter-replication time, synchrony or relative rate of fork progression in the two halves of the separating nucleoids would have the effect of smoothing this distribution, and could help to account for the close-to-normal distributions of foci seen in Figure 7. Also, a high incidence of two foci appearing as one would have an additional smoothing effect.
The positions of the replication forks can be predicted by the Factory Model of replication (Gordon and Wright, 1998; Lemon and Grossman, 1998). The machinery for DNA replication in slow growing cells is fixed at the cell center. At initiation, the origin engages the machinery, and the two forks become anchored at the center. The old DNA feeds into the replication machine and the newly replicated DNA is driven away from the anchor points as it is synthesized. The newly synthesized DNA is directed away from the forks such that one nascent nucleoid moves toward each cell pole (Lemon and Grossman, 1998). Folding and condensation of the nascent nucleoid help drive the process so that two separate and compact masses of DNA are formed in each cell half prior to termination (Sawitzke and Austin, 2000).
This simple model can readily be extended to cells at faster growth rates. Here, initiation of a second round of replication occurs before cell division, and the origins of replication of the two daughter nucleoids would attach and initiate at the 1/4 and 3/4 positions, where new replication factory sites are formed. At yet higher growth rates, where the chromosome cycles greatly overlap (Bremer and Dennis, 1987), most cells would have two separate nucleoids with the newest generation of forks at the 1/8, 3/8, 5/8 and 7/8 positions, and the previous generation of forks at the 1/4 and 3/4 positions.
Inspection of Figures 7 and 8 shows that SeqA foci are frequently seen occupying the positions predicted by this model for the positions of the forks. The foci are often seen as symmetrically arranged pairs. Such pairs could be produced by two separated forks anchored in symmetrically disposed positions with respect to the plane of cell division. Alternatively, a pair of forks could produce two foci corresponding to the newly synthesized DNA of each of the two nascent nucleoids as they emerge in different directions from the replication apparatus. At the fastest growth rate, the resolution of the data was insufficient to distinguish whether most foci were in fixed positions at future planes of cell division, as predicted by the Factory Model. However, placement was not random. Multiple foci were conspicuously absent from the DNA-free space between the two separate nucleoids in these cells. Moreover, >90% of cells had an even distribution of foci in each cell half, as would be expected for the distribution of forks in cells with two nucleoids.
Figure 9 shows a model for fork positions, and hence SeqA foci, for cells growing at a moderate rate. It is based on the Factory Model and known cell cycle parameters. The predicted patterns correspond to the observed patterns quite well (Figure 7A and B). Pairs of foci at the cell center or the 1/4 and 3/4 positions are presumably the products of pairs of attached forks. A prominent deviation from the predicted patterns is the case of cells with two foci at the 1/4 position and one at the 3/4 position (Figure 7). These could be explained if the progression of the forks in one nucleoid lagged behind those of the other, such that one of the pairs is too closely spaced to be resolved (Figure 9). Consistent with this, we often noticed that the single focus was brighter than the paired foci in such cells.
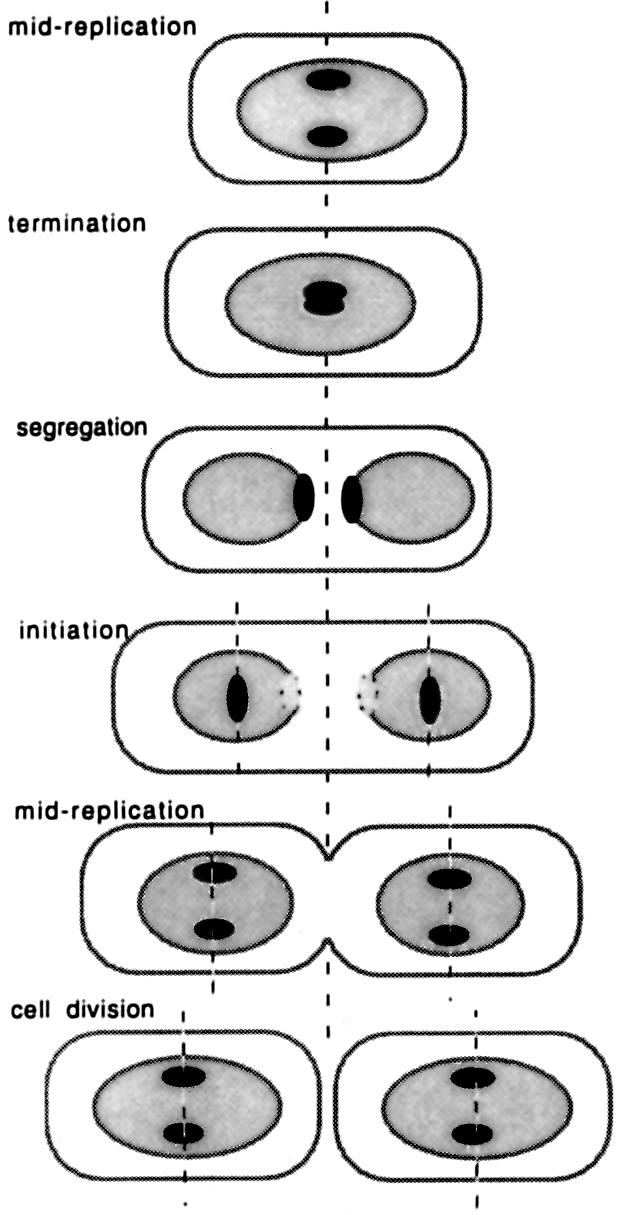
Fig. 9. A model for the distribution of SeqA foci. At a moderate growth rate (50 min generation time at 37°C), newborn cells are in mid-replication and the two forks are anchored at the cell center with their associated SeqA foci. At termination, the forks meet and the two foci coalesce. The SeqA bound to the termini persists for a short time so that the focus appears to split, with the halves moving apart at the borders of the separating nucleoids. These foci fade out as the termini become fully methylated. At initiation, new forks form at the new planes of cell division. As the forks are close together at the origin, the bound SeqA appears as a single focus. As replication proceeds, the forks separate and two pairs of foci are seen. Cell division completes the cycle. Black ovoids, SeqA foci; gray ovoids, nucleoids.
Note that when the forks meet at termination, the two SeqA foci should coalesce around the terminus. As the completed nucleoids segregate away from each other, the bound protein should persist for at least a short time so that the focus would appear to split before fading out, with the two halves regressing from each other as the inner borders of the nucleoid move apart. This may explain the splitting of central foci and rapid motion of the halves away from the center line seen by time-lapse microscopy (Onogi et al., 1999).
It has been suggested that tethering of the replication forks to the cell center and future sites of cell division may play an important role in chromosome segregation (Lemon and Grossman, 1998; Sawitzke and Austin, 2000). seqA mutant cells have aberrant nucleoid structure and a somewhat increased rate of chromosome missegregation (Lu et al., 1994; Bahloul et al., 1996; Boye et al., 1996). The present study favors the hypothesis that SeqA binding tracks along the DNA and thus remains associated with the replication forks during replication. As SeqA is a membrane associated protein (Ogden et al., 1988; Slater et al., 1995; Shakibai et al., 1998), it may be responsible for tethering the forks to the cell center, or for helping to direct the newly replicated DNA away from the plane of cell division in an orderly fashion during replication.
Materials and methods
Materials
Materials and buffers were as previously described (Brendler and Austin, 1999) unless stated otherwise. SeqA protein was purified as previously described (Brendler and Austin, 1999).
Strains and plasmids
Plasmid pGAP40 was constructed by and was a gift from Joe Pogliano and Don Helinski. PCR was used to generate a seqA fragment with EcoRI ends. When inserted into the EcoRI site of pDSW209 (Weiss et al., 1999), the resulting fusion gene encodes a protein with three asparagine residues linking GFP and the second (lysine) residue of SeqA. Plasmid pGB2 was as described (Churchward et al., 1984).
Strain JP313, F– araD139 ΔlacU169 ΔrelA1 rpsL150 thi mot flb5301 deoC7 ptsF25 rbsR Δara714 (Weiss et al., 1999) was used in the GFP–SeqA localization studies. JP748 and JP750 are JP313-containing plasmids pDSW209 and pGAP40, respectively, and were a gift from J.Pogliano and D.Helinski. Strain KO1621 was a gift from Andrew Wright. It has a temperature-sensitive mutation in the dam gene whose synthesis is under control of the tac promoter and is inducible by isopropyl-β-d-thiogalactopyranoside (IPTG). This gene is placed in the chromosome in tandem with the wild-type dam gene in its normal location. Strain CC4248 is derived from MG1655 (Blattner et al., 1997), and is seqAΔ::tet. CC4232 is CC4248 with pGAP40.
Preparation of DNA substrates
Synthesis of 2′-N6-methyladenine-containing oligonucleotides and their radioactive labeling was as previously described (Brendler et al., 1995; Brendler and Austin, 1999). The randomly chosen sequence used for SeqA protein binding studies was as described (Brendler and Austin, 1999). To generate DNA duplexes with two GATC sites at various spacings, GATC site III (Figure 2) was removed by mutating the sequence to GTAC. GATC site II is nested within a 6 bp PvuI site. This 6 bp sequence was placed at various distances from GATC I, maintaining the rest of the sequence as before, to create a series of oligonucleotides with spacings between sites I and II from 4 to 34 bp (Figure 1). The position of site II for each completed oligonucleotide could be confirmed by digestion with PvuI and analysis of the products by gel electrophoresis.
Circular, supercoiled DNA of plasmid pGB2 enriched for hemi-methylation of the GATC sites was prepared as follows. Strain KO1621 has a temperature-sensitive mutation in the dam gene whose synthesis is under control of the tac promoter and is inducible by IPTG. Plasmid pGB2 was introduced by transformation and the resulting cells were grown in M63 glucose medium plus leucine and thiamine with spectinomycin (25 µg/ml) and IPTG (0.3 mM) to an OD600 between 0.5 and 0.6 at 30°C. The cultures were diluted back to 0.4 OD600 with pre-warmed media. The cells were then grown for 1 h at 30°C and the temperature raised to 42°C for 30 min. The cells were poured into pre-chilled tubes containing a 1/10 vol. of 0.1 M sodium azide and 0.1 M EDTA. The cultures were frozen rapidly in a dry ice–ethanol bath and stored at –70°C. Plasmid DNA was extracted using the Qiagen Midi Prep kit (Qiagen, Valencia, CA) according to the manufacturer’s instructions for very low copy number plasmids. The plasmid DNA was then extracted with phenol and chloroform, and excess reagent removed by spin chromatography on Sephacryl S-200 (Amersham Pharmacia Biotech, Piscataway, NJ). The DNA was then treated with exonuclease V (US Biochemical) as recommended by the supplier. Each 100 µl reaction contained 1 µg of DNA and 10 U of exonuclease V. The enzyme was removed by phenol–chloroform extraction and excess phenol–chloroform removed on a Sephacryl S-200 spin column equilibrated with 10 mM Tris–HCl pH 8.0, 0.1 mM EDTA. The entire DNA appeared to be supercoiled circles; no nicked or linear molecules were detectable by gel electrophoresis (data not shown). This plasmid DNA was used directly for filter binding experiments, or was digested into fragments as previously described (Brendler et al., 1995; Brendler and Austin, 1999). Unmethylated and fully methylated pGB2 DNA were made similarly, but using pGB2-containing derivatives of strains KO1607 (dam–) and MC1061 (dam+), respectively.
Tritium-labeled supercoiled pGB2 DNA was prepared by the incorporation of [methyl-3H]thymidine (25 Ci/mmol; Amersham Pharmacia Biotech). Overnight cultures of pGB2-containing derivatives of strains MC1061, KO1607 and KO1621 were diluted 1/50 into M63 glucose media plus leucine, thiamine, 250 µg/ml 2-deoxyadenosine and 4 µg/ml thymidine. The cultures were grown and diluted back to 0.4 OD600 as described for unlabeled supercoiled pGB2 DNA. After 30 min growth at 30°C, 25 µCi/ml [3H]thymidine was added to each culture. After an additional 30 min of growth at 30°C, the cultures were shifted to 42°C for 30 min. The cells were processed and the plasmid DNA was purified exactly as for the unlabeled supercoiled pGB2 DNA.
Fragments of pGB2 DNA were prepared by digesting the unlabeled plasmid DNA with the restriction enzymes NdeI, MseI and ApaLI according to the manufacturer’s recommendations (New England Biolabs). The resulting DNA fragments were labeled using Klenow fragment and [α-32P]thymidine triphosphate (3000 Ci/mmol; Amersham Pharmacia Biotech). Labeling conditions and purification of labeled DNA were as described (Brendler and Austin, 1999).
Assays of SeqA protein binding
SeqA protein was purified as described (Brendler and Austin, 1999). SeqA protein binding to DNA fragments was determined by electrophoretic mobility shift assays (EMSAs) or by 1,10-phenanthroline– copper footprinting as previously described (Brendler et al., 1995; Brendler and Austin, 1999). The filter binding assays and the preparation of nitrocellulose membranes (BA-85; Schleicher and Schuell, Keene, NH) used for the filter binding were as previously described (Brendler et al., 1997). The binding buffer was 90 mM potassium glutamate, 1 mM magnesium acetate, 20 mM Tris acetate pH 7.5, 1 mM dithiothreitol, 0.1 mM EDTA, 5% (v/v) glycerol.
For the assays using tritiated supercoiled DNA, the 25 µl reactions also contained 2 µg of poly(dI–dC) and 25 or 250 ng of labeled pGB2 plasmid DNA (1000 c.p.m.). Relaxed pGB2 DNA was prepared by pre-treating the assay mixture DNA with 12 U of topoisomerase I (Life Technologies) per assay and incubating at 37°C for 2 h prior to the addition of poly(dI–dC) and SeqA protein. Linear DNA was prepared by digesting the supercoiled DNA with NdeI (New England Biolabs) as suggested by the manufacturer, and purifying the cut DNA using the QIAquick PCR purification kit (Qiagen). Completed reaction mixtures were incubated for 30 min at 30°C, filtered through 25 mm diameter nitrocellulose filters and washed once with 500 µl of binding buffer at room temperature. After the filters were dried, they were counted in a scintillation counter.
For the assays using 32P-labeled pGB2 DNA fragments, the 100 µl reactions also contained 8 µg of poly(dI–dC) and 20 ng of labeled pGB2 DNA fragments (95 000 c.p.m.). The reactions were initiated by the addition of SeqA protein. After a 30 min incubation at 30°C, the reactions were filtered through nitrocellulose using a 96-well dot–blot minifold (Schleicher and Schuell). The filtered samples were washed twice with 100 µl aliquots of binding buffer at room temperature. The filtration areas (visible due to the O-ring impressions) were punched out of the damp filter paper and placed in individual 2 ml plastic tubes. Aliquots (50 µl) of 100 mM sodium chloride, 10 mM Tris–HCl pH 8.0, 1 mM EDTA and 0.5% (w/v) SDS were placed in each tube. The bound DNA–protein complexes were eluted overnight at 37°C. The elution buffer was removed from each sample and loaded directly onto an 8% (w/v) polyacrylamide gel. The gels were run and analyzed in the same manner as the EMSAs.
Determination of GFP–SeqA by western blotting
Cells were grown in LB broth to an OD600 of 0.1 at 30°C in medium supplemented with 30 µM IPTG. The cells were lysed, the proteins separated on a 12% polyacrylamide mini gel and transferred to PVDF membrane as described (Brendler et al., 1995). The primary antibody was GFP Living Colors Peptide antibody used according to the manufacturer’s specifications (Clontech Laboratories, Palo Alto, CA). Purified recombinant GFP protein of known concentration was used as a quantitative standard (Clontech Laboratories). The blots were developed using the ECL Western Blotting Analysis System according to the supplied protocol (Amersham Pharmacia Biotech). By comparison of the band intensity with that of a series of dilutions of the GFP standard, the weight of GFP–SeqA/ml culture was determined. Knowing the number of cells in the culture, the number of GFP–SeqA proteins per cell was calculated to be ∼250 per cell.
Fluorescence microscopy
Cells for microscopy were grown to an OD600 of 0.1 at 30°C in medium supplemented with 30 µM IPTG. Cells were viewed with a X100/1.25 plan objective on a Nikon Eclipse E600 microscope using a combination of UV and visible light. Photographs were captured with a Hamamatsu cooled CCD camera (C4742-95; Hamamatsu, Japan) controlled with Openlab software (Improvision, Lexington, MA). The optical images, which show the cell outlines, were merged with the fluorescent images, which showed only the GFP–SeqA foci, to give the composites shown in Figures 7 and 8. Images were exported to Object Image (http://simon.bio.uva.nl/object-image.html) for measurements or Adobe Photoshop for construction of figures.
Flow cytometry
The average number of origins per cell was determined by the flow cytometry ‘run-off’ method as described (Skarstad et al., 1995) with the following modifications. Cells were grown under the appropriate conditions to an OD600 of 0.1 prior to incubation for 3 h with rifampicin (200 µg/ml) and cephalexin (36 µg/ml). After processing, the cells were analyzed in a Bryte SH flow cytometer (Bio-Rad) using the WinBrite software provided.
Flow cytometry run-off experiments were also used to demonstrate the complementation of a seqA null mutation by expression of the GFP–SeqA fusion protein from the inducible plasmid pGAP40. Cells were grown in M9 minimal medium with 1% casamino acids with or without the inducer IPTG, and subjected to flow cytometry as above.
Estimation of the average number of forks per cell
Knowing the average number of origins per cell from flow cytometry and the growth rate of the cells at 37°C, the average number of forks can be determined from known cell cycle parameters (Bremer and Dennis, 1987). Microscopy was carried out on cells grown at 30°C, but the average number of origins and forks per cell should not change significantly between 37 and 30°C in cells grown in the same medium (Cooper and Helmstetter, 1968). We were unable to use this method for cells grown in minimal glucose medium, because the flow cytometry run-off did not go to completion (data not shown). A second, theoretical, estimate of the average number of forks for the cells used for microscopy was made directly from the 37°C growth rates as described by Bremer and Dennis (1987).
Acknowledgments
Acknowledgements
We are indebted to Joe Pogliano and Don Helinski for the gift of the GFP–SeqA fusion construct used in these studies, and to Andrew Wright for the temperature-sensitive dam strain used for production of plasmid DNA enriched for hemi-methylated GATC sites.
References
- Bahloul A., Meury,J., Kern,R., Garwood,J., Guha,S. and Kohiyama,M. (1996) Co-ordination between membrane oriC sequestration factors and a chromosome partitioning protein, TolC (MukA). Mol. Microbiol., 22, 275–282. [DOI] [PubMed] [Google Scholar]
- Blattner F.R. et al. (1997) The complete genome sequence of Escherichia coli K-12. Science, 277, 1453–1474. [DOI] [PubMed] [Google Scholar]
- Boye E., Stokke,T., Kleckner,N. and Skarstad,K. (1996) Coordinating DNA replication initiation with cell growth: differential roles for DnaA and SeqA proteins. Proc. Natl Acad. Sci. USA, 93, 12206–12211. [DOI] [PMC free article] [PubMed] [Google Scholar]
- Bremer H. and Dennis,P.B. (1987) Modulation of chemical composition and other parameters of the cell by growth rate. In Niedhardt,F.C. (ed.), Escherichia coli and Salmonella typhimurium Cellular and Molecular Biology. American Society for Microbiology, Washington, DC, pp. 1527–1542. [Google Scholar]
- Brendler T. and Austin,S. (1999) Binding of SeqA protein to DNA requires interaction between two or more complexes bound to separate hemi-methylated GATC sequences. EMBO J., 18, 2304–2310. [DOI] [PMC free article] [PubMed] [Google Scholar]
- Brendler T., Abeles,A. and Austin,S. (1995) A protein that binds to the P1 origin core and the oriC 13mer region in a methylation-specific fashion is the product of the host seqA gene. EMBO J., 14, 4083–4089. [DOI] [PMC free article] [PubMed] [Google Scholar]
- Brendler T.G., Abeles,A.L., Reaves,L.D. and Austin,S.J. (1997) The iteron bases and spacers of the P1 replication origin contain information that specifies the formation of a complex structure involved in initiation. Mol. Microbiol., 23, 559–568. [DOI] [PubMed] [Google Scholar]
- Campbell J.L. and Kleckner,N. (1990) Escherichia coli oriC and the dnaA gene promoter are sequestered from dam methyltransferase following the passage of the chromosomal replication fork. Cell, 62, 967–979. [DOI] [PubMed] [Google Scholar]
- Churchward G., Belin,D. and Nagamine,Y. (1984) A pSC101-derived plasmid which shows no sequence homology to other commonly used cloning vectors. Gene, 31, 165–171. [DOI] [PubMed] [Google Scholar]
- Cooper S. and Helmstetter,C.E. (1968) Chromosome replication and the division cycle of Escherichia coli B/r. J. Mol. Biol., 31, 519–540. [DOI] [PubMed] [Google Scholar]
- Gordon G.S. and Wright,A. (1998) DNA segregation: putting chromosomes in their place. Curr. Biol., 8, R925–R927. [DOI] [PubMed] [Google Scholar]
- Helmstetter C.E. (1987) Timing of synthetic activities in the cell cycle. In Niedhardt,F.C. (ed.), Escherichia coli and Salmonella typhimurium Cellular and Molecular Biology. American Society for Microbiology, Washington, DC, pp. 1627–1639. [Google Scholar]
- Hiraga S., Ichinose,C., Niki,H. and Yamazoe,M. (1998) Cell cycle-dependent duplication and bidirectional migration of SeqA-associated DNA–protein complexes in Escherichia coli. Mol. Cell, 1, 381–387. [DOI] [PubMed] [Google Scholar]
- Koppes L.J., Woldringh,C.L. and Nanninga,N. (1999) Escherichia coli contains a DNA replication compartment in the cell center. Biochimie, 81, 803–810. [DOI] [PubMed] [Google Scholar]
- Lemon K.P. and Grossman,A.D. (1998) Localization of bacterial DNA polymerase: evidence for a factory model of replication. Science, 282, 1516–1519. [DOI] [PubMed] [Google Scholar]
- Lu M., Campbell,J.L., Boye,E. and Kleckner,N. (1994) SeqA: a negative modulator of initiation in Escherichia coli.Cell, 77, 413–426. [DOI] [PubMed] [Google Scholar]
- Ogden G.B., Pratt,M.J. and Schaechter,M. (1988) The replicative origin of the Escherichia coli chromosome binds to cell membranes only when hemimethylated. Cell, 54, 127–135. [DOI] [PubMed] [Google Scholar]
- Onogi T., Niki,H., Yamazoe,M. and Hiraga,S. (1999) The assembly and migration of SeqA–Gfp fusion in living cells of Escherichia coli. Mol. Microbiol., 31, 1775–1782. [DOI] [PubMed] [Google Scholar]
- Sawitzke J.A. and Austin,S. (2000) Suppression of chromosome segregation defects of Escherichia coli muk mutants by mutations in topoisomerase I. Proc. Natl Acad. Sci. USA, 97, 1671–1676. [DOI] [PMC free article] [PubMed] [Google Scholar]
- Shakibai N., Ishidate,K., Reshetnyak,E., Gunji,S., Kohiyama,M. and Rothfield,L. (1998) High-affinity binding of hemi-methylated oriC by Escherichia coli membranes is mediated by a multiprotein system that includes SeqA and a newly identified factor, SeqB. Proc. Natl Acad. Sci. USA, 95, 11117–11121. [DOI] [PMC free article] [PubMed] [Google Scholar]
- Skarstad K., Bernander,R. and Boye,E. (1995) Analysis of DNA replication in vivo by flow cytometry. Methods Enzymol., 262, 604–613. [DOI] [PubMed] [Google Scholar]
- Slater S., Wold,S., Lu,M., Boye,E., Skarstad,K. and Kleckner,N. (1995) Escherichia coli SeqA protein binds oriC in two different methyl-modulated reactions appropriate to its roles in DNA replication initiation and origin sequestration. Cell, 82, 927–936. [DOI] [PubMed] [Google Scholar]
- Weiss D.S., Chen,J.C., Ghigo,J.M., Boyd,D. and Beckwith,J. (1999) Localization of FtsI (PBP3) to the septal ring requires its membrane anchor, the Z ring, FtsA, FtsQ and FtsL. J. Bacteriol., 181, 508–520. [DOI] [PMC free article] [PubMed] [Google Scholar]