

Abstract
The size and the shape of craniofacial bones results from periosteal activity, which can be either appositional or resorptive. The periosteum is often used as a source of graft material for osteogenesis, but differences in cellular makeup and proliferative capacity may render resorptive regions unsuitable for transplant. This study was undertaken to characterize the cells in appositional and resorptive periosteum, and to assess variation in proliferative activity. Young pigs (n = 9) were injected with bromodeoxyuridine to label replicating cells and killed 3 h later. The mandibular ramus, hard palate and zygomatic arch were examined for patterns of periosteal activity, and replicating cells were quantified in 16 appositional and eight resorptive regions. Sections were also reacted for markers of osteogenic (Runx2) and osteoclastic [CTR (calcitonin receptor), RANK, TRAP, CD14] lineage, and for an endothelial label (lectin). Replicating cells were often associated with the vasculature; most were unreactive for markers of differentiation. Although the fibrous layers of periosteum had fewer replicating cells per unit area than inner layers (P < 0.005), this was in part due to lower cellularity. Appositional periostea differed from resorptive periostea in having thicker fibrous layers (197 vs. 89 μm, P = 0.02) and higher replication density in the inner layers (606 vs. 329 labeled cells mm−2, P = 0.02). Osteoprogenitors were numerous in the inner layers of appositional but very scarce in resorptive periostea. Multinucleated osteoclasts were never seen in appositional regions, but mononuclear cells positive for osteoclastic lineage markers were plentiful, especially in the most rapidly growing areas. These cells appeared to be macrophages accompanying a growth rate so rapid as to resemble a response to trauma. In conclusion, appositional and resorptive periostea differ strikingly in morphology and cell content. Resorptive periosteum is a poor choice for osteogenic grafting.
Keywords: bone apposition, bone resorption, cell replication, periosteum, pig, skull
Introduction
The periosteum has received renewed attention of late because of the realization of the importance of bone diameter in determining strength (Orwoll, 2003), and emerging data showing that periosteal cells are differently regulated than those of the endosteum (Allen et al. 2004; Saxon & Turner, 2006; Colnot, 2009). Periosteal activity is particularly important for the skull, because the flat dermal bones of the craniofacial skeleton lack growth cartilages and enlarge exclusively by membranous apposition. Interest in the periosteum also stems from its use as a graft material and as a source of mesenchymal cells (O'Driscoll et al. 2001; Ueno et al. 2001), at least some of which are multipotent (De Bari et al. 2006). Craniofacial periosteum, possibly because of its predominantly neural crest origin (Leucht et al. 2008), is strongly osteogenic, an extreme example being that of antler regeneration (Li et al. 2007). Mechanisms by which periosteum promotes osteogenesis include paracrine factors (Cadet et al. 2003), promotion of vascularity (Brey et al. 2007), the presence of osteoprogenitors (Brey et al. 2007), and especially the ability to replicate extensively both in situ and in vitro (Kanou et al. 2005; Zhang et al. 2005; De Bari et al. 2006), thus producing more osteoprogenitors.
Periostea vary among regions (Allen & Burr, 2005) and change with age. Different locations along the same bone can vary in activity from stasis to rapid apposition (Chong et al. 1982), and many periosteal sites are persistently resorptive as they model the shapes of the growing bones (Enlow, 1962; Chong et al. 1982; Orwoll, 2003), although this aspect of periosteal activity is often neglected (Seeman, 2007). Resorptive sites may lack osteoprogenitors, the major proliferative cell type in the periosteum (Tonna & Cronkite, 1962; Baroukh et al. 2000). Such regional variations could conceivably underlie reported species (Eyckmans & Luyten, 2006) and bone (Fujii et al. 2006) differences in periosteal osteogenicity. Periosteal proliferation (Ellender et al. 1988; O'Driscoll et al. 2001) and cellularity (Chong et al. 1982) decrease with age. Thickness decreases with age as well, a change ascribed to failure to replace cells lost to the bone and stretching in response to bone growth (Tonna & Cronkite, 1962). Interestingly, ‘priming’ periosteum by stripping it from the bone surface and then replacing it was found to increase cellularity, proliferation and thickness (Kanou et al. 2005). If periosteal thickness reflects osteogenicity, it would provide a simple diagnostic tool for identifying promising graft donor areas.
An important question is to what extent periosteal activity pattern can be changed. In early development of mouse ribs, appositional vs. resorptive areas are dictated by differential expression of regulatory elements in the Bmp5 locus (Guenther et al. 2008), implying a fundamental, intrinsic distinction between periostea that add bone and periostea that remove bone. Nevertheless, the Bmp5 protein is involved in responsiveness to mechanical loading (Ho et al. 2008), and its regulation might reflect mechanical history rather than genetic predetermination. In the analogous periodontal ligament, reversal of apposition to resorption and vice versa is easily induced by mechanical loads, a process that involves recruitment of osteoprogenitors from the ligament itself and of osteoclast precursors from the local marrow (Rody et al. 2001; Xie et al. 2009). It is more difficult to produce controlled loads on periosteum, but tensile strains tending to pull the periosteum away from the bone (Kanou et al. 2005; Sencimen et al. 2007) are typically osteogenic, whereas pressures against the periosteum usually are associated with resorption (Herring, 1993; Herring & Ochareon, 2005). However, the cellular basis for these responses has not been addressed, and it is not clear that all periostea are equally capable of adapting to new circumstances.
Periostea are stratified. The outer fibrous layer is usually considered to be of secondary or no importance for growth, although there is evidence for the presence of undifferentiated cells (Ueno et al. 2001), and for replication (Decker et al. 1996; Ochareon & Herring, 2007) in the fibrous layer. The inner osteogenic or cambial layer (sometimes divided into an innermost osteoblast layer and an undifferentiated middle layer; Ellender et al. 1988) is the major location of endogenous replication to replace osteoblasts that are lost from the periosteum by incorporation into the bone matrix (Tonna & Cronkite, 1962). Vascular pericytes may also contribute to the replicating osteoprogenitor population (Diaz-Flores et al. 1992), as may circulating cells that enter the periosteum through capillaries (Eghbali-Fatourechi et al. 2007). Because of the continuously remodeling vasculature of an active bone surface, endothelial cells also contribute to the replicating cell population of periostea, as do resident macrophages (‘OsteoMacs’; Pettit et al. 2008). It is not clear what if any replicating cells might reside in the ‘osteogenic’ layer of resorbing periostea. Mononuclear osteoclastic precursors migrate through the fibrous layer and reside in the cambial layer, but are claimed not to replicate in the periosteum (Baroukh et al. 2000). Because resident macrophages are thought to produce osteogenic signaling factors rather than to provide osteoclastic precursors (Pettit et al. 2008), even these might be missing in persistently resorptive periostea. To avoid confusion and recognize the possibility of non-osteogenesis in resorptive periostea, we refer to the ‘osteogenic’ layer as the inner layer in this paper.
The present study was undertaken to characterize the cells in appositional and resorptive periostea in the growing craniofacial skeleton, and to assess differences in their proliferative activity and thickness. Pigs were used because of the ready availability of large samples of periosteum, the functional similarity of their oral apparatus to that of humans (Weaver et al. 1969; Herring, 2003; Wang et al. 2007), and their proposed use as tissue donors for xenotransplantation (Ekser et al. 2009). Three regions were contrasted, the mandibular ramus, the zygomatic arch and the hard palate. All are membrane bones of neural crest origin, and each is considered to have one appositional surface and an opposite, resorptive surface (Enlow & Hans, 1996). In addition to understanding location- and age-specific differences in cell makeup, proliferative activity and periosteal thickness, specific questions of interest included the following. (i) Are osteoprogenitor cells missing from persistently resorptive periostea? If present, do they replicate? (ii) Does periosteal thickness reflect its proliferative or osteogenic activity? (iii) To what extent does the fibrous layer participate in periosteal modeling, and does it differ between appositional and resorptive periostea? (iv) Are the replicating cells found in appositional periosteum all of mesenchymal/osteoprogenitor lineage, or can additional proliferative cell types be identified? (v) Are osteoclast precursors resident in either appositional or resorptive periostea?
Materials and methods
Animals
All animal procedures were reviewed and approved by the University of Washington Institutional Animal Use and Care Committee under protocol 2331-01. Nine (eight male, one female) domestic pigs, three each at 2 weeks old (5.4–6.6 kg), 4 weeks old (7.0–8.8 kg) and 6 weeks old (12.8–14.0 kg) were anesthetized by mask inhalation of isoflurane/nitrous oxide and then injected via ear vein with a 10% solution of 5-bromo-2′-deoxyuridine (BrdU; 35 mg kg−1) in sterile saline, pH 7.4. After a 3-h survival period, pigs were re-anesthetized and perfused through the left ventricle with heparinized saline followed by fixative (Prefer; Anatech, Battle Creek, MI, USA). After 5 days of immersion in fixative, the mandibular ramus, zygomatic arch and hard palate were removed and cut into blocks using a band saw. Blocks were decalcified (Immunocal; Decal Chemical, Tallman, NY, USA or EDTA) for 3–3.5 months and then processed for paraffin sectioning at 7 μm. The right rami and arches were sectioned coronally, and the left sides horizontally. A portion of the palate anterior to the molars was kept intact and sectioned coronally. The remainder of palate was separated by an off-midline cut into a larger right part, sectioned coronally, and a smaller left part, sectioned parasagittally.
Immunohistochemistry
Sections were deparaffinized, rehydrated and reacted with hydrogen peroxide to block endogenous peroxidase. Following phosphate-buffered saline (PBS) washes, sections were incubated with blocking reagents for non-specific Ig (Vector Labs, Burlingame, CA, USA) and protein (Dako, Glostrup, Denmark), plus 10% normal serum derived from the host species for the secondary antibody (Vector). Ig isotype controls were run with each section reacted. Primary antibodies used for two-step immunostaining were mouse monoclonal anti-BrdU (2 μg mL−1; BD, Franklin Lakes, NJ, USA) and anti-hTRAP (10 μg mL−1; Dako), and goat polyclonal anti-hRUNX2, anti-hCTR and anti-hRANK (20 μg mL−1; Santa Cruz Biotechnology, Santa Cruz, CA, USA). After further washes, sections were incubated with the secondary antibody (1 : 50), goat anti-mouse IgG1 conjugated with HRP or AP (Southern Biotechnology, Birmingham, AL, USA) or swine anti-goat IgG similarly conjugated (Biosource, Camarillo, CA, USA). Color was developed using DAB (Ni) or Nova Red for HRP and Vector Red or NBT/BCIP for AP, and sections were counterstained with methyl green (Dako or Vector) and mounted. An alternate three-step method was used with FITC-conjugated mouse anti-BrdU (5 μg mL−1), anti-hCD14 (1 : 50) and lectin GS IB4 (an endothelial label for pigs; Galili, 2001; 2–5 μg mL−1; Dako, Biosource and Vector, respectively), followed by the secondary antibody, rabbit IgG anti-FITC, and the tertiary antibody, swine anti-rabbit IgG/HRP or AP (Biosource). Negative controls for the three-step method were mouse IgG1/FITC (Dako) for the antibodies and PBS for lectin.
Double-staining for BrdU and an additional marker was carried out to identify whether replicating cells belonged to osteogenic, osteoclastic or endothelial lineages. Methodology followed van der Loos (1999) and was analogous to the single staining described above, but used two primary antibodies made in different species. The HRP chromogen (DAB) was developed first, followed by the AP chromogen (Vector Red or NBT/BCIP).
Quantitative analysis
BrdU-reacted sections from each block were used to establish overall patterns of apposition and resorption, to measure thickness, and to quantify replication in the different regions and layers of periosteum. Images were reconstructed at 10 × (CCD camera, Nikon Eclipse E400 microscope, MetaVue software; Molecular Devices, Downington, PA, USA) and overlaid by a 2.3-mm grid (Adobe Photoshop). These were used to identify 89 1-mm-long sites (black and red boxes in Fig. 1), which were then imaged at 100 ×. Each site was classified as appositional (plump osteoblasts lined up on the bone surface), resorptive (multinucleated osteoclasts and Howship's lacunae), remodeling (areas of both apposition and resorption) or quiescent (lining cells only). Examples of the typical histology of appositional and resorptive periostea have been published previously (Herring & Ochareon, 2005), and can also be seen in Figs 3–5. A subset of 51 sites (red boxes in Fig. 1) was used for quantitative analysis. Using the region tools of MetaVue, the inner and fibrous layers were circumscribed to derive the area and thickness of each periosteal layer. The number of BrdU+ nuclei in each layer was counted manually, and expressed as linear density (labeled cells mm−1 of periosteal length) and areal density (labeled cells mm−2).
Fig. 1.
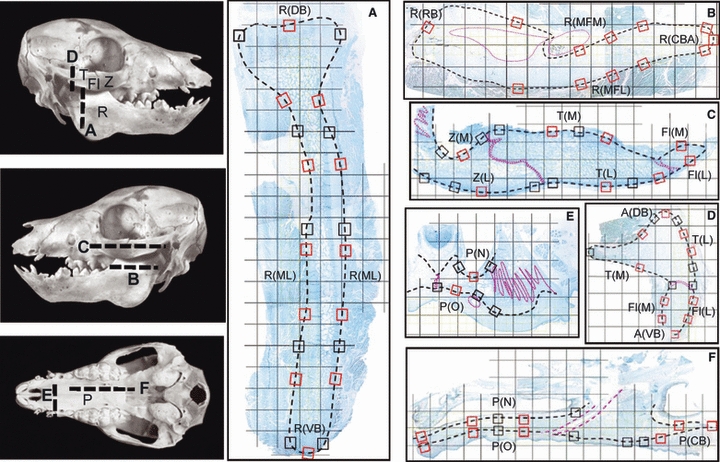
Left, photographs of piglet skulls indicating planes of section for (A–F). The right mandibular ramus and zygomatic arch were sectioned coronally, and the left were sectioned horizontally. Fl, flange of the zygomatic bone; P, palate; R, mandibular ramus; T, temporal bone; Z, zygomatic bone. (A–F) Examples of sections (composite images) overlaid by a 2.3-mm grid. The small boxes are the 89 1-mm locations examined for periosteal appositional or resorptive activity; those outlined in red were also analyzed quantitatively and grouped into regions (see Table 1 for list of region abbreviations). Dotted pink lines indicate sutures and neurovascular bundles. (A) Coronal section through the condylar region of the ramus showing dorsal and ventral borders, R(DB) and R(VB), and ramal surfaces, R(ML). (B) Horizontal section through the ramus showing rostral and caudal borders, R(RB) and R(CBA), and lateral and medial surfaces of the mandibular foramen area, R(MFL) and R(MFM). (C) Horizontal section through the arch showing medial (M) and lateral (L) surfaces of the zygomatic (Z), zygomatic flange (Fl) and temporal (T) bones. (D) Coronal section through the articular region of the arch showing dorsal and ventral borders of the arch, A(DB) and A(VB), as well as lateral and medial surfaces of the temporal bone and zygomatic flange. (E) Coronal section through the hard palate showing nasal and oral surfaces, P(N) and P(O). (F) Parasagittal section through the palate showing the caudal border, P(CB), as well as nasal and oral surfaces.
Fig. 3.
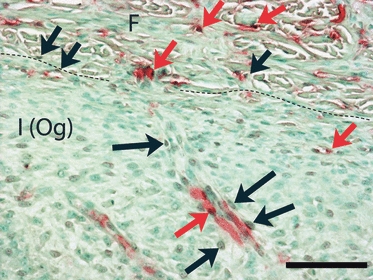
Coronal section from the lateral surface of the temporal bone, double-stained for lectin (Vector Red) and BrdU (DAB/Ni, brown). A dashed line separates the fibrous (F) and inner osteogenic [I (Og)] layers of periosteum. This region is strongly appositional. Double-labeled cells (red arrows) are seen in both layers of periosteum, indicating replication of endothelial cells, probably associated with angiogenesis. In addition, many cells labeled only with BrdU (black arrows) are located one or two cell layers distant from lectin-labeled vessels. These may be pericytes. Calibration bar: 100 μm.
Fig. 5.
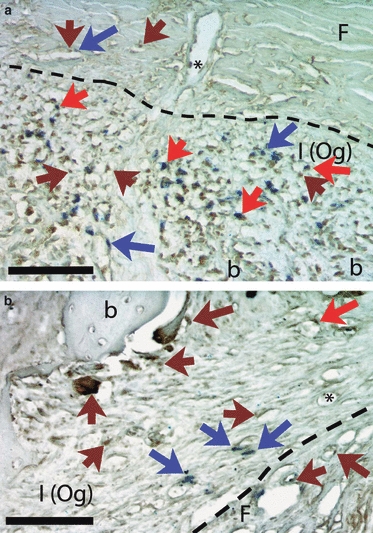
Coronal section through the temporal bone, double-labeled for CTR (calcitonin receptor, Nova Red, which appears as dark red/brown) and BrdU (NBT/BCIP, blue). Dashed lines separate the fibrous (F) and inner [I (Og)] layers of periosteum. (a) Appositional lateral surface. CTR label (brown arrows) is plentiful in the inner layer of periosteum, as is BrdU label (blue arrows), and many cells are double-labeled (red arrows). In the fibrous layer CTR label is seen in cells associated with the vasculature, including one attached to the inner wall of a vessel (asterisk). (b) Resorptive medial surface. CTR label (brown arrows) is prominent in active osteoclasts at the bone surface and in mononucleated cells nearby. BrdU-labeled cells (blue arrows) are less numerous than in (a) and are associated with the vasculature, including one that is double-labeled (red arrow) and one apparently inside a vessel (asterisk). Calibration bars: 100 μm. b, bone.
The 51 locations analyzed quantitatively were grouped into 19 regions generally corresponding to the borders and surfaces of each bone (Table 1). Five of these regions (three mandibular and two medial zygomatic; Table 1) typically included both appositional and resorptive sites; these were considered as separate regions. Thus, a total of 24 regions, 16 appositional and eight resorptive, were analyzed. Left and right sides were averaged to produce a single value for each layer of periosteum for each region of each pig. Statistical comparisons used spss version 10.0 for Windows and GraphPad QuickCalcs.
Table 1.
Regions used for quantitative analysis of periosteal activity
| Bone | Region | Abbreviation for region | Classification of activity* |
|---|---|---|---|
| Mandibular ramus (R) | Caudal border | ||
| Condylar area | R(CBC) | Appositional only | |
| Angular area | R(CBA) | Appositional only | |
| Dorsal border | R(DB) | Appositional and resorptive | |
| Rostral border | R(RB) | Appositional and resorptive | |
| Ventral border | R(VB) | Appositional only | |
| Lateral surface, foramen area | R(MFL) | Appositional only | |
| Medial surface, foramen area | R(MFM) | Resorptive only | |
| Remainder of lateral and medial surfaces | R(ML) | Appositional and resorptive | |
| Hard palate (P) | Oral surface | P(O) | Appositional only |
| Nasal surface | P(N) | Resorptive only | |
| Caudal border | P(CB) | Appositional only | |
| Zygomatic arch (A) | Dorsal border | A(DB) | Appositional only |
| Ventral border | A(VB) | Appositional only | |
| Body of zygomatic bone (Z) | Lateral surface | Z(L) | Appositional only |
| Medial surface | Z(M) | Appositional and resorptive | |
| Zygomatic flange (Fl)† | Lateral surface | Fl(L) | Appositional only |
| Medial surface | Fl(M) | Appositional and resorptive | |
| Temporal bone, zygomatic process (T) | Lateral surface | T(L) | Appositional only |
| Medial surface | T(M) | Resorptive only | |
The 1-mm-long sites that composed these regions are illustrated in Fig. 1. Five regions, R(DB), R(RB), R(ML), Z(M) and F(M) were typically composed of both appositional and resorptive sites, which were separated for analysis.
The zygomatic flange is the ventral extension of the zygomatic bone ventral to the zygomatic process of the temporal bone. See Fig. 1.
Results
Overall patterns of periosteal histology and activity
Most periostea showed good demarcation from surrounding tissues, the only exception being zones of tendinous attachments, where collagen fibers penetrated the periosteum to reach the underlying bone. The junction between the fibrous and inner layers was usually clear and could always be distinguished by examining collagen architecture under epifluorescence. Fibrils in the fibrous layer were dense and usually parallel to the bone surface, whereas the inner layer showed a delicate network with many fibrils pointing toward the bone surface.
A total of 1326 sites (809 mandibular, 216 palatal, 301 arch) were scored. Regional patterns of periosteal activity were similar in all individuals regardless of age, and are illustrated in Fig. 2. Most sites were classified as appositional (68% overall) or resorptive (26%). Remodeling was uncommon (3%). Quiescent surfaces were also rare (2%). The mandibular ramus was resorptive on its rostral border, around the mandibular foramen (Fig. 2b), on both sides of the condylar neck and sometimes both sides of an analogous region near the angular border (Fig. 2a); other locations were appositional. The nasal surface of the palate was resorptive, whereas the oral surface was appositional except for remodeling near the midline suture and the greater palatine groove (Fig. 2e,f). The zygomatic arch was appositional on the lateral surface and borders, whereas the medial surface, especially that of the temporal bone, was predominantly resorptive (Fig. 2c), and the area around the jaw joint showed complex remodeling (Fig. 2d).
Fig. 2.
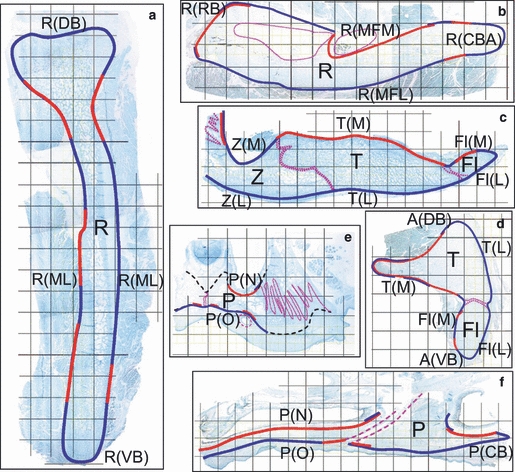
Distribution patterns of appositional (blue lines) and resorptive (red lines) periostea. Overlapping blue and red lines indicate areas where remodeling activity was seen. Dotted pink lines indicate sutures or canals. Black dashed lines indicate surfaces that were not assessed. These diagrams were derived from examination of the sites indicated by black and red boxes in Fig. 1 and extrapolation to neighboring areas. See Table 1 for list of region abbreviations. All nine subjects showed essentially the same activity distribution pattern. (a) Coronal section through the mandibular ramus. (b) Horizontal section through the mandibular ramus. (c) Horizontal section through the zygomatic arch. (d) Coronal section through the zygomatic arch. (e) Coronal section through the hard palate. (f) Parasagittal section through the hard palate. Fl, zygomatic flange; P, palate; R, ramus of mandible; T, temporal bone; Z, zygomatic bone.
Periosteal thickness
Thickness data are summarized in Table 2. Both fibrous and inner layers varied by region, both between and within bones (all anovas, P < 0.01). In general, the palate had relatively thin periosteum, and borders (where tendons often attach) had thicker periosteum than surfaces of bones. Overall, the fibrous layer was thicker (P = 0.02) in appositional periostea (197 ± 122 μm) than in resorptive periostea (89 ± 35 μm), whereas the inner layer showed no difference (140 ± 32 μm vs. 138 ± 38 μm). With increasing age, the fibrous layer showed only random fluctuations in thickness, but the inner layer tended to thin between 4 and 6 weeks old, significantly so (P < 0.05) for two appositional [Fl(L) and R(CBC)] and one resorptive [R(ML)] regions.
Table 2.
Thickness of the periosteum (mean in μm ± SD)
| Fibrous layer | Inner (‘osteogenic’) layer | ||||||||
|---|---|---|---|---|---|---|---|---|---|
| Region* | 2 weeks† | 4 weeks† | 6 weeks† | Combined† | 2 weeks† | 4 weeks† | 6 weeks† | Combined† | |
| Appositional | |||||||||
| Mandible | R(CBC) | 374 ± 157 | 619 ± 654 | 233 ± 96 | 408 ± 379 | 259 ± 16 | 198 ± 3 | 141 ± 30 | 199 ± 54 |
| R(CBA) | 162 ± 4 | 191 ± 5 | 187 ± 50 | 180 ± 29 | 230 ± 26 | 193 ± 48 | 171 ± 25 | 198 ± 40 | |
| R(DB) | 212 ± 186 | 180 ± 80‡ | 121 ± 20 | 170 ± 113 | 170 ± 57 | 163 ± 7‡ | 139 ± 11 | 156 ± 35 | |
| R(RB) | 124 ± 115‡ | – | – | 124 ± 115 | 143 ± 14‡ | – | – | 143 ± 14 | |
| R(VB) | 109 ± 30 | 133 ± 25 | 118 ± 11 | 120 ± 23 | 168 ± 23 | 163 ± 35 | 126 ± 20 | 151 ± 32 | |
| R(MFL) | 40 ± 1 | 63 ± 16 | 65 ± 7 | 56 ± 15 | 112 ± 7 | 98 ± 39 | 67 ± 24 | 92 ± 31 | |
| R(ML) | 100 ± 12 | 104 ± 27 | 93 ± 16 | 99 ± 17 | 145 ± 13 | 138 ± 21 | 97 ± 23 | 129 ± 28 | |
| Palate | P(O) | 97 ± 17 | 109 ± 23 | 106 ± 5 | 104 ± 16 | 105 ± 22 | 126 ± 9 | 99 ± 6 | 110 ± 18 |
| P(CB) | 99§ | 77 ± 13 | 62 ± 11‡ | 75 ± 17 | 65§ | 116 ± 25 | 72 ± 16‡ | 93 ± 32 | |
| Arch | A(DB) | 692 ± 618 | 405 ± 293 | 382 ± 28 | 493 ± 373 | 134 ± 36 | 159 ± 37 | 126 ± 7 | 140 ± 30 |
| A(VB) | 161 ± 22 | 155 ± 38 | 211 ± 25 | 176 ± 36 | 127 ± 20 | 130 ± 17 | 127 ± 21 | 128 ± 17 | |
| Z(L) | 168 ± 39 | 208 ± 10 | 187 ± 14 | 188 ± 28 | 123 ± 32 | 125 ± 31 | 82 ± 23 | 110 ± 33 | |
| Z(M) | 57§ | 262 ± 173 | 132 ± 36 | 177 ± 132 | 155§ | 168 ± 65 | 108 ± 34 | 140 ± 52 | |
| Fl(L) | 222 ± 18 | 310 ± 23 | 296 ± 19 | 276 ± 24 | 134 ± 6 | 153 ± 20 | 109 ± 10 | 132 ± 22 | |
| Fl(M) | 177 ± 143 | 82 ± 43 | 304 ± 323‡ | 173 ± 173 | 183 ± 110 | 107 ± 21 | 134 ± 28‡ | 142 ± 70 | |
| T(L) | 308 ± 9 | 347 ± 21 | 351 ± 49 | 335 ± 34 | 221 ± 72 | 189 ± 18 | 137 ± 4 | 183 ± 53 | |
| All appositional | 197 ± 122 | 140 ± 32 | |||||||
| Resorptive | |||||||||
| Mandible | R(DB) | 104 ± 23‡ | 179 ± 3‡ | 124§ | 138 ± 40 | 119 ± 33‡ | 218 ± 69‡ | 111§ | 157 ± 68 |
| R(RB) | 124 ± 35‡ | – | 153 ± 26‡ | 138 ± 30 | 155 ± 42‡ | – | 208 ± 51 | 182 ± 49 | |
| R(MFM) | 47 ± 19 | 62 ± 29 | 96 ± 5 | 68 ± 28 | 106 ± 32 | 199 ± 38 | 139 ± 61 | 148 ± 57 | |
| R(ML) | 73 ± 42 | 87 ± 17 | 81 ± 10 | 81 ± 24 | 142 ± 32 | 201 ± 5 | 136 ± 15 | 159 ± 35 | |
| Palate | P(N) | 44 ± 6 | 35 ± 6 | 32 ± 5 | 37 ± 7 | 107 ± 20 | 90 ± 5 | 65 ± 8 | 87 ± 22 |
| Arch | Z(M) | 74 ± 4‡ | 44§ | 110 ± 36‡ | 82 ± 33 | 114 ± 21‡ | 103§ | 76 ± 18‡ | 96 ± 24 |
| Fl(M) | 61 ± 14 | 72 ± 35 | 90 ± 62 | 74 ± 38 | 97 ± 9 | 123 ± 53 | 76 ± 19 | 99 ± 35 | |
| T(M) | 87 ± 54 | 89 ± 20 | 115 ± 41 | 97 ± 38 | 178 ± 14 | 187 ± 25 | 150 ± 11 | 172 ± 23 | |
| All resorptive | 89 ± 35¶ | 138 ± 38 | |||||||
For region abbreviations, see Table 1.
n = 3 pigs per age group and nine pigs combined except where specified. Sample size varied because of individual differences in the regional occurrence of modeling activity.
n = 2.
n = 1.
Difference between appositional and resorptive, P = 0.02.
Identity of replicating cells in the periosteum
Despite the brevity of the survival period, BrdU-positive cell nuclei were found in almost every periosteal site examined, as well as in marrow spaces, epithelia, dermal connective tissues and developing teeth. Markers for cells of osteogenic lineage (Runx2, localized in cell nuclei), osteoclastic lineage (CTR, localized in the cytosol and/or cell membrane) and vascular cells (lectin, also found in the cytosol and/or membrane) were also found ubiquitously in the periosteum. In addition to vascular structures, lectin reactivity was prominent in the matrix of the fibrous periosteum. BrdU, Runx2 and CTR were found only in cells. Control slides were negative for all antibodies and for lectin. No age-related differences were apparent in any immunohistochemical patterns.
As quantified below, relatively few BrdU-labeled cells were in the fibrous layer. These were randomly distributed or clustered near vascular walls, with no apparent differences between appositional or resorptive regions. Although a few Runx2- and CTR-positive cells were found in the fibrous layer, mostly near vessels, no double-labeling for these markers and BrdU occurred here. However, BrdU labeling was sometimes seen in lectin-positive vascular cells (Fig. 3).
In contrast, the inner layer of periosteum contained many BrdU-positive cells, including not only lectin-stained vascular cells (Fig. 3), but also numerous cells positive for the osteogenic lineage marker Runx2 (Fig. 4) and many positive for the osteoclastic lineage marker CTR (Fig. 5). BrdU-positive cells were often found near vessels and seemed most frequent in the center of the inner layer. All inner periostea were highly vascular. Lectin staining was especially intense on the nasal surface of the palate, the medial surface of the condyle, the mandibular foramen (all resorptive) and the caudal border of the ramus (appositional).
Fig. 4.

Horizontal section from an appositional region on the lateral surface of the mandible, double-labeled for Runx2 (DAB/Ni, dark brown) and BrdU (Vector Red), showing overlapping populations of replicating vs. osteoprogenitor cells. The dashed red line outlines a spicule of bone, and the dashed black line separates the fibrous (F) and inner [I (Og)] layers of periosteum. Runx2 labeling is heaviest in osteoblasts (black arrows) lining the bone surface, whereas BrdU labeling (red arrows) is more frequent in the middle of the inner layer of periosteum. Occasional double-positive cells (blue arrow) are found in the overlapping region, indicating replicating osteoprogenitors. Calibration bar: 100 μm.
In the inner layer of appositional periostea, Runx2 label was heaviest in newly incorporated osteocytes and osteoblastic cells lining the bone surfaces. Staining diminished toward the fibrous layer, both in intensity and in number of labeled cells. Although all appositional periostea showed this pattern, Runx2 staining was greatest in the caudal border of the mandible and on the lateral surface of the temporal bone. Cells double-positive for Runx2 and BrdU were seen occasionally in the area where the singly-reacted populations overlapped (Fig. 4). No multinucleated osteoclasts were seen in any appositional periosteum. Surprisingly, however, CTR-labeling of mononuclear cells was common, especially on the caudal border of the ramus and the lateral surface of the temporal bone (Fig. 5a). CTR+ cells were distributed throughout the appositional inner layer. Double-labeling of CTR and BrdU was frequent, especially on the lateral side of the temporal bone, one of the most active appositional regions (Fig. 5a). Double-labeled CTR-BrdU cells were often close to, or even inside, small lumens. Because the finding of osteoclastic lineage cells in appositional periosteum was unexpected, additional reactions were carried out using RANK, TRAP protein and enzyme activity, and CD14. All confirmed the presence of mononuclear osteoclastic lineage cells in appositional periosteum.
In the inner layer of resorptive periostea, BrdU+ cells were common near blood vessels. Multinucleated osteoclasts occasionally included some BrdU+ nuclei; these labeled osteoclasts were especially frequent on the neck of the condyle, the mandibular foramen and the medial surface of the temporal bone. Runx2 label was sporadically seen in multinucleated osteoclasts, but Runx2-labeled mononuclear cells were very scarce in resorptive inner layers, and no double-labeling for BrdU and Runx2 was seen. All of the osteoclastic lineage markers (CTR, RANK, TRAP, CD14) produced extensive labeling of mononuclear cells as well as multinucleated osteoclasts in resorptive periostea. Labeled mononuclear cells were often adjacent to multinucleated osteoclasts. Double-labeling for CTR and BrdU was occasionally seen in individual nuclei of osteoclasts and in mononuclear cells in or near vessels (Fig. 5b).
Quantitative analysis of cell replication
Linear density (BrdU+ cells mm−1) and areal density (BrdU+ cells mm−2) gave similar results, so only the latter are given in Table 3. Exceptions are discussed below. Regional differences in replicative density were seen only in the inner layer of appositional periostea (anova,P < 0.001, all other comparisons, P≥ 0.07). The major cause of this result was the very high labeling of the caudal border of the condyle (average 1349 cells mm−2).
Table 3.
Number of BrdU-labeled cells per mm2 of periosteum (mean ± SD)
| Fibrous layer | Inner (‘osteogenic’) layer | ||||||||
|---|---|---|---|---|---|---|---|---|---|
| Region* | 2 weeks† | 4 weeks† | 6 weeks† | Combined† | 2 weeks† | 4 weeks† | 6 weeks† | Combined† | |
| Appositional | |||||||||
| Mandible | R(CBC) | 86 ± 69 | 105 ± 126 | 74 ± 46 | 88 ± 77 | 1051 ± 307 | 852 ± 452 | 2144 ± 116 | 1349 ± 664 |
| R(CBA) | 61 ± 25 | 67 ± 43 | 64 ± 42 | 64 ± 32 | 651 ± 101 | 665 ± 174 | 1665 ± 681 | 993 ± 616 | |
| R(DB) | 164 ± 39 | 418 ± 31‡ | 102 ± 82 | 204 ± 144 | 462 ± 259 | 1760 ± 897‡ | 675 ± 268 | 866 ± 684 | |
| R(RB) | 68 ± 87‡ | – | – | 68 ± 87 | 82 ± 18‡ | – | – | 82 ± 18 | |
| R(VB) | 118 ± 87 | 215 ± 108 | 59 ± 20 | 131 ± 98 | 381 ± 211 | 814 ± 362 | 1078 ± 307 | 788 ± 400 | |
| R(MFL) | 137 ± 105 | 162 ± 145 | 125 ± 10 | 141 ± 91 | 270 ± 28 | 326 ± 116 | 844 ± 458 | 480 ± 362 | |
| R(ML) | 137 ± 42 | 260 ± 33 | 121 ± 36 | 173 ± 73 | 327 ± 73 | 633 ± 224 | 643 ± 94 | 535 ± 201 | |
| Palate | P(O) | 300 ± 123 | 231 ± 85 | 91 ± 51 | 207 ± 122 | 412 ± 103 | 476 ± 204 | 302 ± 92 | 396 ± 145 |
| P(CB) | 136§ | 323 ± 205 | 40 ± 2‡ | 198 ± 192 | 110§ | 626 ± 145 | 178 ± 249‡ | 473 ± 228 | |
| Arch | A(DB) | 63 ± 48 | 277 ± 354 | 38 ± 37 | 126 ± 213 | 591 ± 161 | 1165 ± 282 | 612 ± 144 | 789 ± 333 |
| A(VB) | 39 ± 14 | 237 ± 228 | 21 ± 3 | 99 ± 154 | 129 ± 63 | 655 ± 563 | 533 ± 103 | 445 ± 376 | |
| Z(L) | 252 ± 112 | 194 ± 205 | 27 ± 11 | 157 ± 154 | 498 ± 149 | 749 ± 263 | 359 ± 149 | 535 ± 240 | |
| Z(M) | 470§ | 205 ± 133 | 57 ± 44 | 179 ± 169 | 308§ | 541 ± 159 | 214 ± 136 | 367 ± 205 | |
| Fl(L) | 142 ± 30 | 257 ± 218 | 13 ± 2 | 137 ± 152 | 300 ± 33 | 618 ± 111 | 457 ± 250 | 458 ± 195 | |
| Fl(M) | 215 ± 171 | 459 ± 158 | 31 ± 44‡ | 260 ± 220 | 362 ± 265 | 616 ± 327 | 174 ± 3‡ | 410 ± 293 | |
| T(L) | 109 ± 92 | 184 ± 135 | 15 ± 10 | 107 ± 116 | 488 ± 113 | 624 ± 117 | 1010 ± 73 | 724 ± 243 | |
| All appositional | 146 ± 55¶ | 606 ± 301¶,** | |||||||
| Resorptive | |||||||||
| Mandible | R(DB) | 84 ± 36‡ | 117 ± 54‡ | 79§ | 96 ± 38 | 390 ± 256‡ | 266 ± 86‡ | 196§ | 301 ± 160 |
| R(RB) | 116 ± 60‡ | – | 97 ± 65‡ | 106 ± 52 | 414 ± 367‡ | – | 570 ± 655 | 492 ± 443 | |
| R(MFM) | 257 ± 28 | 306 ± 348 | 206 ± 47 | 257 ± 182 | 308 ± 167 | 211 ± 138 | 354 ± 157 | 291 ± 148 | |
| R(ML) | 197 ± 44 | 349 ± 77 | 163 ± 65 | 236 ± 102 | 320 ± 97 | 521 ± 201 | 257 ± 61 | 366 ± 166 | |
| Palate | P(N) | 227 ± 44 | 332 ± 102 | 117 ± 57 | 226 ± 112 | 216 ± 18 | 445 ± 187 | 296 ± 111 | 319 ± 149 |
| Arch | Z(M) | 76 ± 40‡ | 87§ | 38 ± 5‡ | 63 ± 31 | 93 ± 90‡ | 434§ | 268 ± 2‡ | 253 ± 129 |
| Fl(M) | 75 ± 78 | 233 ± 69 | 21 ± 18 | 110 ± 109 | 99 ± 75 | 850 ± 439 | 137 ± 69 | 362 ± 430 | |
| T(M) | 258 ± 168 | 311 ± 364 | 39 ± 22 | 202 ± 236 | 201 ± 97 | 403 ± 20 | 142 ± 53 | 249 ± 137 | |
| All resorptive | 162 ± 76¶ | 329 ± 79¶,** | |||||||
For region abbreviations, see Table 1.
n = 3 pigs per age group and nine pigs combined except where specified. Sample size varied because of individual differences in the regional occurrence of modeling activity.
n = 2.
n = 1.
Difference between fibrous and inner layers, P < 0.005.
Difference between appositional and resorptive, P = 0.02.
In all regions, the density of BrdU-labeled cells was much higher in the inner layer (overall average 513 ± 280 cells mm−2) than in the fibrous layer (151 ± 61 cells mm−2, P < 0.001). The differential remained when appositional and resorptive periostea were considered separately. The appositional inner layers had, on average, almost twice as many replicating cells mm−2 than the resorptive inner layers (606 vs. 329, P = 0.02; Table 3). In contrast, the fibrous layer of appositional and resorptive periostea did not differ (146 vs. 162, P = 0.6; Table 3).
Although variability was high, age trends can be discerned in Table 3. In the fibrous layer, replicative density increased from 2 to 4 weeks in most regions, a few with statistical significance. However, between 4 and 6 weeks, all regions showed decreases of replication in the fibrous layer, with about 20% of the comparisons being significant. In the inner layer as well, most regions showed modest increases in replicative activity between 2 and 4 weeks (some statistically significant). However, between 4 and 6 weeks different patterns emerged. Significant decreases in replication were seen in three zygomatic arch regions (dorsal border, medial zygomatic flange and medial temporal bone), while significant increases were seen on the lateral temporal bone and the caudal border of the mandibular condyle and angle.
Discussion
Periosteal activity and craniofacial growth
Between 2 and 6 weeks, appositional regions remained consistently appositional and resorptive regions consistently resorptive. No reversals were seen. Thus, the patterns reflect bone modeling during growth rather than physiologically coupled remodeling. The constituent cells of the growing pig periosteum are clearly distinct between appositional periostea and resorptive periostea, as well as among regions and between the fibrous and inner layers.
The regional patterns of appositional and resorptive activity (Fig. 2) correspond very well with accepted patterns of mammalian (including human) craniofacial growth (Enlow & Hans, 1996). In particular, the mandibular ramus expands at its dorsal, ventral and caudal borders, especially near the condyle, while the rostral border is mainly resorptive. The surfaces vary according to Enlow's ‘V-principle’, with apposition toward, and resorption away from, the major growth directions. The hard palate drifts inferiorly by oral apposition and nasal resorption. The zygomatic arch increases its height by growth at its borders, notably the dorsal border. The arch, particularly the temporal bone, moves away from the braincase by drift, with apposition laterally and resorption medially; the zygomatic bone shows a more mixed pattern, probably because it is also displaced laterally by sutural growth.
Using areal density of replicating cells in the inner layer of periosteum as a rough indicator of the rate of modeling, apposition should be fastest at the caudal border of the condyle, followed by the remainder of the caudal border of the mandible (Table 3). Correspondingly, the fastest resorbing area should be the rostral border of the mandibular ramus. Other areas undergoing above-average apposition are the dorsal and ventral borders of the ramus, the dorsal border of the arch, and the lateral surface of the temporal bone. These findings are all consistent with known craniofacial growth patterns. Interestingly, the caudal border regions and the lateral temporal bone were the only regions that were still accelerating their rate of replication in the 4–6-week period (Table 3).
The startling rapidity of BrdU incorporation agrees with our earlier studies on the mandible (Decker et al. 1996; Ochareon & Herring, 2007). Young swine model their bones swiftly; even minipigs show a condylar growth rate of over 400 μm day−1 (17 μm h−1; Ferrari & Herring, 1995), and skeletal turnover is about 2% per day (Bollen et al. 1997). A true cell replication index could not be calculated for the present study because quantifying total cell density was too daunting a task. In the previous limited study, we estimated that 2–3% of fibrous layer cells and 5–10% of inner layer cells were labeled after a 3-h exposure to BrdU (Decker et al. 1996), but only two locations were used. An additional crude estimate of labeling index can be made using published data. Total areal cell density in periosteum is reported as 1000–2500 cells mm−2 for the fibrous layer and 3400–5500 cells mm−2 for the inner layer (O'Driscoll et al. 2001; Simon et al. 2003). Using these figures and average labeling densities of 151 cells mm−2 for the fibrous layer and 513 cells mm−2 for the inner layer (calculated from Table 3), pig craniofacial periostea would have 3-h replication indices of 6–15% for both layers. These figures are higher than our earlier estimates, presumably because highly active regions were not examined in the previous study. Such a high replication index is undoubtedly required to support the extraordinarily rapid growth rate of young pigs. This calculation, if accurate, leads to the surprising conclusion that the inner layer is more replicative than the fibrous layer only because it is more cellular.
The fibrous layer of periosteum
The fibrous layer has a capsular construction with fibers oriented parallel to the bone surface, facilitating its ability to behave as an ‘elastic sleeve’ during growth (Grant et al. 1981; Frankenhuis-van den Heuvel et al. 1992; Ochareon & Herring, 2007). This analogy, which envisions the periosteum ‘stretching’ as the bone enlarges within it, has been used to account for the migration of muscles along bones during growth. The stretching effect should be greatest for the mandible, as growth of this sutureless bone is strongly directional. Notably, however, the fibrous layer did not thin (Table 2), although pig weight doubled and the inner layer did thin in most cases. Thus, if the fibrous layer is stretching, it is simultaneously growing to maintain a constant thickness.
Somewhat surprisingly, the only difference between the fibrous layers of appositional vs. resorptive periostea was in thickness. However, the increased thickness of appositional fibrous layers may be important in terms of absolute numbers of replicating cells. Although both types of periostea had similar areal densities of fibrous layer replicating cells, appositional fibrous layers had more dividing cells per length of bony surface (P = 0.03) and potentially more cells available to move to the inner layer, as argued by others (Ueno et al. 2001) and in contradiction to earlier studies (Tonna & Cronkite, 1962). Another indication that the appositional fibrous layer could help replenish the inner layer is the fact that many of the replicating cells in the fibrous layer were close to vascular structures. Blood vessels traverse both layers of periosteum, providing an avenue for transfer, and vascular pericytes are capable of osteogenic differentiation (Doherty et al. 1998; Crisan et al. 2008). Nevertheless, the fibrous layer cannot be the major source of cells for bone apposition, because from 4 to 6 weeks even the most rapidly appositional regions showed decreases of fibrous layer replicative density (Table 3). Rather, the major source is probably replication of the inner layer cells themselves.
The inner layer of periosteum
Unlike the fibrous layer, the fibrillar component of the inner layer was delicate and organized radial to the bone surface, as reported also for rat calvaria (Simmons et al. 1993). As noted in previous studies (O'Driscoll et al. 2001; Simon et al. 2003), the inner layer tended to thin with age (Table 2), while replicative cell density either increased or decreased depending on the individual region (Table 3). The areas with striking increases were the caudal borders of the ramus and the lateral temporal bone, which also share an unusual pattern of bone growth, with fine, rapidly elongating trabeculae growing out from the surface of the bone into the periosteum (Ferrari & Herring, 1995; Mikos et al. 2006), reminiscent of the ‘regional acceleratory phenomenon’, which is usually considered a reaction of bone to trauma (Bertram & Swartz, 1991), but here is normal growth.
Comparison of the inner layers of appositional and resorptive periostea showed that they differed remarkably in every parameter except thickness and vascular cell labeling. The high level and comparability of lectin staining and lectin-BrdU double staining suggests that both appositional and resorptive regions undergo continuous angiogenesis and vascular remodeling.
Overall, there were far more replicating cells per unit area in appositional than in resorptive inner layers. This provides an interesting parallel to the experimental transformation of an appositional periosteum into a resorptive one, which reduced cell proliferation by 80% within 12 h (Baroukh et al. 2000). In addition to the difference in replication, there was far more Runx2 labeling in appositional periostea. The predominant location of replicating cells a few cell layers away from the active osteoblasts at the appositional bone surface suggests that they were replenishing the osteogenic population, as does the location of cells double-labeled with Runx2 (Fig. 4). Runx2 labeling was almost absent from resorptive inner layers, except for a few osteoclasts that had probably ingested the protein.
The inner layer of resorptive periosteum was extensively labeled with CTR and other osteoclastic lineage markers, both in mature osteoclasts and in mononuclear cells. Many of the mononuclear CTR+ cells and essentially all of those double-labeled for CTR and BrdU were physically inside or attached to blood vessels, indicating fresh recruitment to periosteum via the vasculature. Other CTR+ mononuclear cells may be resident in the periosteum, but the absence of double-labeling suggests they were not formed there. It seems likely that all osteoclast precursors arose in the marrow (Xie et al. 2009). However, we cannot eliminate the possibility that some osteoclast precursors were replicating in the periosteum but were too undifferentiated to express the markers (Baroukh et al. 2000; Van Beek et al. 2002).
The heavy CTR labeling in the inner layers of appositional periostea was not anticipated. That it was not artifactual is shown by the identical results with other markers of osteoclastic lineage. This labeling was most marked in rapidly growing regions that displayed a morphology resembling trauma response, the caudal border of the ramus and the lateral surface of the temporal bone (Fig. 5a). Many of the CTR-expressing cells were double-labeled with BrdU; these were usually associated with blood vessels, so they may not have been replicating in situ. Osteoblast-like cells can endocytose TRAP and presumably other proteins produced by monocytes, but their level of endogenous expression of such proteins is low (Perez-Amodio et al. 2005). Unfortunately, we could not assess the possibility of double-labeling for Runx2 and CTR, because the antibodies employed were both derived from goat. Nevertheless, a more likely interpretation is that these CTR+ cells were monocytes/macrophages, and that local conditions prevented them from maturing into osteoclasts. Monocytes/macrophages are known to be present in periostea of growing bones (Cecchini et al. 1994; Van Beek et al. 2002), as well as mature ones (Ellender et al. 1988; Pettit et al. 2008) and the periodontal ligament (Saffar et al. 1997), although their physiological role is not clear. Non-resorbing osteoclasts stimulate bone formation (Karsdal et al. 2007; Kreja et al. 2010), which is consistent with the high apposition rates associated with the heaviest CTR label. This anabolic function is said to be limited to multinucleated cells (Kreja et al. 2010), which were not present in appositional inner layers. However, in the context of the ‘regional acceleratory phenomenon’ that seems to be occurring in the pig skull, these monocyte/macrophage cells may be acting in a wound-healing fashion, perhaps by secreting osteogenic factors (Champagne et al. 2002; Pettit et al. 2008). In this regard it is interesting that osteogenesis can be increased by periosteum-conditioned medium (Cadet et al. 2003). Another possible function of these monocyte/macrophages might be clearance of apoptotic osteoblasts (Aubin, 1998).
Questions pertaining to potential use of periosteal grafts
The data in hand can now be applied to the original questions of interest. Firstly, we asked whether osteoprogenitor cells were present in resorptive periostea and, if so, whether they were replicative. The answer to this is mostly no. Occasional Runx2+ cells were seen in both the fibrous and the inner layers of resorptive regions, but they were very sparse and were never seen to replicate. Further, inner layer replicative densities were low in resorptive periostea, averaging < 60% of appositional inner layers (data from Table 3). A reversal from resorption to apposition would require a large influx of cells; this would either have to come from a substantial ramp-up of the replication rate or from immigration (Eghbali-Fatourechi et al. 2007). Either way, periosteum from a resorptive region would be a poor choice for grafting, given that donor cell proliferation accounts for most osteogenesis in such procedures (Zhang et al. 2005). Conceivably, the inadvertent use of resorptive periosteum may explain the poor performance of some donor sites, such as rabbit medial tibia (Eyckmans & Luyten, 2006).
Secondly, we asked whether periosteal thickness reflected its proliferative or osteogenic activity. If so, then thickness would be a convenient proxy for graft selection. The general answer is a guarded yes. In addition to the fact that the fibrous layer is thicker in appositional periostea and hence has more cells, correlations calculated from Tables 2 and 3 (all regions considered together) indicate significant positive relationships (i) between fibrous layer thickness and inner layer thickness (r = 0.46, P = 0.045), (ii) between fibrous layer thickness and inner layer replicative areal density (r = 0.64, P = 0.001), and (iii) between inner layer thickness and inner layer replicative density (r = 0.52, P = 0.01). Although these correlations are only moderate, they do indicate that periosteal thickness is a predictor of its proliferative ability, even when resorptive vs. appositional activity is not considered.
The third question was whether the fibrous layer participated in periosteal modeling activity, in which case it could be grafted by itself, as suggested by Ueno et al. (2001), and whether it differed between appositional and resorptive regions. The answer appears to be a partial yes to participation and a partial no to difference. The fibrous layer had a substantial number of replicative cells. Our rough calculation suggested a similar replicative index in the fibrous and inner layers, the difference in areal replicative density arising from the greater cellularity of the inner layer. Most of the dividing cells in the fibrous layer were associated with vessels but did not express any lineage markers; many were probably undifferentiated pericytes, which are likely multipotent mesenchymal cells (De Bari et al. 2006). The continuity of the vasculature between periosteal layers forms natural pathways for these cells to reach the inner layer and the bone surface. The appositional and resorptive fibrous layers differed from each other only in thickness, which would affect the quantity but not the quality of the ability of a graft to regenerate bone.
Fourthly, we asked whether replicating cells in appositional periostea could all be assigned to the mesenchymal/osteogenic lineage. The answer is no. Dividing vascular cells were frequent, and many replicating cells were positive for monocyte/macrophage/osteoclast markers. Indeed, the most actively appositional regions displayed the largest numbers of such cells. However, we cannot eliminate the possibility that these cells had replicated in the marrow and been freshly delivered to the periosteum via the vasculature, because double-labeled CTR+/BrdU+ cells were usually associated with vessels in both appositional and resorptive regions.
The presence of CTR+ cells in appositional periostea answers our fifth and final question, whether osteoclast precursors reside in the periosteum, with a yes. In addition to potential precursors that are too immature to express any lineage markers, which we would not have been able to detect, these CTR+ mononuclear cells constitute a potential population of osteoclast precursors. Interestingly, such cells were evidently blocked from maturing as osteoclasts in appositional regions.
Acknowledgments
This work is based on the Ph.D. dissertation of P.O. (Oral Biology, University of Washington, 2004), for which S.W.H. served as thesis advisor. The research was supported by DE08513 from the National Institute for Craniofacial and Dental Research (NIH, US Public Health Service) to S.W.H. We thank the Royal Thai Government for supporting the education of P.O., Patricia Emry and Frank Starr for technical assistance, and Drs O. Ross Beirne, Jay Decker, David Eyre, Cecilia Giachelli, Gregory King, Katherine Rafferty and Zongyang Sun for helpful advice and discussion.
References
- Allen MR, Burr DB. Human femoral neck has less cellular periosteum, and more mineralized periosteum, than femoral diaphyseal bone. Bone. 2005;36:311–316. doi: 10.1016/j.bone.2004.10.013. [DOI] [PubMed] [Google Scholar]
- Allen MR, Hock JM, Burr DB. Periosteum: biology, regulation, and response to osteoporosis therapies. Bone. 2004;35:1003–1012. doi: 10.1016/j.bone.2004.07.014. [DOI] [PubMed] [Google Scholar]
- Aubin JE. Advances in the osteoblast lineage. Biochem Cell Biol. 1998;76:899–910. [PubMed] [Google Scholar]
- Baroukh B, Cherruau M, Dobigny C, et al. Osteoclasts differentiate from resident precursors in an in vivo model of synchronized resorption: a temporal and spatial study in rats. Bone. 2000;27:627–634. doi: 10.1016/s8756-3282(00)00372-0. [DOI] [PubMed] [Google Scholar]
- Bertram JEA, Swartz SM. The ‘law of bone transformation’: a case of crying Wolff? Biol Rev. 1991;66:245–273. doi: 10.1111/j.1469-185x.1991.tb01142.x. [DOI] [PubMed] [Google Scholar]
- Bollen A-M, McCulloch KJ, Herring SW. Whole body bone resorption in the growing pig. Growth Dev Aging. 1997;61:181–189. [PubMed] [Google Scholar]
- Brey EM, Cheng MH, Allori A, et al. Comparison of guided bone formation from periosteum and muscle fascia. Plast Reconstr Surg. 2007;119:1216–1222. doi: 10.1097/01.prs.0000254361.74614.bb. [DOI] [PubMed] [Google Scholar]
- Cadet ER, Gafni RI, McCarthy EF, et al. Mechanisms responsible for longitudinal growth of the cortex: coalescence of trabecular bone into cortical bone. J Bone Joint Surg Am. 2003;85A:1739–1748. doi: 10.2106/00004623-200309000-00013. [DOI] [PubMed] [Google Scholar]
- Cecchini MG, Dominguez MG, Mocci S, et al. Role of colony stimulating factor-1 in the establishment and regulation of tissue macrophages during postnatal development of the mouse. Development. 1994;120:1357–1372. doi: 10.1242/dev.120.6.1357. [DOI] [PubMed] [Google Scholar]
- Champagne CM, Takebe J, Offenbacher S, et al. Macrophage cell lines produce osteoinductive signals that include bone morphogenetic protein-2. Bone. 2002;30:26–31. doi: 10.1016/s8756-3282(01)00638-x. [DOI] [PubMed] [Google Scholar]
- Chong DA, Evans CA, Heeley JD. Morphology and maturation of the periosteum of the rat mandible. Arch Oral Biol. 1982;27:777–785. doi: 10.1016/0003-9969(82)90029-2. [DOI] [PubMed] [Google Scholar]
- Colnot C. Skeletal cell fate decisions within periosteum and bone marrow during bone regeneration. J Bone Miner Res. 2009;24:274–282. doi: 10.1359/jbmr.081003. [DOI] [PMC free article] [PubMed] [Google Scholar]
- Crisan M, Yap S, Casteilla L, et al. A perivascular origin for mesenchymal stem cells in multiple human organs. Cell Stem Cell. 2008;3:301–313. doi: 10.1016/j.stem.2008.07.003. [DOI] [PubMed] [Google Scholar]
- De Bari C, Dell'Accio F, Vanlauwe J, et al. Mesenchymal multipotency of adult human periosteal cells demonstrated by single-cell lineage analysis. Arthritis Rheum. 2006;54:1209–1221. doi: 10.1002/art.21753. [DOI] [PubMed] [Google Scholar]
- Decker JD, Marshall JJ, Herring SW. Differential cell replication within the periosteum of the pig mandibular ramus. Acta Anat. 1996;157:144–150. doi: 10.1159/000147875. [DOI] [PubMed] [Google Scholar]
- Diaz-Flores L, Gutierrez R, Lopez-Alonso A, et al. Pericytes as a supplementary source of osteoblasts in periosteal osteogenesis. Clin Orthop Relat Res. 1992;275:280–286. [PubMed] [Google Scholar]
- Doherty MJ, Ashton BA, Walsh S, et al. Vascular pericytes express osteogenic potential in vitro and in vivo. J Bone Miner Res. 1998;13:828–838. doi: 10.1359/jbmr.1998.13.5.828. [DOI] [PubMed] [Google Scholar]
- Eghbali-Fatourechi GZ, Mödder UIL, Charatcharoenwitthaya N, et al. Characterization of circulating osteoblast lineage cells in humans. Bone. 2007;40:1370–1377. doi: 10.1016/j.bone.2006.12.064. [DOI] [PMC free article] [PubMed] [Google Scholar]
- Ekser B, Rigotti P, Gridelli B, et al. Xenotransplantation of solid organs in the pig-to-primate model. Transpl Immunol. 2009;21:87–92. doi: 10.1016/j.trim.2008.10.005. [DOI] [PubMed] [Google Scholar]
- Ellender G, Feik SA, Carach BJ. Periosteal structure and development in a rat caudal vertebra. J Anat. 1988;158:173–187. [PMC free article] [PubMed] [Google Scholar]
- Enlow DH. A study of the post-natal growth and remodeling of bone. Am J Anat. 1962;110:79–102. doi: 10.1002/aja.1001100202. [DOI] [PubMed] [Google Scholar]
- Enlow DH, Hans MG. Essentials of Facial Growth. Philadelphia: Saunders; 1996. [Google Scholar]
- Eyckmans J, Luyten FP. Species specificity of ectopic bone formation using periosteum derived mesenchymal progenitor cells. Tissue Eng. 2006;12:2203–2213. doi: 10.1089/ten.2006.12.2203. [DOI] [PubMed] [Google Scholar]
- Ferrari CS, Herring SW. Use of a bite-opening appliance in the miniature pig: modification of craniofacial growth. Acta Anat. 1995;154:205–215. doi: 10.1159/000147770. [DOI] [PubMed] [Google Scholar]
- Frankenhuis-van den Heuvel THM, Maltha JC, Kuijpers-Jagtman AM, et al. A longitudinal radiographic study of the periosteal migration along the growing rabbit mandible. J Dent Res. 1992;71:398–402. doi: 10.1177/00220345920710020901. [DOI] [PubMed] [Google Scholar]
- Fujii T, Ueno T, Kagawa T, et al. Comparison of bone formation in grafted periosteum harvested from tibia and calvaria. Microsc Res Tech. 2006;69:580–584. doi: 10.1002/jemt.20274. [DOI] [PubMed] [Google Scholar]
- Galili U. The alpha-gal epitope (Gal alpha 1-3Gal beta 1-4GlcNAc-R) in xenotransplantation. Biochimie. 2001;83:557–563. doi: 10.1016/s0300-9084(01)01294-9. [DOI] [PubMed] [Google Scholar]
- Grant PG, Buschang PH, Drolet DW, et al. The effect of changes in muscle function and bone growth on muscle migration. Am J Phys Anthropol. 1981;54:547–553. doi: 10.1002/ajpa.1330540408. [DOI] [PubMed] [Google Scholar]
- Guenther C, Pantalena-Filho L, Kingsley DM. Shaping skeletal growth by modular regulatory elements in the Bmp5 gene. PLoS Genet. 2008;4:e1000308. doi: 10.1371/journal.pgen.1000308. [DOI] [PMC free article] [PubMed] [Google Scholar]
- Herring SW. Epigenetic and functional influences on skull growth. In: Hanken J, Hall BK, editors. The Skull. Vol. 1. Chicago: University of Chicago Press; 1993. pp. 153–206. [Google Scholar]
- Herring SW. TMJ anatomy and animal models. J Musculoskelet Neuronal Interact. 2003;3:391–394. [PMC free article] [PubMed] [Google Scholar]
- Herring SW, Ochareon P. Bone – special problems of the craniofacial region. Orthod Craniofac Res. 2005;8:174–182. doi: 10.1111/j.1601-6343.2005.00328.x. [DOI] [PubMed] [Google Scholar]
- Ho AM, Marker PC, Peng H, et al. Dominant negative Bmp5 mutation reveals key role of BMPs in skeletal response to mechanical stimulation. BMC Dev Biol. 2008;8 doi: 10.1186/1471-213X-8-35. doi: 10.1.1186/1471-213X-8-35. [DOI] [PMC free article] [PubMed] [Google Scholar]
- Kanou M, Ueno T, Kagawa T, et al. Osteogenic potential of primed periosteum graft in the rat calvarial model. Ann Plast Surg. 2005;54:71–78. doi: 10.1097/01.sap.0000139562.42726.dd. [DOI] [PubMed] [Google Scholar]
- Karsdal MA, Martin TJ, Bellerslev J, et al. Are nonresorbing osteoclasts sources of bone anabolic activity? J Bone Miner Res. 2007;22:487–494. doi: 10.1359/jbmr.070109. [DOI] [PubMed] [Google Scholar]
- Kreja L, Brenner RE, Tautzenberger A, et al. Non-resorbing osteoclasts induce migration and osteogenic differentiation of mesenchymal stem cells. J Cell Biochem. 2010;109:347–355. doi: 10.1002/jcb.22406. [DOI] [PubMed] [Google Scholar]
- Leucht P, Kim J-B, Amasha R, et al. Embryonic origin and Hox status determine progenitor cell fate during adult bone regeneration. Development. 2008;135:2845–2854. doi: 10.1242/dev.023788. [DOI] [PubMed] [Google Scholar]
- Li C, Mackintosh CG, Martin SK, et al. Identification of key tissue type for antler regeneration through pedicle periosteum deletion. Cell Tissue Res. 2007;328:65–75. doi: 10.1007/s00441-006-0333-y. [DOI] [PubMed] [Google Scholar]
- van der Loos CM. Immunoenzyme Multiple Staining Methods. New York: Springer; 1999. [Google Scholar]
- Mikos A, Herring SW, Ochareon P, et al. Engineering complex tissues. Tissue Eng. 2006;12:3307–3339. doi: 10.1089/ten.2006.12.3307. [DOI] [PMC free article] [PubMed] [Google Scholar]
- Ochareon P, Herring SW. Growing the mandible: role of the periosteum and its cells. Anat Rec. 2007;290:1366–1376. doi: 10.1002/ar.20588. [DOI] [PMC free article] [PubMed] [Google Scholar]
- O'Driscoll SWM, Saris DBF, Ito Y, et al. The chondrogenic potential of periosteum decreases with age. J Orthop Res. 2001;19:95–103. doi: 10.1016/S0736-0266(00)00014-0. [DOI] [PubMed] [Google Scholar]
- Orwoll ES. Toward an expanded understanding of the role of the periosteum in skeletal health. J Bone Miner Res. 2003;18:949–954. doi: 10.1359/jbmr.2003.18.6.949. [DOI] [PubMed] [Google Scholar]
- Perez-Amodio S, Vogels IMC, Schoenmaker T, et al. Endogenous expression and endocytosis of tartrate-resistant acid phosphatase (TRACP) by osteoblast-like cells. Bone. 2005;36:1065–1077. doi: 10.1016/j.bone.2005.03.005. [DOI] [PubMed] [Google Scholar]
- Pettit AR, Chang MK, Hume DA, et al. Osteal macrophages: a new twist on coupling during bone dynamics. Bone. 2008;43:976–982. doi: 10.1016/j.bone.2008.08.128. [DOI] [PubMed] [Google Scholar]
- Rody WJJ, King GJ, Gu G. Osteoclast recruitment to sites of compression in orthodontic tooth movement. Am J Orthod Dentofac Orthop. 2001;120:477–489. doi: 10.1067/mod.2001.118623. [DOI] [PubMed] [Google Scholar]
- Saffar J-L, Lasfargues J-J, Cherruau M. Alveolar bone and the alveolar process: the socket that is never stable. Periodontol 2000. 1997;13:76–90. doi: 10.1111/j.1600-0757.1997.tb00096.x. [DOI] [PubMed] [Google Scholar]
- Saxon LK, Turner CH. Low-dose estrogen treatment suppresses periosteal bone formation in response to mechanical loading. Bone. 2006;39:1261–1267. doi: 10.1016/j.bone.2006.06.030. [DOI] [PubMed] [Google Scholar]
- Seeman E. The periosteum – a surface for all seasons. Osteoporos Int. 2007;18:123–128. doi: 10.1007/s00198-006-0296-6. [DOI] [PubMed] [Google Scholar]
- Sencimen M, Aydintug YS, Ortakoglu K, et al. Histomorphometrical analysis of new bone obtained by distraction osteogenesis and osteogenesis by periosteal distraction in rabbits. Int J Oral Maxillofac Surg. 2007;36:235–242. doi: 10.1016/j.ijom.2006.08.016. [DOI] [PubMed] [Google Scholar]
- Simmons DJ, Menton DN, Miller S, et al. Periosteal attachment fibers in the rat calvarium. Calcif Tissue Int. 1993;53:424–427. [PubMed] [Google Scholar]
- Simon TM, Van Sickle DC, Kunishima DH, et al. Cambium cell stimulation from surgical release of the periosteum. J Orthop Res. 2003;21:470–480. doi: 10.1016/S0736-0266(02)00206-1. [DOI] [PubMed] [Google Scholar]
- Tonna EA, Cronkite EP. An autoradiographic study of periosteal cell proliferation with tritiated thymidine. Lab Invest. 1962;11:455–462. [PubMed] [Google Scholar]
- Ueno T, Kagawa T, Mizukawa N, et al. Cellular origin of endochondral ossification from grafted periosteum. Anat Rec. 2001;264:348–357. doi: 10.1002/ar.10024. [DOI] [PubMed] [Google Scholar]
- Van Beek ER, Lowik CW, Papapoulos SE. Bisphosphonates suppress bone resorption by a direct effect on early osteoclast precursors without affecting the osteoclastogenic capacity of osteogenic cells: the role of protein geranylgeranylation in the action of nitrogen-containing bisphosphonates on osteoclast precursors. Bone. 2002;30:64–70. doi: 10.1016/s8756-3282(01)00655-x. [DOI] [PubMed] [Google Scholar]
- Wang S, Liu Y, Fang D, et al. The miniature pig: a useful large animal model for dental and orofacial research. Oral Dis. 2007;13:530–537. doi: 10.1111/j.1601-0825.2006.01337.x. [DOI] [PubMed] [Google Scholar]
- Weaver ME, Jump EB, McKean CF. The eruption pattern of permanent teeth in miniature swine. Arch Oral Biol. 1969;14:323–331. doi: 10.1016/0003-9969(69)90235-0. [DOI] [PubMed] [Google Scholar]
- Xie R, Kuijpers-Jagtman AM, Maltha JC. Osteoclast differentiation and recruitment during early stages of experimental tooth movement in rats. Eur J Oral Sci. 2009;117:43–50. doi: 10.1111/j.1600-0722.2008.00588.x. [DOI] [PubMed] [Google Scholar]
- Zhang X, Xie C, Lin ASP, et al. Periosteal progenitor cell fate in segmental cortical bone graft transplantations: implications for functional tissue engineering. J Bone Miner Res. 2005;20:2124–2137. doi: 10.1359/JBMR.050806. [DOI] [PMC free article] [PubMed] [Google Scholar]