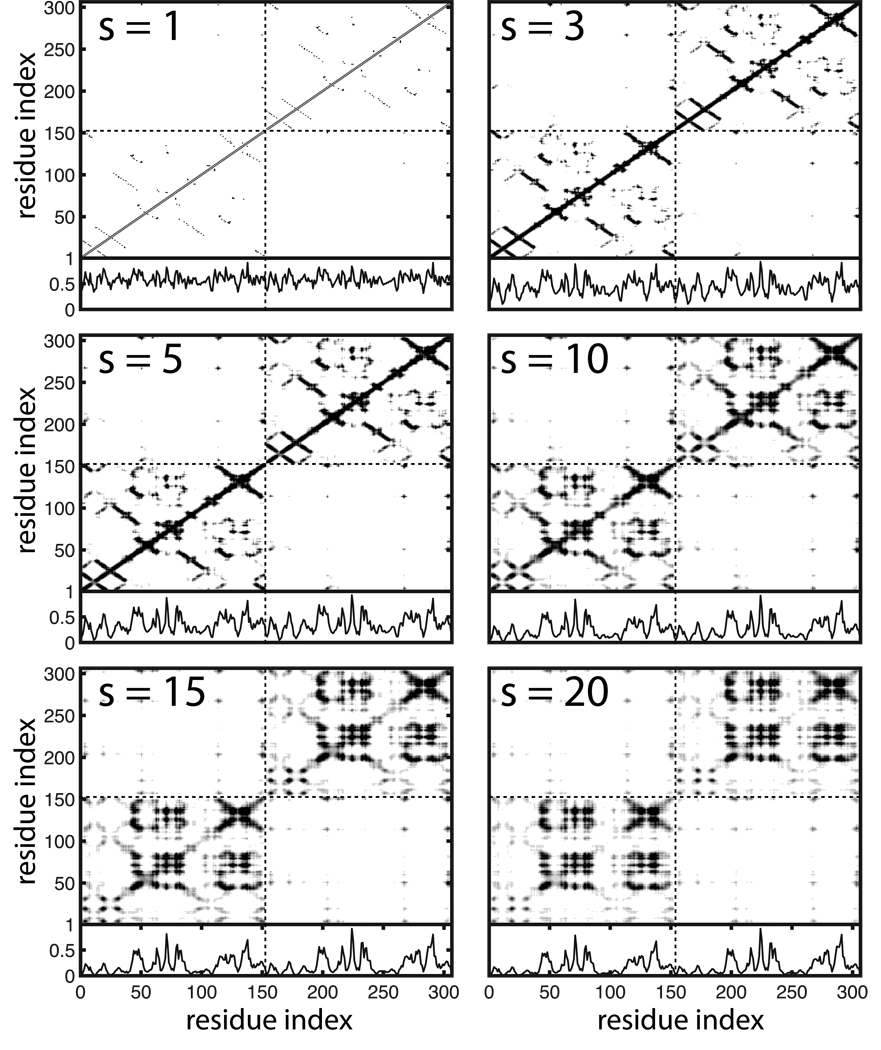
Figure 2. Dual Plot Series for WT SOD1.
The interaction model is shown in the top panel of each dual plot and the normalized degree function is shown in the bottom panel. Dual plots are shown for random walks of length s = {1, 3, 5, 10, 15, 20}. Increasing the random walk length reveals long range network interactions that are not directly captured by the adjacency matrix (s=1). All horizontal axes are according to residue index across the dimer. The vertical axes of the top panels are also by residue index and the vertical axes of the bottom panels are degree metric values normalized on the interval [0, 1]. The dashed lines partition the monomers. The lower left and upper right quadrants of the interaction models correspond to paths between residues within the same monomer. The upper left and lower right quadrants correspond to paths that connect across the dimer interface.

