

Abstract
Objectives
To examine the effect of specific “CSF profiles” on the rate of cognitive decline, disease progression, and risk of conversion to Alzheimer's disease (AD) dementia in patients with amnestic mild cognitive impairment (MCI).
Design
Total tau (t-tau), tau phosphorylated at threonine 181 (p-tau181), and β-amyloid 1-42 peptide (Aβ42) were immunoassayed in CSF samples obtained from MCI patients enrolled in the Alzheimer's Disease Neuroimaging Initiative. Patients were then stratified by “CSF profiles”: (1) normal t-tau and Aβ42 levels (i.e., normal–t-tauAβ42), (2) normal t-tau but abnormal Aβ42 (i.e., abnormal–Aβ42), (3) abnormal t-tau but normal Aβ42 (i.e., abnormal–t-tau), and (4) abnormal t-tau and Aβ42 (i.e., abnormal–t-tauAβ42).
Setting
Fifty-eight sites in the US and Canada.
Participants
One hundred ninety-five MCI patients.
Main Outcome Measures
A composite cognitive measure, the CDR-Sum of Boxes, and conversion to AD.
Results
MCI patients with a CSF profile of abnormal–Aβ42 or abnormal–t-tauAβ42 experienced a faster rate of decline on the composite cognitive measure and the CDR-Sum of Boxes compared to those with normal–t-tauAβ42. They also had a greater risk of converting to AD relative to the normal–t-tauAβ42 group. In contrast, those with a CSF profile of abnormal–t-tau did not differ from the normal–t-tauAβ42 group on any outcome. These findings were generally replicated when the sample was reclassified by patterns of p-tau181 and Aβ42 abnormalities.
Conclusions
β-amyloid abnormalities, but not tau alterations, are associated with cognitive deterioration, disease progression, and increased risk of conversion to AD dementia in patients with MCI. Patients with abnormal levels of Aβ42 may be prime targets for drug treatment and clinical trials in MCI.
Keywords: CSF, MCI, cognitive decline, disease progression, conversion to AD
Introduction
Cerebrospinal fluid (CSF) levels of total tau (t-tau), tau phosphorylated at threonine 181 (p-tau181) and β-amyloid 1-42 (Aβ42) are well-established AD biomarkers.1 The combination of increased t-tau or p-tau181 and decreased Aβ42 is strongly associated with a diagnosis of AD even at its earliest stages.1, 2 For this reason, investigators have examined whether CSF analytes have prognostic value with respect to progression to AD dementia among patients with mild cognitive impairment (MCI).3, 4 These studies found that MCI patients with dual CSF abnormalities (i.e., increased t-tau or p-tau181 and decreased Aβ42) are at increased risk of progressing to AD dementia compared to those patients with normal CSF levels.
A question that has not received much attention regards the longitudinal course and outcome of MCI patients with abnormalities in either tau or Aβ42, but not both. To our knowledge, only two studies have examined differences in cognitive performance and clinical attributes among MCI patients stratified by patterns of CSF alterations.5, 6 Of note, both studies were done using cross-sectional data, and thus, could not provide information regarding the prospective course or long-term outcome of these MCI “CSF profiles.” In this study, we address this knowledge gap by investigating longitudinal course (decline on measures of global cognition and disease progression) and outcome (risk of “conversion” to AD dementia) within a well-characterized group of patients with amnestic MCI, subtyped by their pattern of CSF abnormality.
Methods
Participants
The analyses presented here were based on data from the Alzheimer's Disease Neuroimaging Initiative (ADNI; http://www.loni.ucla.edu/ADNI/). The ADNI was launched in 2003 by the National Institute on Aging and other entities (see Acknowledgments) as a 5-year public-private partnership. Enrollment target was 800 participants—200 normal controls, 400 patients with amnestic MCI, and 200 patients with mild AD—at 58 sites in the United States and Canada. Participants were evaluated at six-month intervals for 2 (mild AD) or 3 (controls and MCI) years. Further details about ADNI, including participant selection procedures and complete study protocol, have been presented elsewhere,1 and may be found online at http://www.nia.nih.gov/Alzheimers/ResearchInformation/ClinicalTrials/ADNI.htm.
The present analyses included all 195 amnestic MCI patients who had valid test results for CSF t-tau, Aβ42, and p-tau181 when data download occurred in September 2009. Diagnosis of amnestic MCI required memory complaints, objective memory difficulties (established using education-specific cut scores on the delayed recall of Story A from the Logical Memory test7), normal activities of daily living, Clinical Dementia Rating scale (CDR) global score of 0.5, and Mini-Mental State Examination (MMSE) scores ≥ 24. Informed consent was obtained from study participants and their families, and the study was approved by the local institutional review board at each participating site.
CSF procedure and APOE genotyping
Full details of the collection and analysis of CSF samples in ADNI have been provided elsewhere.1 Briefly, lumbar puncture was performed in the morning following an overnight fast. Aliquots (0.5 ml) were subsequently prepared from the CSF samples and stored in bar code-labeled polypropylene vials at -80°C. T-tau, Aβ42, and p-tau181 were assayed from these aliquots using the multiplex xMAP Luminex platform (Luminex Corp., Austin, TX) with Innogenetics immunoassay kit-based reagents (INNO-BIA AlzBio3; Ghent, Belgium; for research use-only reagents). Participants also provided EDTA blood samples, on which APOE genotyping was performed using TaqMan assays as previously described.1
Clinical assessment
Participants completed the following neuropsychological measures: Story A from the Logical Memory test,7 Category fluency test (Animals and Vegetables),8 the Boston Naming test,9 Clock drawing test,10 Digit Span test,11 Digit Symbol Substitution test, 11 Trail Making test (A and B),12 and the Rey Auditory Verbal Learning test.13 Taken together, these tests assess the domains of episodic memory, attention, language, executive function, processing speed, and spatial abilities. For our analyses, participants' scores on the neuropsychological measures were transformed to z-scores using group means and standard deviations at baseline. Next, these z-scores were averaged, yielding a composite cognitive measure. Such summary measures reduce floor and ceiling effects and other sources of measurement error. Participants also completed the CDR, the MMSE, the Neuropsychiatry Inventory-Q (NPI-Q),14 and the Geriatric Depression Scale (GDS).15
Data analyses
Abnormality on CSF biomarkers was defined using cutoffs (t-tau>93 pg/ml, Aβ42<192 pg/ml, p-tau181>23 pg/ml) previously shown to maximally discriminate AD subjects from normal controls within the ADNI cohort.1 Next, we created “CSF profiles” among the MCI subjects by cross-tabulating abnormalities on t-tau and Aβ42, based on these cut-offs, to obtain four groups of subjects: (1) those who had normal t-tau and normal Aβ42 (normal–t-tauAβ42), (2) those who had normal t-tau but abnormal Aβ42 (abnormal–Aβ42), (3) those who had abnormal t-tau but normal Aβ42 (abnormal—t-tau), and (4) those who had abnormal t-tau and abnormal Aβ42 (abnormal—t-tauAβ42). We also created a second set of “CSF profiles” by cross-tabulating abnormalities on p-tau181 and Aβ42 to obtain an analogous grouping of subjects.
To investigate potential differences in longitudinal course related to CSF profile, we fitted two random coefficient regressions.16 The first regression modeled rate of change in the composite cognitive measure, whereas the second regression modeled rate of change in the CDR Sum of Boxes (CDR-SB). The CDR-SB is a sum of scores on the six CDR domains, and has been shown to be particularly useful in tracking disease progression and functional impairment over time.17 Both regression models adjusted for APOE ε4 because its distribution significantly varied across groups (Table 1). Cox proportional hazards models,16 adjusted for APOE ε4, were fitted to determine whether risk of converting to AD dementia differed across CSF profiles. Participants were censored at their last visit or the visit they were diagnosed with AD dementia. Analyses were performed using SAS 9.2 or SPSS 16.
Table 1. Characteristics of study participants at baseline: The t-tau—Aβ42 groups.
| Variable | normal–t-tauAβ42, n = 47 | abnormal–Aβ42, n = 61 | abnormal–t-tau, n = 3 | abnormal–t-tauAβ42, n = 84 | p value |
|---|---|---|---|---|---|
| Age, mean (SD) | 73.81 (8.64) | 75.57 (6.25) | 81.67 (7.51) | 73.76 (7.56) | .158 |
| Female, % | 27.00 | 24.60 | 33.30 | 42.90 | .102 |
| Caucasian, % | 93.60 | 96.70 | 66.70 | 96.40 | .093 |
| Education, mean (SD) | 15.92 (2.94) | 16.03 (3.12) | 16.33 (4.73) | 15.60 (2.92) | .824 |
| APOE ε4 +, % | 23.40 | 59.00 | 33.30 | 67.90 | .001 |
| GDS, mean (SD) | 1.72 (1.50) | 1.57 (1.36) | 2.67 (1.53) | 1.67 (1.27) | .576 |
| MMSE, mean (SD) | 27.30 (1.78) | 26.69 (1.83) | 27.00 (1.73) | 26.85 (1.77) | .358 |
| CDR-sum of boxes, mean (SD) | 1.34 (0.73) | 1.56 (0.96) | 1.00 (0.50) | 1.71 (0.90) | .083 |
| CDR-global 0.5, % | 100.00 | 100.00 | 100.00 | 100.00 | --- |
| NPI-Q, mean (SD) | 1.40 (2.67) | 1.85 (2.46) | 1.33 (2.31) | 1.87 (2.14) | .704 |
| Composite cognitive measure, mean (SD) | 0.26 (0.60) | -0.02 (0.45) | 0.21 (0.25) | -0.14 (0.47) | .001 |
APOE ε4 + = possession of one or more copies of apolipoprotein E ε4 allele; GDS = Geriatric Depression Scale; MMSE = Mini-Mental State Examination, CDR = Clinical Dementia Rating scale; NPI-Q = Neuropsychiatric Inventory Questionnaire.
normal–t-tauAβ42 = MCI patients with normal t-tau and normal Aβ42; abnormal–Aβ42 = MCI patients with normal t-tau but abnormal Aβ42; abnormal–t-tau = MCI patients with abnormal t-tau but normal Aβ42; and abnormal–t-tauAβ42 = MCI patients with abnormal t-tau and abnormal Aβ42.
Results
Group characteristics at baseline
The distribution of the CSF profiles formed by cross-tabulating t-tau and Aβ42 levels was: (1) normal–t-tauAβ42 (n=47), (2) abnormal–Aβ42 (n=61), (3) abnormal–t-tau (n=3), and (4) abnormal–t-tauAβ42 (n=84). For the CSF profiles involving p-tau181 and Aβ42, the distribution was: (1) normal–p-tau181Aβ42 (n=39), (2) abnormal–Aβ42 (n=19), (3) abnormal–p-tau181 (n=11), and (4) abnormal–p-tau181Aβ42 (n=126).
Tables 1 and 2 show the results of group comparisons on baseline characteristics. The four groups formed by cross-tabulating t-tau and Aβ42 were statistically indistinguishable on all measures except for the proportion of persons who were APOE ε4 positive and scores on the composite cognitive measure. MCI patients with abnormal–Aβ42 or abnormal–t-tauAβ42 were more likely to be APOE ε4 positive and to have lower scores on the composite cognitive measure compared to those who had normal–t-tauAβ42 or abnormal–t-tau. The four groups formed by cross-tabulating p-tau181 and Aβ42 differed statistically only on these same variables, with a similar pattern of group separation.
Table 2. Characteristics of study participants at baseline: The p-tau181—Aβ42 groups.
| Variable | normal–p-tau181Aβ42, n = 39 | abnormal–Aβ42, n = 19 | abnormal–p-tau181, n = 11 | abnormal–p-tau181Aβ42, n = 126 | p value |
|---|---|---|---|---|---|
| Age, mean (SD) | 74.36 (8.00) | 75.84 (5.43) | 74.00 (11.33) | 74.33 (7.29) | .867 |
| Female, % | 23.10 | 21.10 | 45.50 | 37.30 | .191 |
| Caucasian, % | 94.90 | 100.00 | 81.80 | 96.00 | .129 |
| Education, mean (SD) | 16.08 (3.05) | 15.90 (3.81) | 15.46 (2.94) | 15.76 (2.88) | .918 |
| APOE ε4 +, % | 20.50 | 42.10 | 36.40 | 67.50 | .001 |
| GDS, mean (SD) | 1.72 (1.47) | 1.68 (1.16) | 2.00 (1.67) | 1.62 (1.33) | .833 |
| MMSE, mean (SD) | 27.39 (1.70) | 26.74 (1.85) | 26.91 (2.02) | 26.79 (1.79) | .321 |
| CDR-sum of boxes, mean (SD) | 1.32 (0.77) | 1.89 (1.07) | 1.32 (0.56) | 1.61 (0.90) | .077 |
| CDR-global 0.5, % | 100.00 | 100.00 | 100.00 | 100.00 | --- |
| NPI-Q, mean (SD) | 1.54 (2.88) | 2.05 (1.90) | 0.91 (1.38) | 1.83 (2.33) | .543 |
| Composite cognitive measure, mean (SD) | 0.34 (0.56) | -0.01 (0.44) | -0.02 (0.58) | -0.10 (0.46) | .001 |
APOE ε4 + = possession of one or more copies of apolipoprotein E ε4 allele; GDS = Geriatric Depression Scale; MMSE = Mini-Mental State Examination, CDR = Clinical Dementia Rating scale; NPI-Q = Neuropsychiatric Inventory Questionnaire.
normal–p-tau181Aβ42 = MCI patients with normal p-tau181 and normal Aβ42; abnormal–Aβ42 = MCI patients with normal p-tau181 but abnormal Aβ42; abnormal–p-tau181 = MCI patients with abnormal p-tau181 but normal Aβ42; and abnormal–p-tau181Aβ42 = MCI patients with abnormal p-tau181 and abnormal Aβ42.
Effect of CSF profile on participants' longitudinal course: Composite Cognitive Measure
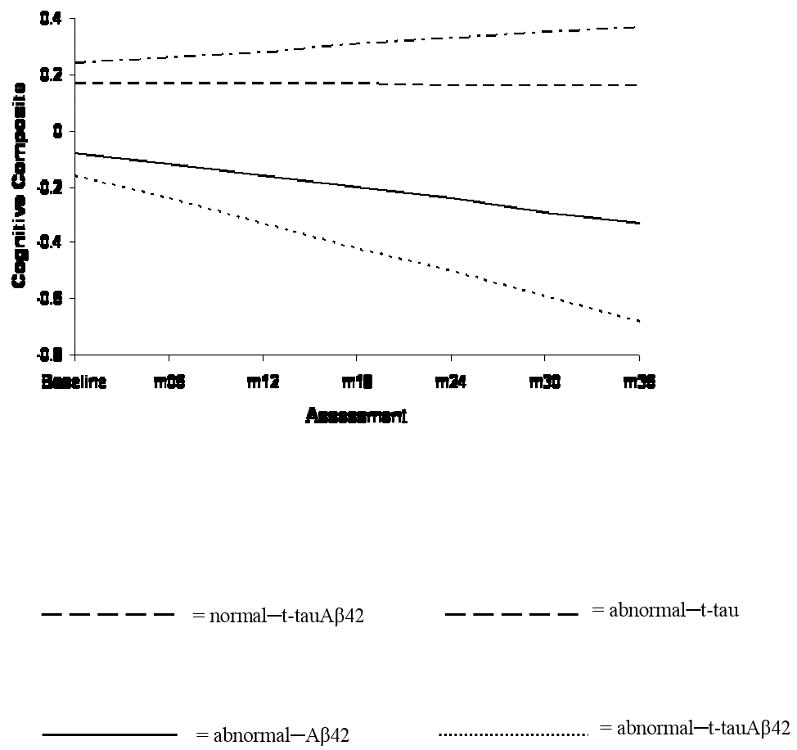
The abnormal–Aβ42 (β=-.06, SE=.02, p=.011) and abnormal–t-tauAβ42 (β=-.11, SE=.02, p=.001) groups experienced significantly faster rates of decline in composite cognition relative to the normal–t-tauAβ42 group. In contrast, the rate of decline within the abnormal–t-tau group (β=-.02, SE=.07, p=.734) did not differ from that of the normal–t-tauAβ42 group. These findings are shown in Figure 1. As is evident, patients with abnormal–t-tauAβ42 declined the fastest of all groups. Similar results (not shown) were obtained within the groups formed by p-tau181 and Aβ42.
Figure 1. Trajectories of change on the composite cognitive measure.
Effect of CSF profile on participants' longitudinal course: CDR-SB
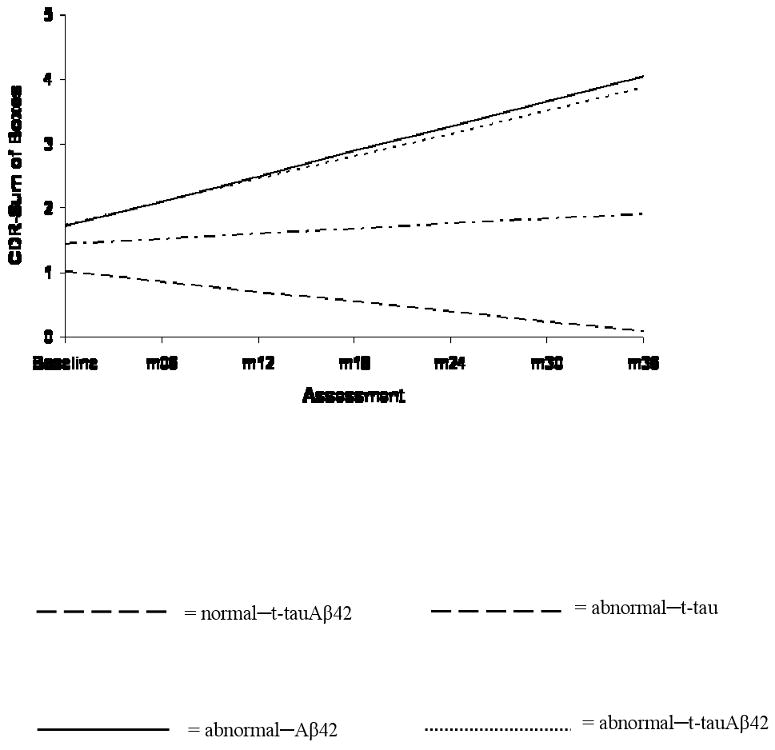
Examination of rates of change on the CDR-SB revealed that whereas the abnormal–Aβ42 (β=.31, SE=.09, p=.001) and abnormal–t-tauAβ42 (β=.27, SE=.09, p=.003) groups experienced significantly faster disease progression compared to the normal–t-tauAβ42 group, the abnormal–t-tau group (β=-.23, SE=.27, p=.386) did not. These trajectories are displayed in Figure 2. Parallel observations (not shown) were made within the p-tau181—Aβ42 groups.
Figure 2. Trajectories of change on the CDR-SB.
Conversion to AD dementia over study duration
Of the 195 MCI patients included in this study, 76 (39%) “converted” to AD dementia within a median follow-up time of 23 months (range = 6 to 39 months). For the four groups formed by cross-tabulating t-tau and Aβ42, the distribution of conversions to AD dementia was: (1) normal–t-tauAβ42 (9/47 = 19.1%), (2) abnormal–Aβ42 (25/61 = 41.0%), (3) abnormal–t-tau (0/3 = 0%), and (4) abnormal–t-tauAβ42 (42/84 = 50%). Within the p-tau181—Aβ42 groups, the breakdown was: (1) normal–p-tau181Aβ42 (7/39 = 17.9%), (2) abnormal–Aβ42 (6/19 = 31.6%), (3) abnormal–p-tau181 (2/11 = 18.2%), and (4) abnormal–p-tau181Aβ42 (61/126 = 48.4%).
Risk of converting to AD dementia as a function of CSF profile
With the normal–t-tauAβ42 group as reference, the risk of converting to AD dementia was significantly higher in the abnormal–Aβ42 and abnormal–t-tauAβ42 groups [HR (95% CI) = 2.43 (1.09, 5.41), p = .029 and 2.71 (1.25, 5.90), p = .012 respectively]. The significance test for the abnormal–t-tau group's risk of conversion (β = -12.29), could not be reliably conducted because none of the three subjects in this group converted to AD dementia which resulted in quasi-complete separation in the data.18 Survival plots for this analysis are shown in Figure 3. Of note, the reported quasi-complete separation did not emerge when the analysis was repeated among the groups formed by the cross-tabulation of p-tau181 and Aβ42.
Figure 3. Cumulative survival plots of rate of conversion to AD.

Analyses of data restricted to 18 months of follow-up
Because the typical length of AD clinical trials is 18 months, we repeated the Cox proportional hazards models using only the data that were acquired within the first 18 months of follow up, to determine whether the foregoing pattern of findings would emerge. There were 55 conversions to AD dementia during this period. Because 76 conversions occurred over the total length of follow up (maximum of 39 months), the majority of conversions evidently occurred during the initial 18-month period. Within the four t-tau—Aβ42 groups, the distribution of conversions was: (1) normal–t-tauAβ42 (7/47 = 14.9%), (2) abnormal–Aβ42 (21/61 = 34.4%), (3) abnormal–t-tau (0/3 = 0%), and (4) abnormal–t-tauAβ42 (27/84 = 32.1%). Within the four p-tau181—Aβ42 groups, the distribution was: (1) normal–p-tau181Aβ42 (5/39 = 12.8%), (2) abnormal–Aβ42 (5/19 = 26.3%), (3) abnormal–p-tau181 (2/11 = 18.2%), and (4) abnormal–p-tau181Aβ42 (43/126 = 34.1%).
The Cox regression analyses showed that the risk for converting to AD dementia was significantly greater for the abnormal–Aβ42 and abnormal–t-tauAβ42 groups [HR (95% CI) = 2.52 (1.03, 6.13), p = .042 and 2.46 (1.02, 5.96), p = .046, respectively] compared to the normal–t-tauAβ42 group. As with the original analysis, the hazard for the abnormal–t-tau group (β = -12.31) was statistically untestbale. These findings were overall replicated within the four groups defined by the cross-tabulation of p-tau181 and Aβ42 (not shown). Thus, the 18-month results are quite consistent with the findings based on the data collected over the entire study period.
Ancillary analyses: CSF biomarker concentrations and longitudinal course and outcome
Because prior MCI investigations of the association between CSF biomarkers and prospective course and outcome have primarily analyzed biomarker concentrations (as opposed to profiles, like we did here),3, 4, 19, 20 we repeated our analyses using biomarker concentrations. Briefly, we fit (i) a random effects regression that simultaneously examined the effects of Aβ42, t-tau, p-tau181, t-tau/Aβ42, and p-tau181/Aβ42 on rate of change in the composite cognitive measure, (ii) another random effects regression that simultaneously examined the effects of these CSF biomarkers on rate of change in the CDR-SB, and finally (iii) a Cox proportional hazards model that simultaneously examined the effects of these CSF biomarkers on risk of converting to AD dementia. All analyses adjusted for APOE ε4. In summary, only Aβ42 (p=.009) and p-tau181 (.026) were associated with rate of cognitive decline; only Aβ42 (p=.001) was associated with rate of increase in CDR-SB scores; and only Aβ42 (p=.001) was associated with risk of conversion to AD dementia. These results support our original findings concerning the centrality of Aβ42 abnormalities with respect to cognitive decline, disease progression, and conversion to AD dementia in this cohort.
Comment
In this study, we examined the relationship of two sets of CSF profiles to three outcome measures: (i) rate of decline on a composite cognitive measure, (ii) rate of disease progression (based on change in CDR-SB scores), and (iii) risk of converting to AD dementia.
Within the four groups formed by cross-tabulating t-tau and Aβ42, we found that, compared to MCI patients with normal–t-tauAβ42, (i) those with either abnormal–Aβ42 or abnormal–t-tauAβ42 had a steeper rate of decline on the composite cognitive measure whereas those with abnormal–t-tau did not; (ii) those with abnormal–Aβ42 or abnormal–t-tauAβ42 experienced a significant worsening of disease whereas those with abnormal–t-tau did not; and (iii) those with abnormal–Aβ42 or abnormal–t-tauAβ42 were at increased risk of converting to AD dementia whereas those with abnormal–t-tau were not any more likely to convert to AD dementia. In summary, these analyses showed that MCI patients with abnormal Aβ42, whether t-tau was normal or not, had worse outcomes, whereas MCI patients with normal Aβ42, even when t-tau was abnormal, had comparatively better outcomes. Similar findings were made when the analyses were repeated within the four groups formed by p-tau181 and Aβ42.
Our manner of creating the CSF subgroups examined in this study is noteworthy. Recent studies have suggested that biomarker ratios may be more sensitive to incipient AD compared to absolute biomarker levels.3, 21 However, by virtue of being ratios, such measures obscure an important distinction between individuals who have “normal tau but abnormal Aβ42” and those who have “abnormal tau but normal Aβ42.” For instance, exploratory analyses in this study found that the abnormal–t-tau group (mean ± SD = .51 ± .09) and the abnormal–Aβ42 group (mean ± SD = .54 ± .23) did not differ on the t-tau/Aβ42 ratio (p= .789). Similarly, the abnormal–p-tau181 group (mean ± SD = .14 ± .04) did not differ from the abnormal–Aβ42 group (mean ± SD = .14 ± .07) on the p-tau181/Aβ42 ratio (p= .771). In contrast with the apparent similarity of these two classes of MCI patients (i.e., those with only abnormal tau and those with only abnormal Aβ42) on the biomarker ratios, our analyses showed that their prospective course and outcome are quite different.22
The overall finding from this study is that, of the two types of CSF abnormalities commonly observed in patients with MCI (i.e., increased t-tau or p-tau181 and decreased Aβ42), abnormally low Aβ42 appears to be the one most closely associated with cognitive decline, disease progression, and risk of converting to AD dementia. This is consistent with prior investigations that found that CSF Aβ42 concentrations are predictive of future conversion to AD dementia among MCI patients whereas tau concentrations are not.6, 19, 23 Because abnormally low CSF Aβ42 is presumed to be due to β-amyloid aggregation in the brain,24 our findings are in accord with the amyloid cascade hypothesis which, in brief, argues that deposition of β-amyloid in the brain is an early event in AD pathogenesis.25 However, we note that the tenets of the amyloid cascade hypothesis remain controversial.26 Indeed, there is some evidence that elevated CSF t-tau or p-tau, but not decreased Aβ42, predict progression from MCI to AD dementia.20 The reasons for these seemingly conflicting findings are not fully understood, and suggest the need for continued investigation of these important questions.2, 27 It is also important to note that although our findings suggest that Aβ42 abnormities are prominently associated with risk of progression to dementia, all models tested in this study consistently demonstrated that persons with combined tau and Aβ42 abnormalities had the worst outcomes.3
This study contributes to the ongoing attempts to identify subgroups of MCI subjects at increased risk of progressing to AD dementia3, 4 by demonstrating that MCI patients with abnormal Aβ42 have an elevated risk of cognitive decline and eventual conversion to AD dementia, even when tau is normal. The ability to detect incipient dementia in patients with MCI has obvious implications for clinical trials. One reason why MCI trials have experienced little success to date is the relatively slow disease progression among some study enrollees, which affects the ability of these trials to test key hypotheses. Enrolling MCI patients who are more likely to convert to AD dementia could shorten the time to attain the primary milestones, reduce the sample size needed for adequate power, and increase the ability to detect treatment effects.28 In addition, the finding that abnormal Aβ42 is comparatively more strongly associated with progressive decline and eventual conversion to AD is that the ability to abrogate the accumulation of Aβ peptides in the brain and/or restore Aβ42 levels in CSF might be a valid outcome for MCI drug trials, especially those in the phase II, proof-of-concept, stage.29 An important caveat is that, in this ADNI cohort, subjects with abnormal Aβ42 were also more likely to be APOE ε4 positive; and, there is some evidence that APOE ε4 carriers might have differential therapeutic response or higher risk of treatment-related toxicity.30
At the present time, no medications have been shown to delay the onset of dementia in patients with MCI.31 However, novel and promising AD therapeutics are currently being tested in clinical trials.2, 32 If these drugs prove therapeutic, there would be a viable role for biomarkers of incipient AD dementia in MCI patients as these drugs are presumably more effective if administered early in the disease process.2 Our findings would suggest that MCI patients with abnormal CSF Aβ42 might be ideal candidates for such therapies because of their comparatively elevated risk of transitioning to AD dementia. In general, because CSF biomarkers putatively reflect biochemical processes in the brain,5, 33 it is foreseeable that they could be used for matching patients to treatment approach (e.g., CSF Aβ42 levels may be used to assign patients to treatments that target β-amyloid plaques).33
A potential limitation of this study is the very small sample size of the group of MCI patients with abnormal–t-tau which resulted in an inability to reliably conduct some significance tests in this study. However, we note that the findings in the p-tau181—Aβ42 tetrad (where the distribution of the groups was relatively more proportional) closely mirrored the findings in the t-tau—Aβ42 models, thus, lending credibility to the observations made in the t-tau—Aβ42 groups. It would be of great interest to see whether this study's key finding—that abnormal Aβ42 is deleterious even when tau is normal—is replicable in other well-characterized and prospectively monitored cohorts of patients with amnestic MCI.
Acknowledgments
Data collection and sharing for this project was funded by the ADNI (Principal Investigator: Michael Weiner; NIH grant U01AG024904). ADNI is funded by the National Institute on Aging, the National Institute of Biomedical Imaging and Bioengineering (NIBIB), and through generous contributions from the following: Pfizer Inc., Wyeth Research, Bristol-Myers Squibb, Eli Lilly and Company, GlaxoSmithKline, Merck & Co. Inc., AstraZeneca AB, Novartis Pharmaceuticals Corporation, Alzheimer's Association, Eisai Global Clinical Development, Elan Corporation plc, Forest Laboratories, and the Institute for the Study of Aging, with participation from the U.S. Food and Drug Administration. Industry partnerships are coordinated through the Foundation for the National Institutes of Health. The grantee organization is the Northern California Institute for Research and Education, and the study is coordinated by the AD Cooperative Study at the University of California, San Diego. ADNI data are disseminated by the Laboratory of Neuro Imaging at the University of California, Los Angeles.
Additional grant support for this project came from the Biomarkers of Cognitive Decline among Normal Individuals (BIOCARD) study (Principal Investigator: Marilyn S. Albert; NIH grant U01AG033655) and from the University of Pennsylvania Alzheimer's Disease Core Center (Principal Investigator: John Q. Trojanowski; NIH grant P30AG010124).
The corresponding author had full access to all of the data reported in this manuscript and takes responsibility for the integrity of the data and the accuracy of the data analyses.
Footnotes
Data used in the preparation of this article were obtained from the Alzheimer's Disease Neuroimaging Initiative (ADNI) database (www.loni.ucla.edu/ADNI). As such, the investigators within the ADNI contributed to the design and implementation of ADNI and/or provided data but did not participate in analysis or writing of this report. ADNI investigators include (complete listing available at www.loni.ucla.edu/ADNI/Collaboration/ADNI_Citations.html).
References
- 1.Shaw LM, Vanderstichele H, Knapik-Czajka M, et al. Cerebrospinal fluid biomarker signature in Alzheimer's disease neuroimaging initiative subjects. Ann Neurol. 2009;65:403–13. doi: 10.1002/ana.21610. [DOI] [PMC free article] [PubMed] [Google Scholar]
- 2.Blennow K, Hampel H. CSF markers for incipient Alzheimer's disease. Lancet Neurology. 2003;2:605–13. doi: 10.1016/s1474-4422(03)00530-1. [DOI] [PubMed] [Google Scholar]
- 3.Hansson O, Zetterberg H, Buchhave P, Londos E, Blennow K, Minthon L. Association between CSF biomarkers and incipient Alzheimer's disease in patients with mild cognitive impairment: A follow-up study. Lancet Neurology. 2006;5:228–34. doi: 10.1016/S1474-4422(06)70355-6. [DOI] [PubMed] [Google Scholar]
- 4.Mattsson N, Zetterberg H, Hansson O, et al. CSF biomarkers and incipient Alzheimer disease in patients with mild cognitive impairment. JAMA. 2009;302:385–93. doi: 10.1001/jama.2009.1064. [DOI] [PubMed] [Google Scholar]
- 5.Nordlund A, Rolstad S, Klang O, et al. Episodic memory and speed/attention deficits are associated with Alzheimer-typical CSF abnormalities in MCI. J Int Neuropsychol Soc. 2008;14:582–90. doi: 10.1017/S135561770808079X. [DOI] [PubMed] [Google Scholar]
- 6.Schoonenboom SN, Visser PJ, Mulder C, et al. Biomarker profiles and their relation to clinical variables in mild cognitive impairment. Neurocase. 2005;11:8–13. doi: 10.1080/13554790490896785. [DOI] [PubMed] [Google Scholar]
- 7.Wechsler D. Wechsler Memory Scale - Revised edition. San Antonio: Psychological Corporation; 1987. [Google Scholar]
- 8.Butters N, Granholm E, Salmon DP, Grant I, Wolfe J. Episodic and semantic memory: a comparison of amnesic and demented patients. J Clin Exp Neuropsychol. 1987;9:479–97. doi: 10.1080/01688638708410764. [DOI] [PubMed] [Google Scholar]
- 9.Kaplan E, Goodglass H, Weintraub S. Boston Naming Test. Philadelphia: Lea & Febiger; 1983. [Google Scholar]
- 10.Goodglass H, Kaplan E. The assessment of aphasia and related disorders. Philadelphia: Lea & Febiger; 1983. [Google Scholar]
- 11.Wechsler D. Wechsler Adult Intelligence Scale - Revised edition. San Antonio: Pscyhological Corporation; 1981. [Google Scholar]
- 12.Reitan RM. Validity of the trail making test as an indicator of organic brain damage. Percept Mot Skills. 1958;8:271–6. [Google Scholar]
- 13.Rey A. L'examen clinique en psychologie. Paris: Presses Universitaires de France; 1964. [Google Scholar]
- 14.Kaufer DI, Cummings JL, Ketchel P, et al. Validation of the NPI-Q, a brief clinical form of the Neuropsychiatric Inventory. J Neuropsychiatry Clin Neurosci. 2000;12:233–9. doi: 10.1176/jnp.12.2.233. [DOI] [PubMed] [Google Scholar]
- 15.Yesavage J. Geriatric depression scale. Psychopharmacol Bull. 1988;24:709–13. [PubMed] [Google Scholar]
- 16.Singer JD, Willett JB. Applied longitudinal data analysis. New York: Oxford University Press; 2003. [Google Scholar]
- 17.O'Bryant SE, Waring SC, Cullum CM, et al. Staging dementia using Clinical Dementia Rating Scale Sum of Boxes scores: A Texas Alzheimer's research consortium study. Arch Neurol. 2008;65:1091–5. doi: 10.1001/archneur.65.8.1091. [DOI] [PMC free article] [PubMed] [Google Scholar]
- 18.Hosmer DW, Lemeshow S. Applied logistic regression. 2nd. New York: John Wiley & Sons, Inc.; 2000. [Google Scholar]
- 19.Hampel H, Teipel SJ, Fuchsberger T, et al. Value of CSF beta-amyloid1-42 and tau as predictors of Alzheimer's disease in patients with mild cognitive impairment. Mol Psychiatry. 2004;9:705–10. doi: 10.1038/sj.mp.4001473. [DOI] [PubMed] [Google Scholar]
- 20.Blom ES, Giedraitis V, Zetterberg H, et al. Rapid progression from mild cognitive impairment to Alzheimer's disease in subjects with elevated levels of tau in cerebrospinal fluid and the APOE epsilon4/epsilon4 genotype. Dement Geriatr Cogn Disord. 2009;27:458–64. doi: 10.1159/000216841. [DOI] [PMC free article] [PubMed] [Google Scholar]
- 21.Fagan AM, Roe CM, Xiong C, Mintun MA, Morris JC, Holtzman DM. Cerebrospinal fluid tau/β-amyloid42 ratio as a prediction of cognitive decline in nondemented older adults. Arch Neurol. 2007;64:343–9. doi: 10.1001/archneur.64.3.noc60123. [DOI] [PubMed] [Google Scholar]
- 22.Okonkwo OC, Alosco ML, Griffith HR, et al. Cerebrospinal fluid abnormalities and rate of decline in everyday function across the dementia spectrum: Normal aging, mild cognitive impairment, and Alzheimer's disease. Arch Neurol. 2010 doi: 10.1001/archneurol.2010.118. in press. [DOI] [PMC free article] [PubMed] [Google Scholar]
- 23.Ivanoiu A, Sindic CJ. Cerebrospinal fluid TAU protein and amyloid beta42 in mild cognitive impairment: Prediction of progression to Alzheimer's disease and correlation with the neuropsychological examination. Neurocase. 2005;11:32–9. doi: 10.1080/13554790490896901. [DOI] [PubMed] [Google Scholar]
- 24.Fagan AM, Mintun MA, Mach RH, et al. Inverse relation between in vivo amyloid imaging load and cerebrospinal fluid Aβ42 in humans. Ann Neurol. 2006;59:512–9. doi: 10.1002/ana.20730. [DOI] [PubMed] [Google Scholar]
- 25.Hardy J. Alzheimer's disease: The amyloid cascade hypothesis: An update and reappraisal. Journal of Alzheimer's Disease. 2006;9:151–3. doi: 10.3233/jad-2006-9s317. [DOI] [PubMed] [Google Scholar]
- 26.Korczyn AD. The amyloid cascade hypothesis. Alzheimers Dement. 2008;4:176–8. doi: 10.1016/j.jalz.2007.11.008. [DOI] [PubMed] [Google Scholar]
- 27.Price JL, Morris JC. So what if tangles precede plaques? Neurobiol Aging. 2004;25:721–3. doi: 10.1016/j.neurobiolaging.2003.12.017. [DOI] [PubMed] [Google Scholar]
- 28.Visser PJ. Use of biomarkers to select the target population for clinical trials in subjects with mild cognitive impairment. Journal of Nutrition, Health & Aging. 2009;13:344–5. doi: 10.1007/s12603-009-0037-6. [DOI] [PubMed] [Google Scholar]
- 29.Broich K. Outcome measures in clinical trials on medicinal products for the treatment of dementia: a European regulatory perspective. Int Psychogeriatr. 2007;19:509–24. doi: 10.1017/S1041610207005273. [DOI] [PubMed] [Google Scholar]
- 30.Salloway S, Sperling R, Gilman S, et al. A phase 2 multiple ascending dose trial of bapineuzumab in mild to moderate Alzheimer disease. Neurology. 2009;73:2061–70. doi: 10.1212/WNL.0b013e3181c67808. [DOI] [PMC free article] [PubMed] [Google Scholar]
- 31.Kirshner HS. Mild cognitive impairment: To treat or not to treat. Current Neurology and Neuroscience Reports. 2005;5:455–7. doi: 10.1007/s11910-005-0033-0. [DOI] [PubMed] [Google Scholar]
- 32.Neugroschl J, Sano M. An update on treatment and prevention strategies for Alzheimer's disease. Current Neurology and Neuroscience Reports. 2009;9:368–76. doi: 10.1007/s11910-009-0054-1. [DOI] [PMC free article] [PubMed] [Google Scholar]
- 33.Blennow K, Zetterberg H. Use of CSF biomarkers in Alzheimer's disease clinical trials. Journal of Nutrition, Health & Aging. 2009;13:358–61. doi: 10.1007/s12603-009-0043-8. [DOI] [PubMed] [Google Scholar]