Abstract
The Pharmacy Curriculum Outcomes Assessment (PCOA) is a standardized examination for assessing academic progress of pharmacy students. Although no other national benchmarking tool is available on a national level, the PCOA has not been adopted by all colleges and schools of pharmacy. Palm Beach Atlantic University (PBAU) compared 2008-2010 PCOA results of its P1, P2, and P3 students to their current grade point average (GPA) and to results of a national cohort. The reliability coefficient of PCOA was 0.91, 0.90, and 0.93 for the 3 years, respectively. PBAU results showed a positive correlation between GPA and PCOA scale score. A comparison of subtopic results helped to identify areas of strengths and weaknesses of the curriculum. PCOA provides useful comparative data that can facilitate individual student assessment as well as programmatic evaluation. There are no other standardized assessment tools available. Despite limitations, PCOA warrants consideration by colleges and schools of pharmacy. Expanded participation could enhance its utility as a meaningful benchmark.
Keywords: curricular outcomes, assessment, milemarker, benchmark, Pharmacy Curriculum Outcomes Assessment
INTRODUCTION
The assessment of curricular outcomes in pharmacy education has taken on greater significance due in part to the rapid expansion of doctor of pharmacy (PharmD) programs and new accreditation standards that call for greater assessment and accountability.1 Pharmacy students are expected to learn large volumes of scientific information and to assimilate that knowledge clinically across multiple disciplines. The comprehensive learning that characterizes pharmacy education suggests that incremental progress examinations could produce useful information about the overall effectiveness of a curriculum in achieving long-term retention and application, as well as providing formative assessment feedback for individual students.1 Standard 15 of the Accreditation Council for Pharmacy Education (ACPE) 2006 revision of Accreditation Standards and Guidelines for the Professional Program Leading to the Doctor of Pharmacy Degree addresses Assessment and Evaluation of Student Learning and Curricular Effectiveness.2 This standard includes a statement that programs should “incorporate periodic, psychometrically sound, comprehensive, knowledge-based and performance-based formative and summative assessments, including nationally standardized assessments (in addition to graduates' performance on licensure examinations) that allow comparisons and benchmarks with all accredited and peer institutions.”2
Outcome assessments have been implemented at some colleges and schools of pharmacy for internal use. The University of Houston conducts 3 annual milemarker examinations, the last being a high-stakes examination that must be passed for students to begin advanced practice experiences.3 Texas Tech University conducts ability-based examinations that focus on “Texas Tech's Top Ten” (institutionally identified global outcomes), along with methods utilized to determine minimum competency scores.4,5 Kirschenbaum and colleagues found that 44% of US pharmacy programs (n = 68) use some form of end-of-year examination and suggested that a validated, standardized assessment instrument from a centralized source would enable schools to benchmark results and make the assessment process less daunting.6 Although a national, standardized progress examination exists in medical education, no such examination has gained favor in pharmacy education.1 The Basic Pharmaceutical Sciences Examination (BPSE) was used by some schools and colleges in the 1980s, but was never shown to correlate to student performance in clinical coursework or on pharmacy practice experiences, and eventually fell out of use.1 In 2008, National Association of Boards of Pharmacy (NABP) created the Pharmacy Curriculum Outcomes Assessment (PCOA), a national, standardized, progress examination.
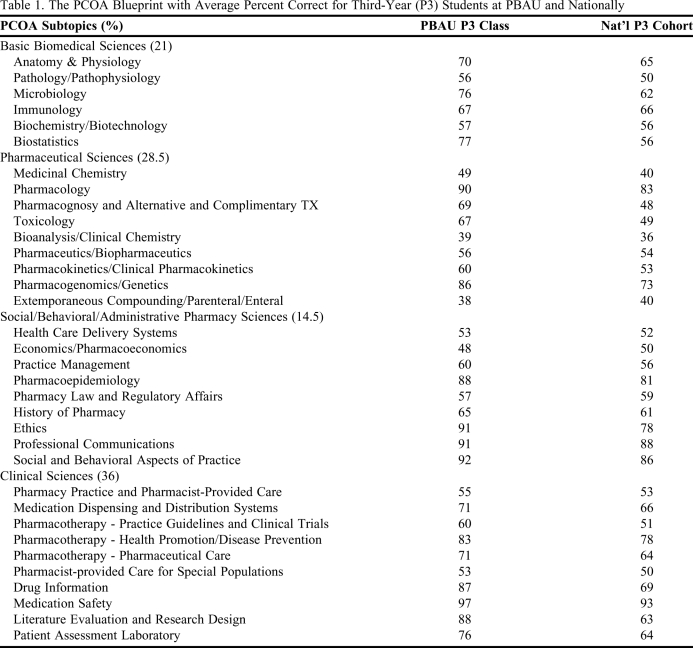
The PCOA was conceptualized by a committee of stakeholders convened by NABP and is based on ACPE Accreditation Standards and Guidelines for the Professional Program Leading to the Doctor of Pharmacy Degree, along with curricular data gathered from accredited pharmacy programs. The complete blueprint, including all 35 subtopics, is listed in Table 1. More information on the development, design, and analysis of the PCOA can be obtained through the National Association of Boards of Pharmacy (http://www.nabp.net/programs/assessment/pcoa/). The 220-item multiple-choice paper-and-pencil examination is administered at participating colleges and schools once annually, during the first quarter of the calendar year, and proctored by contracted NABP representatives.7 The same test is given to students at all levels of a program, with the expectation that students who are further along in a program will demonstrate a higher level of knowledge by achieving a higher score. Scores are analyzed using a Rasch model of item analysis.7 Each student's scores are reported as both a scale score and a percentile rank among all national participants, along with the percent correct for each of the 35 subtopics. Comparative summaries of all students describing results for the total examination as well as breakdowns for the 4 content areas are provided to each college and school. Mean data for the college or school's overall performance is also provided for each content area and subtopic.7
Table 1.
The PCOA Blueprint with Average Percent Correct for Third-Year (P3) Students at PBAU and Nationally
NATIONAL PARTICIPATION IN THE PCOA
In 2008, PCOA was first administered at no cost to colleges and schools of pharmacy across the country, and 24 of the more than 100 programs participated.8 In 2009, the second year of PCOA administration, a charge of $75 per student was instituted. Overall participation dropped to 15 colleges and schools in 2009.8,9 Of the 15 participating programs, 8 had participated in 2008 and 7 participated for the first time (G. Johannes, PCOA Manager, NABP, e-mail, August 19, 2009). Eight of the 15 colleges and schools were new programs (G. Johannes, e-mail, June 24, 2009). The number of participating programs decreased to 14 in 2010 (G. Johannes, e-mail, May 24, 2010).
In comparing student participation in the PCOA among all colleges and schools of pharmacy, the third year (P3) represents the highest level of participation. Student participation by year varied widely among institutions during the first 2 years of the PCOA. In 2008, 8 of 24 colleges and schools (33%) tested all 4 years of students. In 2009 and again in 2010, only 3 colleges and schools (approximately 20%) included participants from all 4 years (G. Johannes, e-mail, August 19, 2009 and May 24, 2010). Some colleges and schools have tested only 1 class, with P1, P2, and P3 years, all represented as the sole participating student group for at least 1 school/college (G. Johannes, e-mail, August 19, 2009). Of colleges and schools that tested only 1 class, P3 students were the most common group selected. Other colleges and schools included various combinations of either 2 or 3 classes out of the 4 years (G. Johannes, e-mail, August 19, 2009 and May 24, 2010).
PCOA PARTICIPATION BY ONE SCHOOL OF PHARMACY
The Lloyd L. Gregory School of Pharmacy at Palm Beach Atlantic University (PBAU) enrolled its first class in 2001 and has a class size of approximately 75. It is a nondenominational Christian university located in West Palm Beach, Florida. The school has been engaged in curricular revision for the past 3 years, so the opportunity to benchmark student performance and curricular effectiveness with other colleges and schools, using a standardized, validated instrument was appealing to the assessment team. The Outcome Improvement Committee (assessment committee) has been administering end-of-year examinations to P1, P2, and P3 students since 2006. However, these examinations have proven to be labor intensive and difficult to validate. The reliability and validity of the examinations have not been determined. The PCOA examination was viewed as a potentially meaningful supplement to the school's assessment activities, one that could greatly enhance efforts to evaluate the effectiveness of ongoing curricular development compared to other colleges and schools.
In 2008, the PCOA examination was administered to all 4 classes. It was required for P1, P2, and P3 students, and voluntary for P4 students. Only 29 (47%) P4 students took the examination that year. Participation among the other 3 classes approached 100%. In 2009 and 2010, the PCOA examination was administered to P1, P2, and P3 students, but not to P4 students, and attendance for the examination was required. This paper describes the results from 3 years of experience with the PCOA at Palm Beach Atlantic University, and how the results compared with national averages, percentiles, and student grade point averages (GPAs).
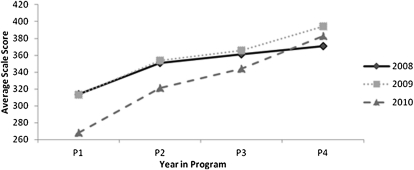
National results from the first administration of the examination in 2008 showed that the internal reliability coefficient, reported as Cronbach's alpha for raw scores from the entire assessment, remained high (0.91) compared to an alpha of 0.90 for the 2007 pilot study.8 In 2009 and 2010, the internal reliability coefficients were 0.90 and 0.93, respectively.9,10 National scale scores increase as students progress from year 1 to year 4. The Pearson's coefficient for years 2008, 2009, and 2010 were 0.8822, 0.9577, and 0.9776, respectively.
At PBAU, for each year of PCOA administration, the cumulative GPA for each student was compared to the student's total scale score. Pearson's coefficient then was used to identify whether a correlation existed between GPA and total scale score for each class. In 2008, there was a strong correlation between GPA and scale score (R = 0.71) for the P3 class, compared to 0.36 and 0.32 for the P1 and P2 classes, respectively. In 2009 and 2010, the correlation between GPAs and scale scores for the P3 class was less pronounced (0.46 and 0.26, respectively). The 2010 P2 class showed little to no correlation between mean GPA and scale score (R = 0.15). Otherwise, Pearson coefficients indicated a modest correlation, with values ranging from 0.25 to 0.49.
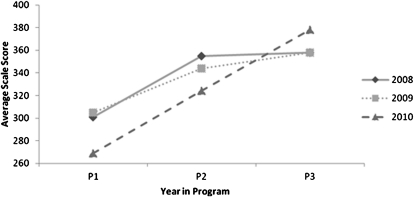
In all 3 years, the national average and PBAU average mean scale score was progressively higher for each year in the program (Figure 1 and Figure 2). Likewise, based on PBAU results, the Pearson's coefficients for 2008 to 2010 showed a strong correlation between scale score and year in program (R > 0.75), with the 2010 correlation equal to 1.0.
Figure 1.
National average Pharmacy Curriculum Outcomes Assessment scale score by year in program.
Figure 2.
Average Pharmacy Curriculum Outcomes Assessment scale score by year in program.
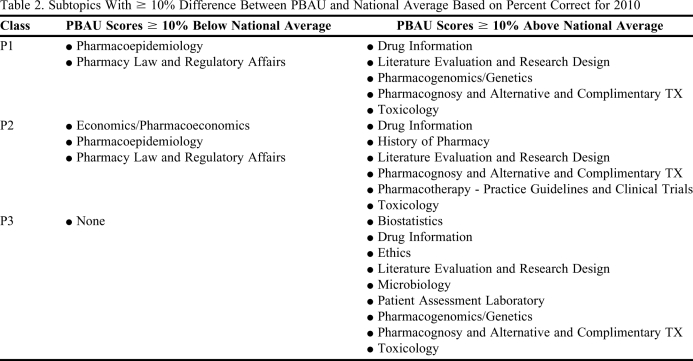
The PCOA report also provides percent correct data for each class for the college or school of pharmacy and nationally. Table 1 lists the overall percent correct for the PBAU P3 class compared with the average results for all P3 students nationally who took the examination. In an attempt to identify areas of either strength or potential need for improvement in the PBAU curriculum, subtopics were identified that differed by at least 10% above or below the national average percent correct. These subtopics are outlined in Table 2 from the 2010 results. Of the 35 subtopics, PBAU P3 students did not score 10% below the national average in any of the subtopics and scored at least 10% above the national average in 9 of the subtopics. The topics identified as 10% or more below the national average for P1 or P2 students (Table 2) will need to be monitored in the coming years to ensure that deficiencies do not appear when current P1 or P2 students take the PCOA as P3 students.
Table 2.
Subtopics With ≥ 10% Difference Between PBAU and National Average Based on Percent Correct for 2010
LIMITATIONS OF PCOA
The greatest limitation of the PCOA is lack of participation nationally, with less than 15% of eligible pharmacy programs using the tool. If more colleges and schools participated in the examination, more data would be available to assess the potential usefulness of PCOA as a benchmark for PharmD programs to evaluate curricula and student progress as indicated in the ACPE standards.
Another possible limitation of the PCOA is the variability in students' level of motivation to do well on the examination, based on how the PCOA is presented to students at various colleges and schools, as well as differences in student requirements around the time of PCOA administration (ie, the demands of the curriculum at the time the PCOA is administered and corresponding student fatigue or distractions). When comparing the performance of students from one college or school to another, such differences could be significant because the examination is administered at different times during the spring semester, and colleges and schools vary considerably in terms of who is required to take the examination and whether there are consequences for poor performance. Student motivation may play a significant role in student performance on the PCOA. Sansgiry et al identified an increase in passing rates among pharmacy students of between 185% and 590% when the college changed incentives for passing milemarker examinations from material awards (eg, reference books) and achievement letters, to bonus points on tests and assigned remediation for not passing.11 PBAU students receive their individual scores along with their national percentile rank. A highlighted color key aids students in identifying areas of strength and weakness among the 4 examination content areas. Students are formally acknowledged if their total rank is at or above the 75th national percentile. Students who rank below the 10th percentile are referred to the Student Success Committee (ie, student progress) for counseling and possible recommendations for improving their academic performance. These recommendations could include drafting an improvement plan with their faculty advisor, participating in additional end-of-year assessment the following year to facilitate the identification of more specific areas for improvement, completing additional assignments/readings with faculty members responsible for teaching these content areas, or disciplinary action if it is felt that the low performance was the result of poor attitude rather than aptitude.
As colleges and schools of pharmacy attempt to utilize PCOA data as a curricular benchmark, differences in the design and timeframe of respective curricula can be a limitation, especially when comparing results for P1 or P2 students. This issue has been exacerbated by moving the administration of the 2010 PCOA from March to January, before the majority of the material included in spring semester courses has been covered. However, earlier testing allows students to receive feedback prior to summer break. At PBAU, the benchmark comparison of PCOA has been most useful for the P3 class, since the majority of the instructional curriculum has been covered. Nevertheless, student scores would be impacted negatively if PCOA included questions on material that was not covered appreciably in the curriculum until the spring semester of the P3 year. An example of such a course at PBAU is pharmacoeconomics. Although there are few topics that P3 students at PBAU have not covered prior to the PCOA administration, courses such as pharmacoeconomics will not benefit from the benchmarking utility that PCOA offers. The curriculum committee therefore will have to remain vigilant and continue to use other assessment tactics with this course. For P1 and P2 students, PBAU focuses on reviewing the PCOA subtopics that have been covered in the curriculum up to the time of testing.
One might expect P4 data to be most reflective of the curriculum, but at PBAU, the logistics of arranging P4 students to take the examination at the school is a severe limitation. Despite the recognition that the P3 data are most representative of the instructional curriculum, there is still value in testing P1 and P2 students. The subtopic results for P1 and P2 students can elucidate areas of particular strength or weakness that require closer inspection. Furthermore, early tracking of student performance allows for the measurement of progression and provides an indication of the extent to which knowledge is being retained.
Another possible limitation of the PCOA involves the difficulty in interpreting a specific problem based on the results from a subtopic. Without knowing how the PCOA questions are designed or specifically which content is tested within a subtopic, it is difficult to know how to respond to low scores on the PCOA. Once a potential weakness is identified, the curriculum committee can map the topic and assess the pedagogy used in the courses that cover the material. In addition, PBAU uses PCOA results to identify specific learning outcomes that warrant further study via in-house examinations or objective structured clinical examinations.
Finally, the cost of $75 per student to take the PCOA can be prohibitive. PBAU has budgeted to cover the cost of the examination for P1, P2, and P3 students based on the rationale that it is a justifiable expense because PCOA significantly eases faculty assessment workload. By utilizing PCOA, time consuming end-of-year examination processes, including preparation and administration, have been scaled back considerably, although some of these examinations are still administered to provide more specific curricular assessment.
In 2008, a strong correlation between GPA and scale score for the PBAU P3 class was observed. Although these results were not reproduced to the same extent in 2009 or 2010, a positive correlation of GPA to scale score remained, suggesting that students who achieve higher grades in pharmacy school also perform better on the PCOA.
According to both national and PBAU results, PCOA scale scores increase as students advance in the curriculum. This observation tends to validate that PCOA is reflective of what is covered in pharmacy curricula. National and PBAU Pearson's coefficients reflect a strong correlation between year in program and scale score.
The national percentile ranks provided by the PCOA are valuable and enable benchmarking of PBAU students with students at other colleges and schools of pharmacy. Over time, such data should enable a college or school to identify curricular areas in need of improvement based on lower student rankings in a particular content area. Given the significant curriculum revision that has taken place at PBAU over the past 3 years, PCOA benchmarking has been helpful in guiding curricular changes designed to improve student learning outcomes. PBAU student comments about PCOA indicate that they find value in discovering their national percentile rank. Students appreciate knowing how they have performed against a national cohort and being able to compare their knowledge of key topics to that of students at other colleges and schools. Based on a 2009 survey, 58% of PBAU students expressed a preference to continue participating in PCOA.
When comparing the percent correct for each PCOA subtopic between PBAU students and the national cohort, a difference of 10% or more from the national average was arbitrarily chosen as the PBAU target. As shown in Table 2, the 2010 comparative data did not identify areas needing improvement for the P3 class. However, in previous years, PCOA results identified specific areas in need of improvement, topics that were subsequently confirmed to require greater coverage via closer mapping of the curriculum. These included history of pharmacy, pharmacoeconomics, and pharmacoepidemiology. Each of these areas has since been addressed as part of the school's curricular revision.
Although the PCOA has several limitations, a collaborative effort among members of the Academy could ensure that any weaknesses of the PCOA are identified and corrected, thereby strengthening its utility. Unfortunately, those who either have taken a stance against the PCOA or otherwise have chosen not to participate are jeopardizing the future of the examination. With no alternative on the horizon, the PCOA remains the most viable option for a standardized national examination to assess pharmacy student performance. It is our hope that more members of the academy will support the development of a standardized curricular assessment tool and that more colleges and schools will at least explore the potential utility of PCOA.
SUMMARY
The PCOA has become an integral part of student and curricular assessment at PBAU. Despite its limitations, overall PCOA can be of value to both students and faculty members. It appears to be a psychometrically valid assessment tool that can be used to effectively evaluate student knowledge in curricular areas identified as universally applicable to pharmacy practice by a variety of pharmacy stakeholders. Currently, there is no alternative to PCOA for meeting Standard 15 of the ACPE 2006 revision of Accreditation Standards and Guidelines for the Professional Program Leading to the Doctor of Pharmacy Degree. PCOA provides a standardized national examination that can be used as a benchmark for comparing the performance of students at various colleges and schools, or for comparing students within a program as they progress through the curriculum. In this regard, PCOA has the potential to generate meaningful information that cannot be obtained through other means. Participation and collaboration of additional members of the Academy could facilitate the improvement of this assessment tool and strengthen its utility.
REFERENCES
- 1.Plaza CM. Progress examinations in pharmacy education. Am J Pharm Educ. 2007;71(4) doi: 10.5688/aj710466. Article 66. [DOI] [PMC free article] [PubMed] [Google Scholar]
- 2. Accreditation standards and guidelines for the professional program in pharmacy leading to the doctor of pharmacy degree; adopted January 15, 2006. Accreditation Council for Pharmacy Education. http://www.acpe-accredit.org/pdf/ACPE_Revised_PharmD_Standards_Adopted_Jan152006.pdf, 30–32. Accessed November 18, 2010.
- 3.Szilagyi JE. Curricular progress assessments: the MileMarker. Am J Pharm Educ. 2008;72(5) doi: 10.5688/aj7205101. Article 101. [DOI] [PMC free article] [PubMed] [Google Scholar]
- 4.Mehvar R, Supernaw RB. Outcome assessment in a PharmD program: the Texas Tech experience. Am J Pharm Educ. 2002;66(3):219–223. [Google Scholar]
- 5.Supernaw RB, Mehvar R. Methodology for the assessment of competence and the definition of deficiencies of students in all levels of the curriculum. Am J Pharm Educ. 2002;66(1):1–4. [Google Scholar]
- 6.Kirschenbaum HL, Brown ME, Kalis MM. Programmatic curricular outcomes assessment at colleges and schools of pharmacy in the United States and Puerto Rico. Am J Pharm Educ. 2006;70(1) doi: 10.5688/aj700108. Article 70. [DOI] [PMC free article] [PubMed] [Google Scholar]
- 7. PCOA Frequently Asked Questions. National Association of Boards of Pharmacy, Park Ridge, IL; 2009.
- 8. 2008 PCOA Administration - Program Highlights. National Association of Boards of Pharmacy, Park Ridge, IL; 2008.
- 9. 2009 PCOA Administration Highlights. National Association of Boards of Pharmacy, Park Ridge, IL; 2009.
- 10. 2010 PCOA Administration Highlights. National Association of Boards of Pharmacy, Park Ridge, IL; 2009.
- 11.Sansgiry SS, Chanda S, Lemke T, Szilagyi JE. Effect of incentives on student performance on Milemarker examinations. Am J Pharm Educ. 2006;70(5) doi: 10.5688/aj7005103. Article 103. [DOI] [PMC free article] [PubMed] [Google Scholar]


