

Summary
Knowledge of the composition of a normal healthy gut microbiota during infancy is important for understanding the role of gut microbiota in disease. A limitation of previous studies is that they are based on infants who have been subject to factors which can have a profound disruptive effect on the natural colonization process.
We describe the colonization process, during the first four months after birth, in 85 infants who have experienced no major medical or dietary interventions. They were all vaginally delivered, healthy, term infants, who were not exposed to antibiotics, exclusively breastfed during their first month of life and at least partially breastfed up to four months. Selected microbial groups were identified by targeting small subunit microbial ribosomal RNA genes.
In contrast to more recent studies, but in agreement with older studies, almost all our infants harbored γ-proteobacteria and Bifidobacterium..Yet undefined non-cultivable species belonging to Bacteroides, as well as microbes identified as Lachnospiraceae 2, were common. Strong associations were observed between some specific constituents of microbiota at day 4 and the concentration of specific microbial groups at day 120, indicating that early gut microbiota may influence later microbiota. Novel information of the undisturbed composition of early gut microbiota in babies is presented.
Keywords: Gut microbiota, infants, colonization, bifidobacterium, enterobacterium, microarray
Introduction
Gut microbiota has received an increasing amount of attention over the last decades as we have come to understand its crucial role in host biology and human health (1-6). Gut microbiota in early infancy is of special interest due to the presence of developmental windows that relies on microbial stimulus from the gut, involving development of tolerance (7, 8), angiogenesis (9) and stress responses (10). Furthermore, early gut microbiota is of interest as a determinant of the final stable adult like microbiota (11-14).
However, we have limited knowledge of early gut microbiota (15-17). A major limitation of previous studies is that they are based on infants who have been subject to factors which can have a profound disruptive effect on the natural colonization process. This has been clearly demonstrated for cesarean delivery (18-22), use of antibiotics in the perinatal period (23, 24) and neonatal intensive care (25, 26). Since caesarean deliveries have increased up to tenfold since the early 19nth century, and up to one-third of babies are now delivered by a sterile mode of birth (27) this complicates the comparison of older and more recent studies in unselected populations. More importantly, some of these gut modifying factors, specifically cesarean delivery and early exposure to antibiotics, may be associated with a dysfunctional gut microbiota and a possible increased risk of immune related diseases in childhood (28-34). This underscores the importance of studying infants who have not been subjected to medical interventions when aiming at describing a healthy natural gut microbiota.
The aim of this paper is to characterize the composition of early gut microbiota in 85 infants who have experienced no major medical or dietary interventions. We use 22 selected genetic probes that were developed for this study, encompassing both known and unknown gut microbes, to describe the composition of gut microbiota four days after delivery and up to four months of age. We also identify microbial clusters and show how neonatal gut microbiota is associated with microbiota at 4 months of age.
Materials and Methods
Cohort design
We analyzed gut microbiota from a subset of infants enrolled in The Norwegian Microflora Study (“NoMic”), a birth-cohort which was established for the overall purpose of studying the establishment of gut microbiota during infancy and its consequences for child health. Participating mothers were recruited to the NoMic study by a pediatrician at the maternity ward in a county hospital in South-Norway. When a preterm-birth mother was enrolled, two mothers of consecutively born term-infants were recruited. The recruitment started in November 2002 and was completed in May 2005. Mothers who were fluent in Norwegian and who were resident in the geographical area were eligible for the cohort. The study was approved by the Norwegian Data Inspectorate and the Regional Ethics Committee for Medical Research.
Containers for fecal samples and a questionnaire were handed out to the participants at the maternity ward after the informed consent form had been signed. Mothers were asked to collect and freeze one fecal samples from herself at postpartum day four, as well as samples from her infant when it was 4, 10, 30 and 120 days old. Date and time of collection were recorded for each sample, as well as the time until the samples were placed in the freezer. Study personnel retrieved samples and kept them frozen during transport. Samples were stored at −20 °C at the Biobank of the Norwegian Institute of Public Health upon arrival. Further questionnaires were sent to the families when their infants were 6, 12, 18 and 24 months. Further follow up is planned at 7 and 12 years.
Study sample
Six hundred and one mothers agreed to participate in the NoMic study, but 86 (14%) of these mothers never returned any fecal samples, leaving 524 infants from whom we had available fecal samples, at one or more occasions. In the present paper we describe the infant microbiota from birth to four months of age among infants without major dietary or medical interventions. Thus, we restricted the analysis in the current paper to the subset of infants who had been vaginally delivered, had not been transferred to an intensive care unit, were exclusively breastfed for one month and still breastfed (partially or exclusively) at 4 months of age, had not received any antibiotics, and their mothers had not received antibiotics at any time during the last three months before delivery, nor the first four months after delivery. We also included only infants born at term with a birth weight above 2500g. In total 87 infants fulfilled these criteria. Two of these were excluded because they were missing more than one of the four fecal samples that we analyzed (4, 10, 30 and 120 days). The remaining 85 maternal infant pairs constitute the study sample.
Data collection of infant and maternal characteristics
For the present paper we used data from the questionnaires filled in by the mothers after delivery (median age 9.5 weeks, mean 11.0), to obtain information on birth weight, cesarean delivery, maternal age, education, body mass index at beginning of pregnancy, parity, maternal smoking after delivery, ethnicity and whether the infant had been transferred to an intensive care unit. We also used this questionnaire, as well as the questionnaire filled out when the infant was six month, to obtain data on breastfeeding, the age at when milk substitutes were first given and maternal and infant use of antibiotics. We obtained information on gestational age and preterm delivery from the Medical Birth Registry of Norway (MBR) (35). We validated maternal reports by comparing these with information in the Norwegian Medical Birth Registry on cesarean delivery, perinatal infections and systemic antibiotic use. None of the infants in our study sample had been subjected to cesarean delivery or perinatal infections according to this registry.
Analysis of faecal samples
To develop the probes for determining the microbial constituents of our infants, ten children were randomly selected among those who had been delivered by cesarean section and ten children among those who had had a normal delivery. 16S rRNA gene clone libraries were constructed from DNA extracted from the fecal samples obtained on day 4, 10, 30 and 120. The sequences were transformed into multimer frequencies (n _ 5) by the in-house-developed computer program PhyloMode (www.matforsk.no/web/sampro.nsf/downloadE/Microbial_community). The transformation was based on sliding a window of 5 nucleotides along a DNA sequence and counting the frequencies of the different multimers encountered. The sizes of the multimer windows were chosen as tradeoffs between detecting phylogenetic signals (homologous multimer equalities), avoiding base composition biases due to nonhomologous multimer equalities, and the requirements for computer operation time (36). The multimer frequency data were compressed using principal component analysis (PCA) as previously described for the alignment-independent bilinear multivariate modeling (AIBIMM) approach (36). The phylogenetic content in the PCA was evaluated by cross-validation, while the potential presence of chimerical sequences was determined empirically by conflicting multimer loadings. AIBIMM is related to the Tetra approach previously published by Teeling et al. (37). The main difference, however, is that Tetra is designed for the detection of skewed tetranucleotide distribution in whole genomes, while AIBIMM is designed to detect phylogenetic signals in single genes (36). A detailed description for the phylogenetic interpretation of the AIBIMM data has been given elsewhere (38).
The probes were constructed using a beta version of the probe construction software TNTProbeTool, a software under development for efficient design of Single Nucleotide Extension (SNE) probes for analysis of microbial communities. The basic process is to identify probes which are unique to a target phylogroup, and hybridize neither to other labeling probes (cross-labeling) nor to other complementary probes immobilized on the array (cross-binding). The selected labeling probes should not form secondary structures, which may result in self-labeling.
The format of input file for TNTProbeTool is “.pcam”. This format stands for PCA model of gene phylogeny and is obtained using a 16S rRNA gene sequence file (in “.fasta” or “.txt” format) and PhyloMode program. The sequence file should ideally contain a comprehensive library of all 16S rRNA gene sequences likely to be found in samples in question. The user can then find selective probes by defining manually the probes' target and non-target bacteria. This process is defined into several steps, where each step consists of a report on results from the last step and a choice of parameters for the next. The probes that pass through all filters and tests are then presented visually (where they are supposed to hybridize to target sequences) and/or stored in a “.fasta”/”.txt” file.
The probes were constructed based on a limited 389 clone dataset and subsequently evaluated on a 3845 clone dataset (16, 39), using Basic Local Alignment Search Tool (BLAST)(40, 41) on a local database containing the dataset. The homologues identified by Blast were manually examined using the same criteria as in TNTProbeTool for determining potential target sequences. All constructed probes were also evaluated experimentally by cloned target sequences, and closest non-target sequences. Finally, the compatible probes that satisfied the criteria for target detection, and exclusion of non-target were included in the array.
Automated DNA purification
Feces were prepared for analysis by adding one milliliter Solution 1 (50 mM glucose, 25 mM Tris–HCl pH 8.0, 10 mM EDTA pH 8.0) per 0.2 g faeces. The samples were mixed by vortexing and left for 30-60 min on ice before 400 μl of the supernatant was diluted 1:2 in 4 M guanidinium thiocyanate (GTC). Five hundred microliters of sample were transferred to a sterile FastPrep®-tube (Qbiogene Inc., Carlsbad, CA, USA) containing 250 mg glass beads (106 microns and finer, Sigma-Aldrich, Steinheim, Germany), and samples were homogenised for 40 seconds in FastPrep® Instrument (Qbiogene). Wells in a 96-well Greiner U-plate (Greiner bio-one, Frickenhausen, Germany) were filled with 170 μl sample and 10 μl Silica particles (Merck, Darmstadt, Germany) and transferred to a Biomek® 2000 Workstation (Beckman Coulter, Fullerton, CA, USA). One percent Sarkosyl was added, and the plate was incubated at 65 °C for 10 min and at room temperature for 10 min. The supernatant was removed, and the paramagnetic beads were washed twice with 50% ethanol. DNA was eluted from the silica particles by suspension of the particles in 100 μl Buffer C (1 mM EDTA pH 8.0, 10 mM Tris–HCl pH 8.0) at 65 °C for 30 min.
PCR
The PCR was performed using 16S universal primers (42). This is a relatively short ¨460 bp amplicon, which is a trade-off between PCR robustness and level of phylogenetic information. The PCR mixture contained 0.2 μM of each primer, 1Unit DyNAzyme™ II Hot start DNA polymerase (Finnzymes), 1×Hot Start Buffer, 200 μM Deoxyribonucleotide triphosphate (dNTP) mix, and 2 μl DNA in a 25 μl PCR reaction. The amplification profile was developed with an initial step at 95°C for 10 min, then 30 cycles of 95°C for 30 s, 60°C for 30 s, and 72°C for 45 s, and a final extension at 72°C for 7 min. 3U Shrimp Alkaline Phosphatase was added to 10 μl PCR product to remove the phosphate groups from the excess dNTP's left over from the PCR. The reaction was incubated at 37°C for one hour and then inactivated by incubation at 80°C for 15 min.
Labeling
Cyclic labelling reaction was performed using a probe mixture of all 27 probes and the 16S universal probe. The reaction mixture consisted of 0.1 μM of each of the 27 probes and 0.3 μM of the 16S universal probe, 1×Thermo Sequenase™ Buffer, 1 μM TAMRA-labelled ddCTP, 3.2U Termo Sequenase™ DNA polymerase (GE Healthcare), and 2 μl of SAP treated PCR product in a 10 μl reaction volume. The cyclic labelling profile was 10 cycles of 96°C for 10 s, 50°C for 5 s, and 60°C for 30 s. The labelled product was then SAP treated as described above using 2U SAP in a 10 μl reaction volume. One μl of the SAP treated labelling product was run on a 2.5% agarose gel to check the labelling.
Microarrays, prehybridization and hybridization
The arrays were printed by TeleChem International, Inc. (ArrayIt) on superepoxy slides.The arrays were prehybridized in BlockIt (ArrayIt) for 2 hours at room temperature. The prehybridized arrays were then washed in room temperature 2×SSC/0.03% sarkosyl for 2 min, 2×SSC for 2 min, boiling H2O for 2 min, and ice cold 100% EtOH for < 2 min. The arrays were dried by centrifugation at 90 times gravity for 12 min and used within one hour. The SAP treated labeling product was mixed with 60 μl hybridization buffer (7.2% PEG 8000/1.2xSSC) and 0.1μl of fluorescent spike-mix (1:4 TAMRA-labeled fluorescent spike to unlabelled spike). This fluorescent spike was later used in the normalization of signals. The samples were heated to 95°C for 2 minutes and then cooled to 45° C before being applied to the array. The arrays were hybridized over night at 45°C with gentle agitation. The arrays were then washed in 2×SSC/0.03% Sarkosyl for 5 min, 2×SSC for 5 min, and then 0.2×SSC for 10 s. The arrays were dried by centrifugation 90×g for 12 min and scanned the same day. The arrays were scanned with the Tecan LS Reloaded basic scanner following the manufacturer's guidelines. The scanning intensity was set so that none of the spots reached saturation. The fluorescent spot intensities were quantified using Imagene™ 5.6.1 (BioDiscovery Inc.) software. The data were pre-processed in DataGetter (Text S1) and normalized in Excel as described by the following formula: ([(probe X sample Y / average fluorescent spike sample Y) - (probe X NTC / average fluorescent spike NTC)] / average 16S Universal sample Y) * 1×10⁻⁶ ). The universal 16S rDNA probe was used for normalization since this probe region is universally distributed among bacteria. The samples were analyzed in two different batches (that is two separate oligo synthesis for array printing).
Data analysis
Labeled DNA extracted from the fecal samples were spotted on the arrays in triplicates. Because there is no absolute cutoff that can be empirically demonstrated to identify absence of a microbial group, we required that a microbial group be detected in at least two of the three replicates. The lowest value detected when at least two replicates yielded detectable values was thus treated as the detection limit for that probe for that person. We chose this approach rather than some arbitrary detection level because when we examined samples for which all of the replicates showed detectable levels, we found that all probes included samples with very low concentrations (Table 1). This also has the advantage of taking into account the obvious differential performance of different probes (Table 2).
Table 1.
Lowest expression values detected within each probe (across all sets of triplicates with detectable values and all time points) in the whole NoMic dataset (n=524).
| Probe |
Lowest value measured |
|---|---|
| Bifidobacterium longum | 0,006 |
| Bifidobacterium 1 | 0,001 |
| Bifidobacterium bifidum | 0,000 |
| Bifidobacterium 2 | 0,000 |
| Varibaculum | 0,002 |
| Pseudomonas | 0,001 |
| Enterobacteriaceae 1 | 0,004 |
| Enterobacteriaceae 2 | 0,002 |
| gamma Proteobacteria | 0,006 |
| Lachnospiraceae 1 | 0,000 |
| Lachnospiraceae 2 | 0,002 |
| Lachnospiraceae Inc_2 | 0,002 |
| Lachnospiraceae_Inc_3 | 0,000 |
| Veillonella 1c | 0,012 |
| Clostridium perfringens | 0,001 |
| Streptococcus | 0,082 |
| Staphylococcus sp. | 0,000 |
| Lactobacillus 1 | 0,000 |
| Lactobacillus 2a | 0,003 |
| Enterococcus | 0,018 |
| Bacteroides fragilis | 0,001 |
| Uncultured human fecal bacterium | 0,002 |
Table 2.
shows the distribution of the four possible sets of triplicates (e.g. 0,0,0 and 0,0,>0 and 0,>0,>0 and >0,>0,>0) for each gene probe at each time point. This reveals that some probes have a larger proportion of heterogeneous triplicates than others (45% for Enterococcus, 12% for the best performing probes), suggesting that they are not performing as well as others. However, when evaluating this we also needed to consider whether the probe identified microbes that were present in low concentration because this also influences the proportion of heterogeneous triplicates. The influence of low concentration can be observed clearly for probes identifying microbes that increased in concentration over time. When the concentration increased, the number of heterogeneous triplicates decreased, and vica versa (Veillonella and Staphylococcus sp.are good examples). Rather than choosing an arbitary threshold value, we decided that if two out of the three triplicate values were zero, we would assign a value of 0 for that individual at that time point for that probe. This has the advantage of taking into account the obvious differential performance of different probes. The presence and absence data were then used to assign concentrations of “0” to absent probes. The value “0” was chosen because all probes had some very low values within the useable data as shown in the new table (Table 1). For probes that met our criteria for present, we then added “1” to each of the three replicate values and took the mean of the three log-transformed to use for analysis. The resulting transformed data exhibited approximately symmetric distribution, consequently means of the transformed triplicate values were used in analyses of concentration. The description has been expanded in methods
| % of triplicates |
|||||
|---|---|---|---|---|---|
| 0,0,0a |
0,0,1b |
0, 1, 1c |
1,1,1d |
||
| Bifidobacterium longum | |||||
| Day 4 | 14,7 | 7,7 | 9,6 | 67,9 | |
| Day 10 | 12,7 | 5,8 | 9,4 | 72,1 | |
| Day 30 | 12,8 | 3,6 | 10,5 | 73,1 | |
| Day 120 | 6,3 | 3,4 | 7,9 | 82,5 | |
| Bifidobacterium 1 | |||||
| Day 4 | 42,5 | 9,6 | 5,3 | 42,5 | |
| Day 10 | 39,1 | 8,6 | 6,7 | 45,7 | |
| Day 30 | 32,5 | 11,1 | 6,2 | 50,2 | |
| Day 120 | 27,6 | 4,5 | 6,1 | 61,8 | |
| Bifidobacterium bifidum |
|||||
| Day 4 | 20,1 | 11,3 | 13,5 | 55,1 | |
| Day 10 | 16,1 | 11,2 | 12,0 | 60,7 | |
| Day 30 | 11,3 | 10,0 | 13,5 | 65,2 | |
| Day 120 | 8,5 | 5,4 | 10,1 | 76,0 | |
| Bifidobacterium 2 | |||||
| Day 4 | 28,2 | 6,8 | 8,3 | 56,6 | |
| Day 10 | 24,7 | 7,9 | 8,2 | 59,2 | |
| Day 30 | 20,3 | 7,9 | 7,7 | 64,1 | |
| Day 120 | 16,6 | 7,2 | 7,2 | 69,0 | |
| Varibaculum | |||||
| Day 4 | 34,8 | 37,4 | 22,6 | 5,1 | |
| Day 10 | 35,0 | 38,0 | 22,5 | 4,5 | |
| Day 30 | 35,3 | 37,6 | 20,5 | 6,6 | |
| Day 120 | 28,8 | 31,2 | 24,3 | 15,7 | |
| Pseudomonas | |||||
| Day 4 | 15 | 12,4 | 19,4 | 53,2 | |
| Day 10 | 13,5 | 13,5 | 20 | 53 | |
| Day 30 | 18,6 | 12,6 | 22,4 | 46,4 | |
| Day 120 | 18,4 | 14,8 | 18,4 | 48,3 | |
| Enterobacteriaceae 1 | |||||
| Day 4 | 34,4 | 12,8 | 7,5 | 45,3 | |
| Day 10 | 35,4 | 9,9 | 7,9 | 46,8 | |
| Day 30 | 28,2 | 12 | 7,1 | 52,8 | |
| Day 120 | 15,7 | 8,1 | 8,3 | 67,9 | |
| Enterobacteriaceae 2 | |||||
| Day 4 | 13,9 | 6,8 | 7,5 | 71,8 | |
| Day 10 | 8,8 | 6 | 7,1 | 78,1 | |
| Day 30 | 9,4 | 4,9 | 6,4 | 79,3 | |
| Day 120 | 6,1 | 3,1 | 5,6 | 85,2 | |
| gamma Proteobacteria | |||||
| Day 4 | 5,8 | 6 | 10,3 | 78 | |
| Day 10 | 2,1 | 4,3 | 11,4 | 82,2 | |
| Day 30 | 2,4 | 3,2 | 8,8 | 85,7 | |
| Day 120 | 1,6 | 1,3 | 9,2 | 87,9 | |
| Lachnospiraceae 1 | |||||
| Day 4 | 49,6 | 23,6 | 9,7 | 17,2 | |
| Day 10 | 46,4 | 21,6 | 11,5 | 20,5 | |
| Day 30 | 32,1 | 13,5 | 9,7 | 44,7 | |
| Day 120 | |||||
| Lachnospiraceae 2 | |||||
| Day 4 | 38,2 | 9,8 | 9,8 | 42,1 | |
| Day 10 | 30,7 | 10,9 | 9 | 49,4 | |
| Day 30 | 25,9 | 8,3 | 8,3 | 57,5 | |
| Day 120 | 14,8 | 5,2 | 7,4 | 72,6 | |
| Lachnospiraceae Inc_2 | |||||
| Day 4 | 41,9 | 9,4 | 11,5 | 37,2 | |
| Day 10 | 38 | 8,8 | 10,5 | 42,7 | |
| Day 30 | 34,8 | 6,2 | 12,6 | 46,4 | |
| Day 120 | 21,8 | 5,6 | 9,7 | 62,9 | |
| Lachnospiraceae_Inc_3 | |||||
| Day 4 | 15 | 24,1 | 29,9 | 31 | |
| Day 10 | 11,8 | 27,5 | 33,5 | 27,3 | |
| Day 30 | 11,3 | 26,7 | 28,8 | 33,1 | |
| Day 120 | 11,7 | 22,7 | 29,2 | 36,4 | |
| Veillonella | |||||
| Day 4 | 59,2 | 10,3 | 4,3 | 26,3 | |
| Day 10 | 41,2 | 9,7 | 6,4 | 42,7 | |
| Day 30 | 23,5 | 7,7 | 7,9 | 60,9 | |
| Day 120 | 21,6 | 7 | 7,4 | 64 | |
| Clostridium perfringens | |||||
| Day 4 | 45,3 | 12,4 | 12,6 | 29,7 | |
| Day 10 | 41,6 | 11,4 | 10,1 | 36,9 | |
| Day 30 | 37,4 | 9,8 | 8,5 | 44,2 | |
| Day 120 | 25,6 | 8,8 | 4,9 | 60,7 | |
| Streptococcus | |||||
| Day 4 | 45,5 | 10,5 | 9,8 | 34,2 | |
| Day 10 | 43,8 | 12,9 | 11,6 | 31,8 | |
| Day 30 | 42,7 | 11,8 | 13,5 | 32,1 | |
| Day 120 | 55,3 | 14,2 | 13,3 | 17,3 | |
| Staphylococcus sp. | |||||
| Day 4 | 3,6 | 3,2 | 13,7 | 79,5 | |
| Day 10 | 1,9 | 3,6 | 13,9 | 80,5 | |
| Day 30 | 9 | 6,4 | 15,2 | 69,4 | |
| Day 120 | 26,5 | 10,8 | 15,3 | 47,4 | |
| Lactobacillus 1 | |||||
| Day 4 | 54,9 | 12,8 | 9,8 | 22,4 | |
| Day 10 | 50,4 | 12,9 | 9,4 | 27,3 | |
| Day 30 | 41,2 | 9,6 | 11,1 | 38,0 | |
| Day 120 | 48,8 | 13,0 | 10,3 | 27,9 | |
| Lactobacillus 2a | |||||
| Day 4 | 35,3 | 16 | 17,5 | 31,2 | |
| Day 10 | 33,5 | 16,1 | 20 | 30,5 | |
| Day 30 | 28,2 | 15 | 17,1 | 39,7 | |
| Day 120 | 17,5 | 12,1 | 12,4 | 58 | |
| Enterococcus | |||||
| Day 4 | 22,4 | 19,2 | 25,2 | 33,1 | |
| Day 10 | 19,7 | 24,7 | 25,1 | 30,5 | |
| Day 30 | 20,7 | 22,6 | 26,3 | 30,3 | |
| Day 120 | 11 | 23,4 | 27,6 | 38 | |
| Bacteroides fragilis | |||||
| Day 4 | 66,5 | 11,1 | 5,6 | 16,9 | |
| Day 10 | 62 | 14,2 | 5,8 | 18 | |
| Day 30 | 64,1 | 12,6 | 6,2 | 17,1 | |
| Day 120 | 65,6 | 14,2 | 4,3 | 16 | |
| Uncultured human fecal bacterium |
|||||
| Day 4 | 20,9 | 29,1 | 14,7 | 35,3 | |
| Day 10 | 23,6 | 34,1 | 13,9 | 28,3 | |
| Day 30 | 21,8 | 30,8 | 20,1 | 27,4 | |
| Day 120 | 22,9 | 29,9 | 15,7 | 31,5 | |
|
|
|||||
All triplicates 0 value
two triplicates 0 value, one triplicate with value above 0.
One triplicates 0 value, one triplicate with value above 0
all triplicates values above 0. N at day 4, 10, 30 and 120, 468, 466, 468 and 445, respectively, for all probes.
For the analysis of concentration, samples for which a probe was non-detectable were treated as “0” concentration. Since the concentration data on each replicate exhibited a long tail distribution, we log transformed the data after adding ‘1’ to all observations to avoid computing log of zero. The resulting transformed data exhibited approximately symmetric distribution, consequently means of the transformed triplicate values were used in analyses of concentration.
We calculated the prevalence of each probe; the proportion of infants with detectable levels (non-zero concentration (present) or zero concentration (absent) at each time point, and made a graph showing the changes in these data over time. We also made a graph on the mean change in concentration (expression level) for each probe over time relative to the concentration at day 4. Tests for significant changes in these pattern analyses (both bivariate comparing day 4 and day 120, as well as trend tests) were conducted using a software called ORIOGEN 3.0 (Order Restricted Inference for Ordered Gene ExpressioN)(43, 44) which is designed to detect significant increases and decreases in expression values over time.
We performed hierarchical clustering to detect clusters among microbial groups. Results are depicted using heat-maps produced by the Partek Genomics Suite software (6.08.0325). We also examined the degree to which the concentrations of 22 microbial groups on day 120 associated with presence or absence of the 22 microbes on day 4 using standard stepwise linear regression analysis.
RESULTS
The characteristics of the 85 mother-infant pairs are listed in Table 3. Median maternal age was thirty years and 10.6% were smokers. Infants were all still breastfed at 4 months (eligibility criteria), but 38.8% had been given supplemental milk formula starting between one and four months of age. Most were of Norwegian ethnicity. One mother participated with two infants.
Table 3.
Characteristics of the 85 infants in the NoMic cohort who fulfilled eligible criteria; vaginally delivered, not been exposed to antibiotics (directly or indirectly through the mother), were exclusively breastfed for one month and still breastfed (partially or exclusively) at 4 months of age.
| % |
||
|---|---|---|
| Maternal age (years) | ||
| <=27 år | 17.6 | |
| 28-31 | 41.2 | |
| >32 | 41.2 | |
| Childs birth weight (g) | ||
| 2500- 3499 | 43.5 | |
| 3500 to 3999 | 31.8 | |
| >4000 | 24.7 | |
| Gestational age (days) |
||
| 260-279 | 21.2 | |
| 280-294 | 67.1 | |
| >294 | 11.8 | |
| Maternal BMI (kg/m2) a | ||
| 10-18.49 | 2.5 | |
| 18.5-24.9 | 70.0 | |
| 25-29.9 | 25.0 | |
| >30 | 2.5 | |
| Maternal parity (%) | ||
| First child | 33.7 | |
| Second child | 49.4 | |
| Third child or more |
16.9 | |
| Maternal smoking (%)b | ||
| No | 89.5 | |
| Occasional or |
10.6 | |
| Child sex (%) | ||
| Female | 50.6 | |
| Male | 49.4 | |
| Maternal education (%) | ||
| <12 years | 3.6 | |
| 12 years | 24.1 | |
| 13 to 16 years | 41.0 | |
| More than 16 years |
31.3 | |
| Nationality (%) | ||
| Norwegian ethnicity | 91.8 | |
| Not Norwegian | 8.2 | |
| Exclusive breastfeeding at 4 months | ||
| No | 38.8 | |
| Yes | 61.2 | |
Pre-pregnancy body mass index.
Information on smoking collected after delivery.
Missing information for education; n=2, BMI; n=3, smoking; n=1. One mother participated with two infants. No twins.
Probe specificity
We evaluated our set of 27 probes (Table 4). The experimental evaluation of these probes on target and non-target clones showed that the probes gave the expected signals. By bioinformatic evaluation using the clone libraries published by Palmer (16) based on 3845 clone sequences, we found that the probes in our array covered 48.2% of the clones identified by Palmer. Our universal probe covered 96.5% of all the clones. The probes used for our analysis are shown in a phylogenetic tree in Figure 1 and the composition of the probes in Table 4.
Table 4.
Probe number, name, labeling sequence and target bacteria according to search in the Ribosomal database project (RDP) database is shown. The table also shows the number of hits in the Palmer clone library (3845 clone sequences).
| Probe nr | Probe name (bacteria) | Target bacteriaa | Hits in the Palmer clone library (3845 clone sequences) |
Labelling probes |
|---|---|---|---|---|
| 1 | Enterococcus | Enterococcus sp. (e.g. E. faecium) | 44 | TCATCCCTTGACGGTATCTAA |
| 2.1 | Lactobacillus 1 |
Lactobacillus sp. (L. gassery, L. helveticus, L. acidophilus, L. johnsonii etc.) |
50 | GTCAAATAAAGGCCAGTTACTA |
| 3.2 | Lactobacillus 2a |
Lactobacillus sp. (L. casei, L. rhamnosous, L. rennaquilify, L. paracasei) |
1 | CAGTTACTCTGCCGACCATT |
| 3.4 | Lactobacillus 2b |
Lactobacillus sp. (L. casei, L. rhamnosous, L. rennaquilify, L. paracasei) |
0 | AGTAACTGTTGTCGGCGTGA |
| 4.1 | Staphylococcus sp. | Staphylococcus sp. | 11 | ACACATATGTTCTTCCCTAATAA |
| 5 | Streptococcus | Streptococcus sp. | 149 | AGTGTGAGAGTGGAAAGTTCA |
| 6 | Clostridium perfringens | Clostridium sp. (C. perfringens) | 95 | TCAACTTGGGTGCTGCATTC |
| 7.1 | Veillonella 1a | Veillonella sp. | 11 | GTCAATCCTTCTCACTATTCG |
| 7.3 | Veillonella 1b | Veillonella sp. | 1 | CGAACTTTTAAGACAGACTGAC |
| 7.5 | Veillonella 1c | Veillonella sp. | 49 | GATTGGCAGTTTCCATCCCAT |
| 8 | Lachnospiraceae 1 |
Lachnospireaceae sp. (Dorea, L. Incertea sedis) |
2 | AGCTAGAGTGTCGGAGAGG |
| 9.1 | Lachnospiraceae incertae sedis 1 | Lachnospireaceae sp. (L. Incertea sedis) | 2 | GGCGGGGGCTCAACCCC |
| 10 | Lachnospiraceae incertae sedis 2 | Lachnospireaceae sp. (L. Incertea sedis) | 7 | TATCAGCAGGAAGATAGTGA |
| 11 | Lachnospiraceae 2 |
Lachnospireaceae sp. (Dorea, L. Incertea sedis) |
1 | AGTCAGGTACCGTCATTTTCT |
| 12.3 | Lachnospiraceae incertae sedis 3 | Lachnospireaceae sp. (L. Incertea sedis) | 1 | ACTGCTTTGGAAACTGCAGAT |
| 15.1 | Pseudomonas 1a | Pseudomonas sp. | 0 | GTCAAAACAGCAAAGTATTAATTTA |
| 15.2 | Pseudomonas 1b | Pseudomonas sp. | 0 | GTAGAGGGTGGTGGAATTTC |
| 16.1 | Enterobacteriaceae 1 | Enterobacteriaceae (Esherichia coli, Shigella) | 221 | GAGCAAAGGTATTAACTTTACTC |
| 17 | Enterobacteriaceae 2 |
Enterobacteriaceae (Enterobacter sp.(Pantoea sp), Klebsilla, Erwina, Citrobacter, Bulliauxella) |
696 | CGAAACTGGCAGGCTAGAGT |
| 18 | Gamma (γ)-Proteobacteria | (γ)-Proteobacteria (Alteromonadales, Vibronales, Aeromonadales, Enterobacteriales) |
1399 | CCTGGACAAAGACTGACGCT |
| 19.1 | Varibaculum | Varibaculum sp. (V cambriense) | 3 | TTGAGTGTAGGGGTTGATTAG |
| 22 | Bifidobacterium longum | Bifidobacterium (B. longum) | 114 | GAGCAAGCGTGAGTAAGTTTA |
| 23 | Bifidobacterium bifidum | Bifidobacterium (B. bifidum) | 12 | CCGAAGGCTTGCTCCCAAA |
| 24.3 | Bifidobacterium 1 | Bifidobacterium (B. breve,) | 38 | CACTCAACACAAAGTGCCTTG |
| 25 | Bifidobacterium 2 |
Bifidobacterium (B. thermophilum, B. adolescentis) |
7 | GCTTATTCGAAAGGTACACTCACCCCGAAGGG |
| 26 | Bacteroides fragilis | Bacteriodes sp. (B. fragilis) | 1 | GGGCGCTAGCCTAACCAG |
| 27.2 | Uncultured human fecal bacterium | Bacteroides sp. | 179 | ATGCATACCCGTTTGCATGTA |
| 16S universal |
16S rDNA | Bacteria | 3710 (96.5%) | CGTATTACCGCGGCTGCTGGCA |
Probe Matchsearch (using the labelling probe+ C) in the RDP database (http://rdp.cme.msu.edu/probematch/search.jsp)
One error allowed in search sequence
Figure 1.

Cartoon tree representing the phylogenetic grouping of the probes used in the analyses of the data.
The numbers before the punctuation for the labeling of branches represent the number of that phylogroup on the array. If there is a number after the punctuation, more than one probe was evaluated for that particular phylogroup. If the naming of the terminal nodes is not distinct we included numbering for distinction.
Prevalence of microbial groups at day 4 and day 120
The Staphylococcus and γ-proteobacteria probes gave signals, above the detection limit and using our threshold definitions, in nearly all infants at day 4 (Figure 2). Only 5% of all infants had no detectable microbes belonging to the phyla γ-proteobacteria at day 4 (Covered by the probes: γ-proteobacteria, Enterobacteriacea 1 and 2, and Pseudomonas in Figure 2), decreasing to 1% at day 120. Only 17% of all infants had no detectable signal to either of the Enterobacteriacea probes 1 & 2 at day 4, decreasing to 7% at day 120. Almost as prevalent were the Bifidobacterium species: B.longum, Bifidobacterium 2 (including B. thermophilum and B. adolescentis), B.bifidum and Enterobacteriaceae 2, while Bifidobacterium 1 (mainly B. breve) was less common and detected in less than 50% of the infants at day 4 (Figure 2). Only 4 infants (4.8%) had no detectable bacteria belonging to Bifidobacterium species at day 4. Twenty five percents of all infants had no detectable Lactobacillus (1 or 2a) at day 4, decreasing to 16% at day 120. Veillonella and Lachnospiraceae 1 were the least common groups at day 4 but not at day 120.
Figure 2.

Prevalence of microbial groups at day 4 and day 120.
The percentage of infants in which each microbial group was detected (above threshold) at day 4 (n=83) and at day 120 (n=83) is plotted. Bacterial groups are ordered by mean prevalence at day 4. The p-values are calculated based on 81 infants with data for both days. **** P-value <0.0001, *** p-value <0.001, ** p-value<0.01 and * p-value<0.05.
The prevalence of microbial groups changed significantly with the age of the infant (Figure 2 and 4). An increase in prevalence over time was most pronounced for the Veillonella, and Lachnospiraceae 2 probes (Figure 2). In contrast, the prevalence of Staphylococcus, Uncultured human fecal bacterium and Streptococcus declined from day 4 to day 120, the decline most pronounced for Staphylococcus.
Figure 4.

Prevalence of microbial groups, and changes in concentration. The mean prevalence rate for day 4, 10, 30 and day 120 is plotted, as well as the mean change in concentration/expression pattern for day 10, 30 and 120, all relative to day 4, based on the log scale.
We had data from 83, 84, 82 and 83 infants, at age 4, 10, 30 and 120 days, respectively and 77 infants had samples from all four ages. The p-values are calculated based on the 77 infants with full data. * p-value<0.05, ** p-value<0.01 ***, p-value <0.001****, P-value <0.0001.
Diversity in microbiota
In the newborns the median number of probes that gave a signal was 12 (of the 22), but the range was wide; 3 to 22. The number of detectable groups showed a small increase, during the four-month study (median number at four months; 15, range 7 to 21). For Bifidobacterium, the median number of probes that gave a signal was 3 out of 4 at all time points (range 0-4 at day 4 and 10, range 1-4 at day 30 and 120). Correspondingly, the median number of signals to the four probes detecting γ-proteobacteria was 3 out of 4 at day 4 to 30, increasing to 4 at day 120 (range 0 to 4 at all time points). The median number of signals to the two Lactobacillus probes was 1 out of 2, range 0-2, all time points.
Changes in concentration of each microbial group over time
We observed an increase in concentration over time, as assessed by the signal intensity of the probes, during the 4 month period, for a large number of microbial groups as can be seen in Figure 3 and 4. The largest increases, relative to day 4, were observed for the probes encompassing the microbial groups; Lachnospiracea 1, Varibaculum, Veillonella, Lachnospiracea 2, Lactobacillus 2a, and Clostridium. In contrast we observed a marked decline in concentration during the four month period for the Staphylococcus, Streptococcus, and Uncultured human fecal bacterium groups (Figure 3). In general an increase in the relative concentration was mirrored by an increase in prevalence (Figure 4). However, some exceptions are noted, for instance the relative change in signal intensity for the Lactobacillus 1 probe is unparalleled by a change in prevalence (Figure 4). For other probes the change in concentration is more marked than the change in prevalence, as for Varibaculum.
Figure 3.

The mean change in concentration/ expression pattern at day 120 relative to day 4 is shown. Concentrations are defined by log transformed expression intensities. Bacterial groups are ordered by differences in concentrations.
* p-value<0.05, ** p-value<0.01 ***, p-value <0.001****, P-value <0.0001.
Microbial clusters at day 4
Some microbial groups clustered within infants at day 4. A subpopulation of infants with higher signals to the Bifidobacterium probes (especially Bifidobacterium 1) than their counterparts was observed (Figure 5, cluster 5). These infants had almost no signal to the Streptococcus probe (Figure 5). We also observed a subset of infants with lower signal intensity to the four γ-proteobacterium probes (γ-proteobacteria, Enterobacteriacea 1 and 2, and Pseudomonas) (Figure 5, cluster 1 and 2). Higher signal intensity to the Uncultured human fecal bacterium probe was observed for some of these infants (cluster 1). The others in this subset had a relative lack of Bifidobacterium and a higher concentration of Streptococcus and Staphylococcus (cluster 2).
Figure 5.

Heatmap of the concentration of each microbial group for each infant on day 4, with hierarchical clustering among study subjects performed using Spearman correlation coefficients as the similarity index. Each column represents one study subject, and the tree shows the subjects who were clustered together. Wards method was used to form the clusters. The scale of the concentration ranges from 0 concentration (deep blue) to the highest concentration (bright red). (Concentrations should only be compared across individuals and not across probes).
Microbial clusters at day 120
We observed different clusters of microbial groups at day 120 although these were less distinct than at day 4. One cluster had a relatively high concentration of the Bifidobacterium group, and especially the Bifidobacterium 1 group (Figure 6, cluster 4). This cluster had low signals to the Enterobacteriaceae 1 and 2 probes, but signals to the broader group, γ-proteobacterium (probe 18, figure 1) in the same phyla. Infants in this subset had no or low signals to the Staphylococcus and Streptococcus probes.
Figure 6.

Heatmap of the concentration of each probe on day 120 for each infant, with hierarchical clustering among study subjects performed using Spearman correlation coefficients as the similarity index. Each column represents one study subject, and the tree shows the subjects who were clustered together. Wards method was used to form the clusters. The scale of the concentration ranges from 0 concentration (deep blue) to the highest concentration (bright red). (Concentrations should only be compared across individuals and not across probes)
Correspondingly a cluster of infants with low concentrations of all Bifidobacterium groups at day 120 was observed (Figure 6, cluster 1). Interestingly, among these were the infants with the highest signals to the Veillonella and Clostridium perfringens probes and among them also the infants with the highest concentration of Staphylococcus and Streptococcus.
Tracking clusters over time
We also tracked the specific clusters observed at day 4 over time, to see how each cluster evolved. However, in general the clusters identified at day 4 did not share specific microbiota component at day 120 (Figure 7). However, the tracking of clusters over time revealed that infants with initially high concentrations of Bifidobacterium still were characterized by higher concentrations of Bifidobacterium, especially Bifidobacterium 1, at day 120 than the other clusters. In contrast the marked differences between clusters in signaling to the probes detecting γ-proteobacterium and Enterobacteriacea 1 and 2 at day 4 was no longer visible, due to a decline in concentrations of these microbes in clusters that were originally high and an increase in concentrations among clusters with originally low values.
Figure 7. Clustering of infants at day 120 based on the concentration of microbial groups at day 4.

Heatmaps in which the infants have been clustered according to the concentration of microbial group at day 4 (see color code in Figure 5) and these clusters kept at day 120. The color on top of each column, below the tree, shows the cluster the infant has been assigned to at day 4. Hierarchical clustering among study subjects was performed using Spearman correlation coefficients as the similarity index and Ward's method to form the clusters. The scale of the concentration ranges from 0 concentration (deep blue) to the highest concentration (bright red). Concentrations should only be compared across individuals and not across probes.
Associations among concentrations of microbial groups at day 4 and day 120
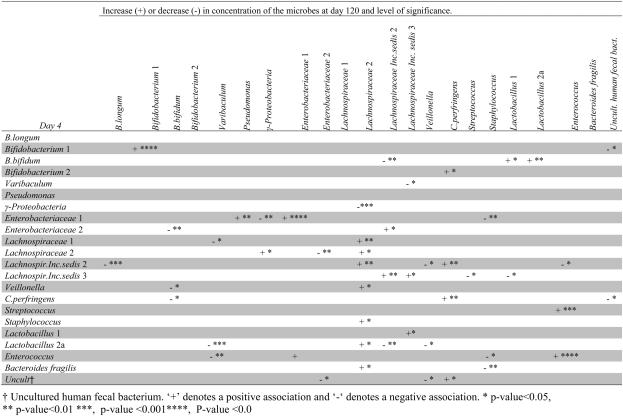
Since we could not observe cluster specific evolvement, we also evaluated the associations between the presence of a specific microbial group at day 4 and the composition of microbiota at day 120. The presence (or absence) of a microbial group at day 4 was often significantly associated with the concentration of other microbes at day 120 (Table 5). For instance, the concentration of Staphylococcus sp. by day 120 was negatively associated with the presence of Enterobacteriacea 1, and Bacteroides fragilis at day 4. The concentration of Lachnospiracea 2 at day 120 was associated with several constituents of early microbiota, especially γ-proteobacteria..
Table 5.
The association between the presence or absence of a microbe at day 4 (first column) and the concentration of each of the other microbes/microbial groups at day 120 (columns) is shown. Each row is the result of a separate model.
|
The Lachnospiracea incerta sedis 2 group at day 4 had the highest number of associations with later microbiota (Table 5). Noteworthy, is the positive association with the concentration of C. perfringens at day 120. Also the presence of Lachnospiracea incerta sedis 3, Enterobacteriacea 1 and Lactobacillus 2a at day 4, showed significant associations with a number of other microbial groups at day 120.
In contrast, the presence of B.longum and Pseudomonas at day 4 was not associated with any specific constituents of microbiota at day 120. Also, no microbial groups at day 4 were significantly associated with either Bifidobacterium 2 or Bacteriodes fragilis at day 120.
The early presence of a microbe was usually not associated with later concentrations of that same specific microbe, although some exceptions were noted, and especially strong associations were noted for Bifidobacterium 1, Enterobacteriacea 1 and Enterococcus (Table 5).
DISCUSSION
This is the first study on the composition of gut microbiota and the colonization process in infants who have experienced limited medical or dietary interventions. We also limited our analysis to the first four months of life to avoid the period of weaning, since a compositional change in gut microbiota occurs in this period (45, 46). Since medical interventions may be associated with increased risk of immune-related diseases in childhood (30, 34), studies describing a healthy gut microbiota needs to be based on children who have not been subject to such interventions. This study provides novel information of the undisturbed colonization process.
The 22 probes used in this analysis cover the most common groups identified by Palmer and coworker with several thousand probes and about 50% of their total (16). The broad groupings used in the present paper allow for study of change in composition over time that is difficult to do when thousands of probes are used to characterize the biota.
No previous studies are directly comparable to our study, since they have all included infants exposed to at least one or more of the gut modifying factors already mentioned. The different methodology used in the studies further complicates comparison. An extensive mapping of infant gut microbiota, has previously been conducted in fourteen infants by Palmer and coworker (16). Palmer's study included infants who had been delivered by cesarean section, had been given antibiotics, had stayed at the intensive care unit, and/or were not breastfed (information on antibiotics to the mother not given in the paper). In fact only four out of the fourteen infants in the Palmer study had not been subject to one or more such factors (16), therefore most of these infants probably did not exhibit an unaffected colonization process. To illustrate this, Bifidobacterium has been reported as the dominant member of the gut in healthy breastfed infants (47-50), which is in accordance with our observations, but they were only minor constituents of infant microbiota in Palmer's study. Inefficient cell lysis of Gram positive bacteria which may reduce availability of chromosomal DNA, has been offered as an explanation for low detection of Bifidobacterium in studies identifying microbes based on DNA. However, other studies based on DNA, apart from ours, have also reported a high prevalence of Bifidobacterium (17, 51, 52). Lack of breastfeeding, antibiotics, preterm birth, and caesarean delivery are all factors which have been associated with a lack of or reduction in Bifidobacterium species in infants (22, 24, 45, 53). The relative lack of Bifidobacterium in some of the recent studies may therefore instead reflect differential exposure to gut microbiota modifying factors.
Also E.coli has been an ubiquitous inhabitant in the gut of new born infants according to older classical studies, performed in the 1970s and 80s (46, 48-50, 50, 54, 55), however no longer detected in an increasing proportion of Swedish infants (56-58). In contrast, in our study Enterobacteriaceae 1 (which mainly covers E.coli and Shigella) was detected in seventy percent of our infants. The reported decline in E.coli in the microbiota of Swedish infants may not be a universal trend but may also reflect exposure to gut modifying factors in subpopulations of the infants studied.
Interestingly, several clusters of infants with quite different composition of early gut microbiota were observed in our study (Figure 5 & 6). The factors involved in shaping these distinct sub clusters are unknown and will be further studied by our research group. However, such heterogeneity even within this subset of infants selected for “natural” early life experience highlights the large variation in infant gut composition and the need to study larger samples when aiming at describing gut composition and the importance of taking into account the many factors involved in shaping gut microbiota. Interestingly, we could not observe that the distinct clusters formed at day 4 evolved differently from each other over time. Day-to-day variation in microbial content may add random variation, making it difficult to detect such patterns. However, such random variation should not reduce the validity of our group-level findings and the trend patterns support this (Figure 4).
Overall, few longitudinal studies on the evolvement of the colonization process exists and almost all are limited to cultured or species known beforehand to be constituents of the gut. Previous longitudinal studies on infant gut microbiota not restricted to already known species have been small (15-17, 24) . Our study encompassed 85 infants and the large sample size enhances the chance of identifying yet unknown constituents of microbiota and to establish both the prevalence of novel microbial constituents and their development over time with higher accuracy. More than 60% of our infants harbored microbes picked up by the Uncultured human fecal bacterium probe which detected yet undefined non-cultivable Bacteroides species (as well as B. dorei og B.vulgatus). Also frequent were signaling to the different Lachnospiracea probes. Forty-five percent of the 85 newborns had signal to the probe Lachnospiraceae 2, which detects species belonging to Ruminococcus. This finding is in accordance with the other studies based on DNA methodology, including cross sectional studies, (15, 21, 59), where species belonging to Ruminococcus were proposed to be a common novel constitute (15, 17). Noteworthy, the proportion of infants who harbored species covered by the Lachnospiracea 2 probe, showed one of the most significant increases over time (Figure 3). Moreover, it was the microbial group at day 120 which seemed most influenced by early concentration of other microbes (Table 5, column 12), indicating that it could be susceptible to alterations in early gut microbiota. However, a number of other significant associations between early and later microbiota was also observed (Table 5), indicating that the presence or absence of specific microbes at an early age may be important for subsequent composition of microbiota.
Molecular methods are appropriate for studying changes over time in concentration of a given microbial group and enables elucidation of the colonization process, which is the main focus of this study. Furthermore, by assuming that a null signal is an absence of the microbe in a given sample, we have precise data on prevalence of each microbial group over time.
A limitation in all data based on fecal samples is the inability to differentiate between colonizing and transient bacteria. Also, the composition of the colonizing microbiota differs among different segments of the gastrointestinal tract (60, 61). However, culture based studies comparing fecal and intestinal mucosal samples have shown that a strong association exists between the two (62), and an even stronger association could be expected when using molecular methods since microbial DNA is preserved during the passage through the intestium, supporting the use of fecal content to be used as an approximate of gut microbiota.
Conclusion
The present study describes the early colonization of gut bacteria in infants who have not experienced major dietary or medical interventions. It confirms the dominant role of Bifidobacterium and Enterobacteriacea reported in the older classical studies. The relative lack of these microbes in more recent studies in unselected infants could be due to the increase in medical interventions such as cesarean section.
Undefined non-cultivable species belonging to Bacteroides, as well as microbes identified as Lachnospiracea, were commonly found. Though we could not observe any cluster specific evolvement over time, strong associations were observed between some specific constituents of microbiota at day 4 and the concentration of specific microbial groups at day 120. Thus, early gut microbiota may influence later microbiota. Knowledge of the composition of a normal healthy gut microbiota and understanding the community dynamics that take place during infancy is a prerequisite for understanding the role of gut microbiota in disease and more studies among infants who have not been subject to medical interventions are needed in order to provide such knowledge.
Acknowledgments
This project has been partly financed by a grant from the South-Eastern Norway Regional Health Authority and, in part, by the Intramural Research Program of the NIH, National Institute of Environmental Health Sciences [Z01 ES045005-14]. We thank Bente Kvenshagen for her contribution in the recruitment process, and for organizing sample pick up. Finally, we thank Palmer et al for access to their clone library (16) and Sue Edelstein for graphic design.
Reference List
- 1.Backhed F, Ley RE, Sonnenburg JL, Peterson DA, Gordon JI. Host-bacterial mutualism in the human intestine. Science. 2005;307:1915–20. doi: 10.1126/science.1104816. [DOI] [PubMed] [Google Scholar]
- 2.Mitsuoka T. Intestinal flora and aging. Nutr Rev. 1992;50:438–46. doi: 10.1111/j.1753-4887.1992.tb02499.x. [DOI] [PubMed] [Google Scholar]
- 3.Round JL, Mazmanian SK. The gut microbiota shapes intestinal immune responses during health and disease. Nat Rev Immunol. 2009;9:313–23. doi: 10.1038/nri2515. [DOI] [PMC free article] [PubMed] [Google Scholar]
- 4.Turnbaugh PJ, Hamady M, Yatsunenko T, Cantarel BL, Duncan A, Ley RE, et al. A core gut microbiome in obese and lean twins. Nature. 2009;457:480–4. doi: 10.1038/nature07540. [DOI] [PMC free article] [PubMed] [Google Scholar]
- 5.Bjorksten B, Naaber P, Sepp E, Mikelsaar M. The intestinal microflora in allergic Estonian and Swedish 2-year-old children. Clin Exp Allergy. 1999;29:342–6. doi: 10.1046/j.1365-2222.1999.00560.x. [DOI] [PubMed] [Google Scholar]
- 6.Mazmanian SK, Round JL, Kasper DL. A microbial symbiosis factor prevents intestinal inflammatory disease. Nature. 2008;453:620–5. doi: 10.1038/nature07008. [DOI] [PubMed] [Google Scholar]
- 7.Sudo N, Sawamura S, Tanaka K, Aiba Y, Kubo C, Koga Y. The requirement of intestinal bacterial flora for the development of an IgE production system fully susceptible to oral tolerance induction. J Immunol. 1997;159:1739–45. [PubMed] [Google Scholar]
- 8.Mazmanian SK, Liu CH, Tzianabos AO, Kasper DL. An immunomodulatory molecule of symbiotic bacteria directs maturation of the host immune system. Cell. 2005;122:107–18. doi: 10.1016/j.cell.2005.05.007. [DOI] [PubMed] [Google Scholar]
- 9.Stappenbeck TS, Hooper LV, Gordon JI. Developmental regulation of intestinal angiogenesis by indigenous microbes via Paneth cells. Proc Natl Acad Sci U S A. 2002;99:15451–5. doi: 10.1073/pnas.202604299. [DOI] [PMC free article] [PubMed] [Google Scholar]
- 10.Sudo N, Chida Y, Aiba Y, Sonoda J, Oyama N, Yu XN, et al. Postnatal microbial colonization programs the hypothalamic-pituitary-adrenal system for stress response in mice. J Physiol. 2004;558:263–75. doi: 10.1113/jphysiol.2004.063388. [DOI] [PMC free article] [PubMed] [Google Scholar]
- 11.Midtvedt AC. Stockholm. Sweden: 1994. The establishment and development of some metabolic activities associated with the intestinal microflora in healthy children Department of Cell and Molecular Biology, Karolinska Institute. [Google Scholar]
- 12.Hooper LV, Xu J, Falk PG, Midtvedt T, Gordon JI. A molecular sensor that allows a gut commensal to control its nutrient foundation in a competitive ecosystem. Proc Natl Acad Sci U S A. 1999;96:9833–8. doi: 10.1073/pnas.96.17.9833. [DOI] [PMC free article] [PubMed] [Google Scholar]
- 13.Kuhn I, Tullus K, Mollby R. Colonization and persistence of Escherichia coli phenotypes in the intestines of children aged 0 to 18 months. Infection. 1986;14:7–12. doi: 10.1007/BF01644802. [DOI] [PubMed] [Google Scholar]
- 14.Thompson CL, Wang B, Holmes AJ. The immediate environment during postnatal development has long-term impact on gut community structure in pigs. ISME J. 2008;2:739–48. doi: 10.1038/ismej.2008.29. [DOI] [PubMed] [Google Scholar]
- 15.Wang M, Ahrne S, Antonsson M, Molin G. T-RFLP combined with principal component analysis and 16S rRNA gene sequencing: an effective strategy for comparison of fecal microbiota in infants of different ages. J Microbiol Methods. 2004;59:53–69. doi: 10.1016/j.mimet.2004.06.002. [DOI] [PubMed] [Google Scholar]
- 16.Palmer C, Bik EM, DiGiulio DB, Relman DA, Brown PO. Development of the Human Infant Intestinal Microbiota. PLoS Biol. 2007;5:e177. doi: 10.1371/journal.pbio.0050177. [DOI] [PMC free article] [PubMed] [Google Scholar]
- 17.Favier CF, Vaughan EE, De Vos WM, Akkermans AD. Molecular monitoring of succession of bacterial communities in human neonates. Appl Environ Microbiol. 2002;68:219–26. doi: 10.1128/AEM.68.1.219-226.2002. [DOI] [PMC free article] [PubMed] [Google Scholar]
- 18.Fanaro S, Chierici R, Guerrini P, Vigi V. Intestinal microflora in early infancy: composition and development. Acta Paediatr Suppl. 2003;91:48–55. doi: 10.1111/j.1651-2227.2003.tb00646.x. [DOI] [PubMed] [Google Scholar]
- 19.Gronlund MM, Lehtonen OP, Eerola E, Kero P. Fecal microflora in healthy infants born by different methods of delivery: permanent changes in intestinal flora after cesarean delivery. Journal of Pediatric Gastroenterology & Nutrition. 1999;28:19–25. doi: 10.1097/00005176-199901000-00007. [DOI] [PubMed] [Google Scholar]
- 20.Salminen S, Gibson GR, McCartney AL, Isolauri E. Influence of mode of delivery on gut microbiota composition in seven year old children. Gut. 2004;53:1388–9. doi: 10.1136/gut.2004.041640. [DOI] [PMC free article] [PubMed] [Google Scholar]
- 21.Penders J, Thijs C, Vink C, Stelma FF, Snijders B, Kummeling I, et al. Factors influencing the composition of the intestinal microbiota in early infancy. Pediatrics. 2006;118:511–21. doi: 10.1542/peds.2005-2824. [DOI] [PubMed] [Google Scholar]
- 22.Biasucci G, Benenati B, Morelli L, Bessi E, Boehm G. Cesarean delivery may affect the early biodiversity of intestinal bacteria. J Nutr. 2008;138:1796S–800S. doi: 10.1093/jn/138.9.1796S. [DOI] [PubMed] [Google Scholar]
- 23.Bennet R, Eriksson M, Nord CE, Zetterstrom R. Fecal bacterial microflora of newborn infants during intensive care management and treatment with five antibiotic regimens. Pediatr Infect Dis. 1986;5:533–9. doi: 10.1097/00006454-198609000-00009. [DOI] [PubMed] [Google Scholar]
- 24.Songjinda P, Nakayama J, Kuroki Y, Tanaka S, Fukuda S, Kiyohara C, et al. Molecular monitoring of the developmental bacterial community in the gastrointestinal tract of Japanese infants. Biosci Biotechnol Biochem. 2005;69:638–41. doi: 10.1271/bbb.69.638. [DOI] [PubMed] [Google Scholar]
- 25.el-Mohandes AE, Keiser JF, Johnson LA, Refat M, Jackson BJ. Aerobes isolated in fecal microflora of infants in the intensive care nursery: relationship to human milk use and systemic sepsis. Am J Infect Control. 1993;21:231–4. doi: 10.1016/0196-6553(93)90414-y. [DOI] [PubMed] [Google Scholar]
- 26.Hallstrom M, Eerola E, Vuento R, Janas M, Tammela O. Effects of mode of delivery and necrotising enterocolitis on the intestinal microflora in preterm infants. Eur J Clin Microbiol Infect Dis. 2004;23:463–70. doi: 10.1007/s10096-004-1146-0. [DOI] [PubMed] [Google Scholar]
- 27.Ecker JL, Frigoletto FD., Jr Cesarean delivery and the risk-benefit calculus. N Engl J Med. 2007;356:885–8. doi: 10.1056/NEJMp068290. [DOI] [PubMed] [Google Scholar]
- 28.Eggesbo M, Botten G, Stigum H, Nafstad P, Magnus P. Is delivery by cesarean section a risk factor for food allergy? J Allergy Clin Immunol. 2003;112:420–6. doi: 10.1067/mai.2003.1610. [DOI] [PubMed] [Google Scholar]
- 29.Eggesbo M, Botten G, Stigum H, Samuelsen SO, Brunekreef B, Magnus P. Cesarean delivery and cow milk allergy/intolerance. Allergy. 2005;60:1172–3. doi: 10.1111/j.1398-9995.2005.00857.x. [DOI] [PubMed] [Google Scholar]
- 30.Bager P, Wohlfahrt J, Westergaard T. Caesarean delivery and risk of atopy and allergic disease: meta-analyses. Clin Exp Allergy. 2008;38:634–42. doi: 10.1111/j.1365-2222.2008.02939.x. [DOI] [PubMed] [Google Scholar]
- 31.Thavagnanam S, Fleming J, Bromley A, Shields MD, Cardwell CR. A meta-analysis of the association between Caesarean section and childhood asthma. Clin Exp Allergy. 2008;38:629–33. doi: 10.1111/j.1365-2222.2007.02780.x. [DOI] [PubMed] [Google Scholar]
- 32.Cardwell CR, Stene LC, Joner G, Cinek O, Svensson J, Goldacre MJ, et al. Caesarean section is associated with an increased risk of childhood-onset type 1 diabetes mellitus: a meta-analysis of observational studies. Diabetologia. 2008;51:726–35. doi: 10.1007/s00125-008-0941-z. [DOI] [PubMed] [Google Scholar]
- 33.Guarner F, Bourdet-Sicard R, Brandtzaeg P, Gill HS, McGuirk P, van EW, et al. Mechanisms of disease: the hygiene hypothesis revisited. Nat Clin Pract Gastroenterol Hepatol. 2006;3:275–84. doi: 10.1038/ncpgasthep0471. [DOI] [PubMed] [Google Scholar]
- 34.Eggesbo M, Trogstad L. Caesarean delivery, gut microbiota and food allergy. European Journal of Nutraceuticals and Functional Foods. 2009;6((20) Suppl):6–9. 2009;Suppl (20):6-9. [Google Scholar]
- 35.Skjaerven R, Gjessing HK, Bakketeig LS. Birthweight by gestational age in Norway. Acta Obstet Gynecol Scand. 2000;79:440–9. [PubMed] [Google Scholar]
- 36.Rudi K, Zimonja M, Naes T. Alignment-independent bilinear multivariate modelling (AIBIMM) for global analyses of 16S rRNA gene phylogeny. Int J Syst Evol Microbiol. 2006;56:1565–75. doi: 10.1099/ijs.0.63936-0. [DOI] [PubMed] [Google Scholar]
- 37.Teeling H, Waldmann J, Lombardot T, Bauer M, Glockner FO. TETRA: a web-service and a stand-alone program for the analysis and comparison of tetranucleotide usage patterns in DNA sequences. BMC Bioinformatics. 2004;5:163. doi: 10.1186/1471-2105-5-163. [DOI] [PMC free article] [PubMed] [Google Scholar]
- 38.Rudi K, Nogva HK, Moen B, Nissen H, Bredholt S, Moretro T, et al. Development and application of new nucleic acid-based technologies for microbial community analyses in foods. Int J Food Microbiol. 2002;78:171–80. doi: 10.1016/s0168-1605(02)00236-2. [DOI] [PubMed] [Google Scholar]
- 39.Rudi K, Zimonja M, Kvenshagen B, Rugtveit J, Midtvedt T, Eggesbo M. Alignment-independent comparisons of human gastrointestinal tract microbial communities in a multidimensional 16S rRNA gene evolutionary space. Appl Environ Microbiol. 2007;73:2727–34. doi: 10.1128/AEM.01205-06. [DOI] [PMC free article] [PubMed] [Google Scholar]
- 40.Altschul SF, Gish W, Miller W, Myers EW, Lipman DJ. Basic local alignment search tool. J Mol Biol. 1990;215:403–10. doi: 10.1016/S0022-2836(05)80360-2. [DOI] [PubMed] [Google Scholar]
- 41.Ladunga I. Finding homologs to nucleotide sequences using network BLAST searches. Curr Protoc Bioinformatics. 2002 doi: 10.1002/0471250953.bi0303s00. Chapter 3:Unit. [DOI] [PubMed] [Google Scholar]
- 42.Nadkarni MA, Martin FE, Jacques NA, Hunter N. Determination of bacterial load by real-time PCR using a broad-range (universal) probe and primers set. Microbiology. 2002;148:257–66. doi: 10.1099/00221287-148-1-257. [DOI] [PubMed] [Google Scholar]
- 43.Peddada S, Harris S, Zajd J, Harvey E. ORIOGEN: order restricted inference for ordered gene expression data. Bioinformatics. 2005;21:3933–4. doi: 10.1093/bioinformatics/bti637. [DOI] [PubMed] [Google Scholar]
- 44.Peddada S, Harris S, Davidov O. Analysis of Correlated Gene Expression data on Ordered Categories. 2010 in press ed. [PMC free article] [PubMed] [Google Scholar]
- 45.Orrhage K, Nord CE. Factors controlling the bacterial colonization of the intestine in breastfed infants. Acta Paediatr Suppl. 1999;88:47–57. doi: 10.1111/j.1651-2227.1999.tb01300.x. [DOI] [PubMed] [Google Scholar]
- 46.Stark PL, Lee A. The microbial ecology of the large bowel of breast-fed and formula-fed infants during the first year of life. J Med Microbiol. 1982;15:189–203. doi: 10.1099/00222615-15-2-189. [DOI] [PubMed] [Google Scholar]
- 47.Matsuki T, Watanabe K, Tanaka R, Fukuda M, Oyaizu H. Distribution of bifidobacterial species in human intestinal microflora examined with 16S rRNA-gene-targeted species-specific primers. Appl Environ Microbiol. 1999;65:4506–12. doi: 10.1128/aem.65.10.4506-4512.1999. [DOI] [PMC free article] [PubMed] [Google Scholar]
- 48.Rotimi VO, Duerden BI. The development of the bacterial flora in normal neonates. J Med Microbiol. 1981;14:51–62. doi: 10.1099/00222615-14-1-51. [DOI] [PubMed] [Google Scholar]
- 49.Benno Y, Sawada K, Mitsuoka T. The intestinal microflora of infants: composition of fecal flora in breast-fed and bottle-fed infants. Microbiol Immunol. 1984;28:975–86. doi: 10.1111/j.1348-0421.1984.tb00754.x. [DOI] [PubMed] [Google Scholar]
- 50.Yoshioka H, Iseki K, Fujita K. Development and differences of intestinal flora in the neonatal period in breast-fed and bottle-fed infants. Pediatrics. 1983;72:317–21. [PubMed] [Google Scholar]
- 51.Favier CF, De Vos WM, Akkermans AD. Development of bacterial and bifidobacterial communities in feces of newborn babies. Anaerobe. 2003;9:219–29. doi: 10.1016/j.anaerobe.2003.07.001. [DOI] [PubMed] [Google Scholar]
- 52.Harmsen HJ, Wildeboer-Veloo AC, Raangs GC, Wagendorp AA, Klijn N, Bindels JG, et al. Analysis of intestinal flora development in breast-fed and formula-fed infants by using molecular identification and detection methods. J Pediatr Gastroenterol Nutr. 2000;30:61–7. doi: 10.1097/00005176-200001000-00019. [DOI] [PubMed] [Google Scholar]
- 53.Stark PL, Lee A. The bacterial colonization of the large bowel of pre-term low birth weight neonates. J Hyg (Lond) 1982;89:59–67. doi: 10.1017/s0022172400070546. [DOI] [PMC free article] [PubMed] [Google Scholar]
- 54.Mata LJ, Urrutia JJ. Intestinal Colonization of Breast-Fed Children in a Rural Area of Low Socioeconomic Level. Annals of the New York Academy of Sciences. 1971;176:93–109. [Google Scholar]
- 55.Sakata H, Fujita K, Yoshioka H. The effect of antimicrobial agents on fecal flora of children. Antimicrob Agents Chemother. 1986;29:225–9. doi: 10.1128/aac.29.2.225. [DOI] [PMC free article] [PubMed] [Google Scholar]
- 56.Adlerberth I, Jalil F, Carlsson B, Mellander L, Hanson LA, Larsson P, et al. High turnover rate of Escherichia coli strains in the intestinal flora of infants in Pakistan. Epidemiology & Infection. 1998;121:587–98. doi: 10.1017/s0950268898001484. [DOI] [PMC free article] [PubMed] [Google Scholar]
- 57.Nowrouzian F, Hesselmar B, Saalman R, Strannegard IL, Aberg N, Wold AE, et al. Escherichia coli in Infants' Intestinal Microflora: Colonization Rate, Strain Turnover, and Virulence Gene Carriage. Pediatr Res. 2003;54:8–14. doi: 10.1203/01.PDR.0000069843.20655.EE. [DOI] [PubMed] [Google Scholar]
- 58.Gareau FE, Mackel DC, Boring JR, III, Payne FJ, Hammett FL. The acquisition of fecal flora by infants from their mothers during birth. J Pediatr. 1959;54:313–8. doi: 10.1016/s0022-3476(59)80005-6. [DOI] [PubMed] [Google Scholar]
- 59.Hopkins MJ, Macfarlane GT, Furrie E, Fite A, Macfarlane S. Characterisation of intestinal bacteria in infant stools using real-time PCR and northern hybridisation analyses. FEMS Microbiol Ecol. 2005;54:77–85. doi: 10.1016/j.femsec.2005.03.001. [DOI] [PubMed] [Google Scholar]
- 60.Eckburg PB, Bik EM, Bernstein CN, Purdom E, Dethlefsen L, Sargent M, et al. Diversity of the human intestinal microbial flora. Science. 2005;308:1635–8. doi: 10.1126/science.1110591. [DOI] [PMC free article] [PubMed] [Google Scholar]
- 61.Zoetendal EG, von WA, Vilpponen-Salmela T, Ben-Amor K, Akkermans AD, De Vos WM. Mucosa-associated bacteria in the human gastrointestinal tract are uniformly distributed along the colon and differ from the community recovered from feces. Appl Environ Microbiol. 2002;68:3401–7. doi: 10.1128/AEM.68.7.3401-3407.2002. [DOI] [PMC free article] [PubMed] [Google Scholar]
- 62.Ouwehand AC, Salminen S, Arvola T, Ruuska T, Isolauri E. Microbiota composition of the intestinal mucosa: association with fecal microbiota? Microbiol Immunol. 2004;48:497–500. doi: 10.1111/j.1348-0421.2004.tb03544.x. [DOI] [PubMed] [Google Scholar]