

Abstract
Trbp111 is a 111 amino acid Aquifex aeolicus structure-specific tRNA-binding protein that has homologous counterparts distributed throughout evolution. A dimer is the functional unit for binding a single tRNA. Here we report the 3D structures of the A.aeolicus protein and its Escherichia coli homolog at resolutions of 2.50 and 1.87 Å, respectively. The structure shows a symmetrical dimer of two core domains and a central dimerization domain where the N- and C-terminal regions of Trbp111 form an extensive dimer interface. The core of the monomer is a classical oligonucleotide/oligosaccharide-binding (OB) fold with a five-stranded β-barrel and a small capping helix. This structure is similar to that seen in the anticodon-binding domain of three class II tRNA synthetases and several other proteins. Mutational analysis identified sites important for interactions with tRNA. These residues line the inner surfaces of two clefts formed between the β-barrel of each monomer and the dimer interface. The results are consistent with a proposed model for asymmetrical docking of the convex side of tRNA to the dimer.
Keywords: crystal structure/oligonucleotide/oligosaccharide-binding fold/RNA binding protein/tRNA synthetase
Introduction
Trbp111 from Aquifex aeolicus is an unusual structure-specific tRNA-binding protein that has been characterized as a homodimer of 111 amino acid polypeptides (Morales et al., 1999). Many RNA-binding proteins are specific for a particular RNA structure and sequence (such as aminoacyl-tRNA synthetases) or bind non-specifically to a variety of RNAs [such as the major cold-shock proteins (Jiang et al., 1997) and the influenza virus NS1 protein, which recognize single- and double-stranded RNA (Wang et al., 1999)]. Trbp111, on the other hand, recognizes the L-shape of the tRNA fold regardless of sequence. Other tRNA-binding proteins exhibit specificity for the tRNA structure to a lesser extent [e.g. the translation elongation factor and some tRNA modifying enzymes (Björk et al., 1987; Clark and Nyborg, 1997)].
While Trbp111 was originally isolated from the ancient thermophile A.aeolicus, homologous proteins are found distributed throughout nature. These homologs occur as free-standing proteins, such as the 110 amino acid homolog that is present in Escherichia coli (initially identified as an uncharacterized open reading frame), or as parts of other proteins, such as the mammalian cytokine EMAPII (Kao et al., 1994; Quevillon et al., 1997) and yeast Arc1p, a protein important for nuclear trafficking of tRNA (Simos et al., 1996, 1998).
While the cellular role of Trbp111 is not known, we showed previously that it is a homodimeric protein that binds to the tRNA structure with high affinity (Morales et al., 1999). Its presence as a conserved recurrent module in some aminoacyl-tRNA synthetases has led to the proposal that Trbp111 may act as a molecular assistant to protect and hold tRNA as a substrate for aminoacylation. Indeed, Arc1p has been shown to promote aminoacylation of two specific tRNAs (Simos et al., 1996). Because Trbp111 interacts with the outside corner of the L-shaped tRNA (where the two domains of the tRNA structure are brought together, our unpublished observations), the potential for Trbp111 to have played a role in stabilizing and promoting the L-shape of an emerging tRNA structure in evolution is also suggested.
To understand more deeply the molecular basis of the novel binding specificity of Trbp111, we set out to determine its crystal structure and, at the same time, to determine which residues within the protein were essential for interaction with tRNA. Preliminary work had yielded crystals of Trbp111 and initial X-ray analysis revealed the presence of a dimeric structure (Morales et al., 1999). We also obtained crystals of the E.coli homolog and were subsequently able to make several isomorphous heavy atom derivatives. While the E.coli protein is less well characterized in vitro, the similarity of its sequence to Trbp111 and the observed dimeric structure gave us confidence that its structure could be used to solve by molecular replacement the structure of A.aeolicus Trbp111. Together with the mutagenesis work, we were then able to construct a model for the novel complex of Trbp111 with the L-shaped tRNA.
Results
Overall structure
Trbp111 and its E.coli homolog share 27% amino acid sequence identity. Crystal structures of both proteins were pursued simultaneously, but de novo structure determination of the E.coli homolog was easier due to its smaller unit cell and better quality X-ray diffraction on in-house equipment (Table I). Therefore, the crystal structure of the E.coli homolog of Trbp111 was solved to 1.87 Å resolution by multiple isomorphous replacement with anomalous scattering (MIRAS) combined with multi-wavelength anomalous diffraction (MAD) methods. The resulting model was then used to obtain the molecular replacement solution of the A.aeolicus protein at 2.5 Å resolution.
Table I. Crystallographic data collection and structure refinement statistics for A.aeolicus Trbp111 and its E.coli homolog.
| Crystal |
E.coli homolog |
|
|
|
|
A.aeolicus Trbp111 |
|---|---|---|---|---|---|---|
| Native | Hg acetate | PtK2Cl4 | TMPbAca | 3-wavelength Pt derivative | ||
| Space group | P3221 | C2 | ||||
| Unit cell a, c (Å) | 41.2, 95.3 | 41.3, 95.2 | 40.9, 95.3 | 41.3, 95.6 | 41.6, 96.2 | 145.4,72.79 (b), 68.94,β = 91.93° |
| Wavelength (Å) | 1.54 | 1.54 | 1.54 | 1.54 | 1.074, 1.0733, 1.055 | 1.08 |
| Resolution (Å) | 1.87 | 2.3 | 2.8 | 2.0 | 1.9 | 2.4 |
| last bin (Å) | 1.94–1.87 | 2.38–2.3 | 2.85–2.8 | 2.07–2.0 | 1.93–1.9 | 2.44–2.40 |
| Unique reflections | 8064 | 4466 | 2514 | 6791 | 8024, 8032, 8478 | 26611 |
| Completeness (%) | 97.4 | 95.3 | 99.8 | 99.6 | 99.2, 99.3, 99.2 | 94.0 |
| last bin | 96.1 | 80.5 | 100.0 | 100.0 | 100.0, 100.0, 98.9 | 88.4 |
| Rsym (%)b | 3.1 | 3.0 | 9.9 | 3.9 | 6.6, 6.3, 6.2 | 4.2 |
| last bin | 11.6 | 8.3 | 36.1 | 10.2 | 32.9, 35.7, 45.2 | 36.1 |
| <I/σ(I)> | 19.0 | 15.8 | 5.8 | 20.6 | 12.0, 11.5, 10.9 | 9.7 |
| last bin | 13.6 | 7.2 | 3.2 | 15.6 | 5.9, 6.3, 4.5 | 2.9 |
| Final phasing statistics (7.0–2.0 Å) | (35–2.0 Å) | |||||
| Rder (%)c | 12.3 | 29.7 | 10.1 | 1.9, 2.9d | ||
| Ranom (%)e | 3.9 | 6.8 | 2.0 | 3.6, 3.7d | ||
| Rcullisf | 0.82 | 0.81 | 0.71 | 0.65, 0.73d | ||
| number of sites | 2 | 2 | 1 | 2 | ||
| phasing powerg | ||||||
| isomorphous | 0.96 | 1.35 | 1.15 | 1.1, 1.1d | ||
| anomalous | 0.65 | 1.2 | 0.80 | 2.6, 2.6d | ||
| FOMh (overall, 20–2.0 Å) | 0.54 | 0.32 | ||||
| FOM after density modification (20–1.87 Å) | 0.95 | |||||
| Refinement statistics | ||||||
| resolution range (Å) | 20–1.87 | 20–2.5 | ||||
| no. of reflectionsi | 7989 | 23 601 | ||||
| no. of non-H atoms | ||||||
| protein | 860 | 3216 | ||||
| water | 136 | 141 | ||||
| r.m.s.d. bond length (Å) | 0.007 | 0.005 | ||||
| r.m.s.d. bond angle (°) | 1.73 | 1.6 | ||||
| R-cryst (%)j, F > 0 | 15.8 | 18.9 | ||||
| R-free (%)k, F > 0 | 19.8 | 22.0 | ||||
| Ramachandran plot (%)l | ||||||
| favored | 96.1 | 89.9, 90.0, 90.2, 89.0 | ||||
| allowed | 3.9 | 10.1, 10.0, 9.8, 11.0 | ||||
| mean b-factor for protein atoms (Å3/Da) | 20.0 | 26.8 |
aTMPbAc, trimethyl lead acetate.
bRsym = 100 × (∑h∑i|<I(h)> – I(h)i|) ÷ ∑h∑iI(h)i, where I(h)i is the ith measurement of reflection h and <I(h)> is the mean intensity of the n symmetry-related measurements.
cRder = 100 × (∑h|FPH – FP|) ÷ ∑h|FP|, where FP and FPH are the observed structure factor amplitudes of the native and the derivative, respectively.
dFor MAD data, the dispersive differences were treated as isomorphous replacement information where the data collected at wavelength 1.074 Å are treated as native data (Terwilliger, 1994).
eRanom = 100 × (∑h|FPH+ – FPH–|) ÷ ∑h|<FPH>|, where FPH+ and FPH– are the Friedel pair observed structure factor amplitudes of the derivative at a given wavelength and <FPH> is their average.
fRCullis = ∑h[|FH| – (|FPH| – |FP|)] ÷ ∑h(|FPH| – |FP|), where |FH| is the calculated heavy atom structure factor for reflection h.
gPPiso = (1/Nrefl)∑h[||FPH| – |FP|| ÷ <_UNICODE:8747>02π(|FPH – FPHcalc|)P(ϕ)d(ϕ) ], where P(ϕ) is the probability of a phase value of ϕ for reflection h. PPano = (1/Nrefl) ∑h[|ΔobsANO| ÷ <_UNICODE:8747>02π(|ΔobsANO – ΔcalcANO|)P(ϕ)d(ϕ), where ΔobsANO and ΔcalcANO are the Friedel pair differences in the observed and calculated structure factor amplitudes, respectively, for reflection h.
hFOM, figure of merit.
iReflections with F > 0 were used in refinement.
jCrystallographic R factor = 100 × [∑h||Fobs(h)| – |Fcalc(h)||] ÷ ∑h|Fobs(h)|, where Fobs(h) and Fcalc(h) are the observed structure factor amplitude and the structure factor amplitude calculated from the model, respectively.
kThe free R-factor was calculated using 90% of the data in the last round of refinement.
lThe Ramachandran plot was generated in PROCHECK (Howard et al., 1987).
For the E.coli protein the structure was first determined to 2.8 Å by MIRAS methods using three derivatives of the P3221 crystals (Table I, left four columns). Later, one derivative (Pt) was used in a MAD phasing attempt (Table I, column 5), but the resulting MAD map at 2.0 Å resolution was not easily interpretable. To ease in map fitting, an auto-traceable map, calculated at a resolution of >2.0 Å, was sought. This map was obtained at 1.87 Å by combining the MIRAS and MAD phases (see Materials and methods), applying density modification and phase extension (Figure 1A). The refined model of the E.coli protein was then used to obtain the molecular replacement solution of the A.aeolicus protein crystals (Table I, column 6; Figure 1B).


Fig. 1. (A) A representative region of the 1.87 Å experimental electron density map of the E.coli homolog. The map is calculated after solvent flattening and contoured at 1.4σ in the vicinity of Thr42–Val46 (numbers for E.coli protein) and the mercury binding site. The map is superimposed on the refined model. (B) A 2Fo – Fc simulated annealing (2.5 Å, temperature 2000 K) omit map (contoured at 1.3σ) of residues Ile7–Leu17 (omitted from the phase calculation) of the A.aeolicus Trbp111 structure. The refined model for Ile7–Asp16 is also shown. (C) Ribbon representation of the overall structure of the A.aeolicus Trbp111 symmetrical homodimer from the side view with the dimer 2-fold axis running vertically in the plane of the figure. The monomers are shown in different colors. The two OB-fold domains (strands β1–β5 and helix α2), the N-terminal part (helix α1) of the dimerization domain, the loops and the N- and C-termini are labeled. Dotted lines indicate some of the side chain interactions in the dimerization domain. (D) As (C), but with the view looking down the dimer 2-fold axis from the C-terminal region. The C-terminal part (strands β6–β8) of the dimerization domain and loops L8 and L9 are labeled.
The models of the described structures account for all but the N-terminal methionine of the 111 amino acid A.aeolicus Trbp111 and all 110 amino acids of its E.coli homolog. The two structures reveal similar, oblate homodimers with approximate dimensions 60 × 40 × 30 Å (Figure 1C and D). The asymmetric unit of the A.aeolicus Trbp111 crystals contains two dimers, whereas that of the E.coli homolog contains half of a dimer. Each monomer consists of eight β-strands and two short α-helices arranged into two domains (Figure 1C and D).
The first domain is based on the classical oligonucleotide/oligosaccharide-binding fold (OB-fold), which is constituted of a five-stranded β-barrel (strands β1–β5) with a small capping helix (α2) (Murzin, 1993). This domain forms the core of the monomer structure. The five strands span residues 17–26, 36–40, 45–49, 65–69 and 85–86, respectively (Figure 2).
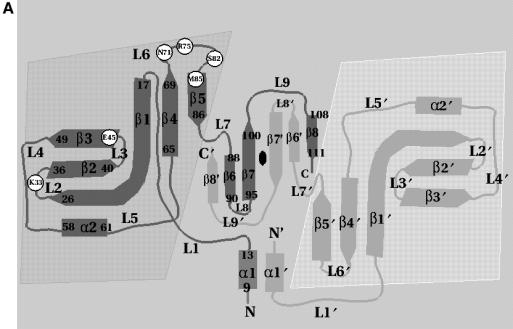

Fig. 2. (A) Schematic representation of the topology of Trbp111. For clarity, starting and ending residues of secondary structure elements are shown on one monomer only. Shaded areas denote the OB-fold domains and the central region is the dimerization domain. Circles are positions of alanine substitutions that diminish tRNA binding. Secondary structure nomenclature corresponds to the A.aeolicus sequence. (B) Sequence alignment of A.aeolicus Trbp111 and its E.coli homolog showing identities (vertical lines) and similarities (dots). Sites of alanine substitutions that diminish or do not affect tRNA binding are highlighted in dark and light gray, respectively.
The second domain is made up of the N- and C-terminal regions of the protein. These regions extend toward and interact with the core domain and termini of the opposite monomer and thereby form an extensive dimer interface. Using a 1.4 Å probe, the calculated dimer interface constitutes 27% of the total solvent-exposed surface area of the monomer (Lee and Richard, 1971). The presence of the same dimer in crystals of both A.aeolicus Trbp111 and its E.coli homolog and the observed extensive dimer interface are consistent with Trbp111 functioning as a dimer in vitro (Morales et al., 1999).
Organization of the dimer interface
The quaternary structure of the Trbp111 dimer exhibits a unique topology (Figures 1C and D, and 2A). The two OB-fold domains, one from each monomer, are spatially separated from the central dimerization domain, leaving two clefts that are ∼16 Å wide and 12 Å deep (Figure 1D). Site-directed mutagenesis showed this cleft to be the site of tRNA binding (see below).
The dimer interface is localized to two regions. The first is the two anti-parallel N-terminal helices (α1 and α1′), which are held together by two salt bridge interactions between Lys14 (Arg11 in E.coli) or Asp11 (Asp8 in E.coli) in one monomer and Asp11′ or Lys14′ in the other, respectively (Figure 1C). These helices are amphipathic and their hydrophobic sides face the core of the structure.
The second part of the dimer interface is a six-stranded β-sheet formed by an anti-parallel arrangement of the three C-terminal β-strands (β6–β8) from each monomer (Figures 1D and 2A and B). The longest strand in the sheet, β7, contains a β-bulge at residues Val97–Ile98 (Leu96–Leu97 in the E.coli protein). The N- and C-terminal halves of β7 interact via backbone hydrogen bonds with β6 and β7′ of the opposite monomer, respectively. While β6 and β7 from one monomer form an anti-parallel β-hairpin within the sheet, β8 swaps position across the dimer axis to stack anti-parallel to β6′ of the opposite monomer (Figures 1D and 2A). Most of the interactions in this part of the dimer interface are between backbone atoms, conforming with a β-sheet hydrogen bonding pattern. Side chain interactions in this region are seen between Asp101 and Lys64′, Ile98 and Ile98′ and an amino–aromatic interaction between the side chains of Arg102 and Tyr55′. This elaborate topology for dimerization is consistent with a tight dimer as the functional tRNA-binding unit (Morales et al., 1999).
Comparison of the two structures
The two dimers in the A.aeolicus Trbp111 crystal are similar. When superimposed, the root mean square deviation (r.m.s.d.) in the positions of backbone atoms from all 220 residues is 1.5 Å. On the other hand, comparison of the A.aeolicus Trbp111 dimer with that of the E.coli homolog shows variations in the positions of loops L2, L6 and L8 and helix α1 (Figure 3). The three loops and helix α1 form the rim of the aforementioned cleft. Loops L2 and L6 are involved in tRNA recognition, as revealed by the mutagenesis analysis (see below). The apparent flexibility of loop L6 in particular is also indicated by its high b-factor values in the crystal structure (average b-factor 32.0 Å3/Da, as compared with 26.8 Å3/Da for the entire dimer). There is also a slight change in the relative angle between the monomers (Figure 3) in the A.aeolicus protein as compared with the E.coli homolog. Superimposition of the entire dimer from the two structures yields an r.m.s.d. in their common 220 Cα positions of 8.3 Å. Optimal superimposition of either monomer by itself yields an overall r.m.s.d. in all 110 Cα positions of 7.9 Å. Interactions at the dimer interface in both structures are largely similar, with slightly asymmetrical inter-monomer hydrogen bond distances in the case of the A.aeolicus protein. Although these variations between the two proteins could be attributed to differences in crystal contacts, they are suggestive of an intra-monomer as well as an inter-monomer structural flexibility within the Trbp111 dimer.

Fig. 3. Superimposition of the structures of A.aeolicus Trbp111 (light gray) and its E.coli homolog (black and dark gray) shown as stick models of Cα carbon traces. The superimposition, done with the Cα atoms of monomer only (light gray and black), shows the difference in the relative positions of the other monomers (light and dark gray) between the two proteins. The figure was made using Raster3D (Merritt and Bacon, 1997).
Similarity to anticodon-binding domains of class IIb aminoacyl-tRNA synthetases
A search for similar structures was done using the DALI search engine and the FSSP database (fold classification based on structure–structure alignment of proteins; Holm and Sander, 1996). No less than 10 different proteins containing OB-fold domains with different degrees of similarity to Trbp111 were identified. Sequence identities between Trbp111 and these various OB-fold-containing proteins do not exceed 25%. Among these are bacterial translational initiation factor IF1 (Sette et al., 1997; r.m.s.d. 2.9 Å over 64 aligned Cα atoms), the S1 RNA-binding domain, such as that found in polynucleotide phosphorylase (Bycroft et al., 1997; r.m.s.d. 2.6 Å over 57 Cα atoms), the prokaryotic cold-shock domain (e.g. E.coli CspA, r.m.s.d. 2.4 Å over 44 Cα atoms; Schindelin et al., 1993, 1994) and four tRNA synthetases. One of the latter is the phenylalanyl-tRNA synthetase (Goldgur et al., 1997), which contains an OB-fold in its B2 domain, the function of which is unknown. The remaining three synthetases are subclass IIb synthetases: aspartyl-tRNA (Ruff et al., 1991; Eiler et al., 1999), lysyl-tRNA (Commans et al., 1995; Cusack et al., 1996) and asparaginyl-tRNA synthetases (Berthet-Colominas et al., 1998). Each contains an OB-fold in its N-terminal anticodon-binding domain. The major differences in the OB-folds of these proteins are in the relative orientation of the five β-strands of the barrel and the length of the capping helix (α2 in Trbp111), which, in some cases, is absent (for a review see Murzin, 1993).
Superimposition of A.aeolicus Trbp111 on the anticodon-binding domain region of E.coli AspRS (PDB entry 1COA; Eiler et al., 1999) shows that the two structures are similar (Figure 4), with an r.m.s.d. of 3.7 Å in the positions of 72 superimposed core Cα carbon atoms. The largest differences are in helix α1, loop L6 (S4–S5 loop in E.coli AspRS) and the N- and C-terminal regions. Helix α1 is longer in AspRS (2.5 helical turns) than in Trbp111 (1 turn) and the S4–S5 loop is longer and adopts a different conformation. The N-terminal 18 amino acids and C-terminal seven amino acids of the AspRS anticodon-binding domain fold back against the surface of the β-barrel whereas in Trbp111 they form the dimer interface.

Fig. 4. Stereo view of the superimposition of A.aeolicus Trbp111 (blue) on the anticodon-binding domain of E.coli AspRS (black), looking down the AspRS anticodon-binding pocket. One Trbp111 monomer is shown. Side chains of residues important for tRNA binding are shown in ball-and-stick representation. Conserved AspRS residues important for recognition of anticodon bases (Eiler et al., 1999) are in red. Other, non-conserved residues involved in tRNA binding are in black. Trbp111 residues found important for tRNA binding by mutagenesis experiments are in blue. The figure was made using MOLSCRIPT (Kraulis, 1991).
AspRS and LysRS bind to the tRNA anticodon stem and loop in a similar mode in which a hydrophobic pocket on the side of the β-barrel interacts with the RNA minor groove. The binding pocket is formed between strands β1, β2 and β3 on one side and the loop connecting strands β4 and β5 (S4–S5 loop in AspRS; loop L6 in Trbp111) on the other (Figure 4). Three residues that are strictly conserved in class IIb synthetases, Phe35, Arg28 and Gln46 (E.coli AspRS residue numbers), lie in the center of the pocket and interact (particularly Phe35) with anticodon bases. In the 3D structure superimposition, these residues correspond to Lys36, Arg27 and Thr47 located in the OB-fold of the A.aeolicus Trbp111 structure, respectively. Lys36 and Arg27 do not appear to be involved in tRNA binding of Trbp111, as indicated by the mutagenesis experiments (see below).
In the AspRS S4–S5 loop, hydrophilic residues, such as Arg76, Arg78 and Asn82, form several direct hydrogen bonds with the tRNA backbone and base atoms. In Trbp111 this loop is much shorter and contains Lys73, Arg75 and Ser82 in similar positions. Arg75 and Ser82 were identified as tRNA-binding determinants in A.aeolicus Trbp111 by mutagenesis (see below). This suggests that Trbp111 may interact with the tRNA backbone by hydrogen bonding via these residues. The A.aeolicus Trbp111 structure contains no conserved, exposed aromatic residues such as Phe35 of AspRS. This observation is consistent with a binding mode free of specific interactions with tRNA bases. A similar observation is made when superimposing Trbp111 on the major cold-shock proteins (CSPs), which act as RNA chaperones, presumably to prevent the formation of secondary structures of RNA at low temperatures. CSPs bind to single-stranded RNA via aromatic clusters located on the surface of the β-barrel (Schindelin et al., 1993). No such aromatic clusters are found in the Trbp111 structure. Furthermore, no ribonucleoprotein (RNP) motifs, used by many nucleotide-binding proteins for specific base recognition (e.g. some CSPs and E.coli IF1) could be located in the Trbp111 sequence or structure. These observations indicate that Trbp111 is unlikely to bind tRNA in a similar fashion to that known for other OB-fold-containing RNA-binding proteins.
Binding site for tRNA revealed by mutagenesis
In order to determine the residues in Trbp111 that make up the binding site for tRNA, we hypothesized that the sequence non-specificity of Trbp111 binding was dominated by electrostatic interactions with backbone phosphates. To test this hypothesis, single alanine replacements were made in the sequence of A.aeolicus Trbp111 at positions with basic side chains (Figure 5). These included Arg18, Arg27, Arg46, Arg54, Arg75 and Arg102, and Lys14, Lys21, Lys33, Lys36, Lys64 and Lys65. In addition, we selected other residues based on a slight alteration of the multivariate sequence analysis method used in Ortiz and Skolnick (2000). This method attempts to assign a relevance value to residues based on analysis of multiple sequence alignments. A large cluster of relevant residues was predicted between Ala70 and Ser90. Of these, alanine replacements were made at Asn71, Ser82 and Met85, because these residues are well conserved (Figure 5) and thus could be involved in tRNA binding. Finally, Glu45 was substituted to assess the importance of one of the three conserved acidic residues (Asp43, Glu44 and Glu45) that also fell in an area of high predicted relevance. In total, 15 mutant proteins were constructed and purified. All but K64K65 are single site mutants (Figure 6).

Fig. 5. Alignment of Trbp111-like domains. Fifty-two sequences were aligned with A.aeolicus Trbp111. The naming convention is as follows: the first letter indicates family (T, Trbp111-like; M, C-term of MetRS; A, Arc1p-like; E, EmapII-like; Y, C-term of TyrRS); the second letter indicates kingdom (E, eukaryotes; B, eubacteria; A, archaea). The species name then follows (up to 10 characters total). Conservation levels are indicated by shading, as follows: 100% similarity across all species is shown in red; 80% similarity is shown in green; blue denotes 60% similarity. The locations of mutants in Trbp111 having no effect on tRNA binding are indicated with blue triangles and those locations identified as important for tRNA binding are indicated with red triangles.

Fig. 6. Binding of site-directed mutants of A.aeolicus Trbp111 to  . Gel mobility shift assays of mutant proteins binding to 5′-[32P] are listed schematically according to the location of the mutation along the polypeptide sequence. In each assay the top band of the gel corresponds to protein-bound . The boxes mark concentrations of Trbp111 at which complex formation is half-maximal. The corresponding sites of the mutations and binding affinities relative to the wild-type protein are listed on the right. Arrows indicate mutants with decreased or diminished tRNA binding.
Mutant proteins were subjected to heat treatment at 80°C as a first step in the purification process. This step acted as a test of the structural integrity and stability of mutant proteins. All 15 mutant proteins purified to homogeneity as dimers, as seen by gel filtration analysis. With one exception (mutant protein E45A), all proteins were stable when stored at 4°C for a few weeks after purification. The E45A protein had a tendency to precipitate and showed higher molecular weight species in addition to that corresponding to a dimer (24 kDa) when tested by analytical ultracentrifugation (data not shown). Mutants with altered tRNA-binding affinities were further analyzed by analytical ultracentrifugation and were found to maimtain stable dimeric structures (data not shown).
Each mutant protein was tested for binding to E.coli  by gel mobility shift assay as described by Morales et al. (1999) (Figure 6). At first, each protein was tested at six different concentrations that spanned the value of the dissociation constant Kd for the wild-type protein (30 nM). Those that showed no significant difference from the wild-type protein were not studied further. Those that had significantly lower apparent dissociation constants than that of wild-type Trbp111 were then re-tested over a higher range of protein concentration (which included at least six different concentrations). This procedure enabled us to obtain an estimate of the Kd, which was then verified by a duplicate analysis, again using at least six different protein concentrations.
The greatest effect of an alanine substitution was seen with the M85A and S82A mutants, which had 66- and >200-fold lower estimated affinities for , respectively. The K33A mutation increased the dissociation constant to Kd = 500 nM (16-fold), while the E45A mutation increased it to 250 nM (8-fold). Finally, mutating either N71 or R75 to alanine lowered the affinity of the mutant protein to Kd = 250 (8-fold) and 750 nM (25-fold), respectively. None of the other positions that were substituted had a significant effect on tRNA binding (Figure 6).
In the Trbp111 crystal structure, residues most sensitive to mutation, S82, M85 and R75, together with N71, are part of the inside lining of the cleft observed between the β-barrel and the dimerization domain (Figure 7). While M85 is buried at the bottom of the cleft, N71, R75 and S82 are all solvent exposed and reside in loop L6. Similarly, K33 is on the surface, located in loop L2. Both loops protrude from the OB-fold core and form a rim around the cleft. Only E45, which affects tRNA binding to a lesser extent, is located outside the cleft (at the beginning of strand β3).

Fig. 7. Stereo view of a Cα trace of the Trbp111 dimeric structure with all single site mutations described in Figure 6 highlighted in ball-and-stick representation. Side chains of residues found to be important in tRNA binding are in black (on the top side of the dimer) and are labeled. Residues at which an alanine substitution did not correlate with a measurable effect on tRNA binding are shown in gray (bottom side of the dimer). Loops L2 and L6 are indicated. The figure was made with MOLSCRIPT (Kraulis, 1991).
The two clefts present in the dimer (one from each monomer) are located on one face of the oblate dimeric structure (top side as shown in Figure 7). In contrast, ‘silent’ residues, R18, K21, R27, K36, R46, R54, K64, K65 and R102, are located on the opposite face of the dimer (bottom side in Figure 7). K14 (located in helix α1 on the top side) is the only exception. K14 and R102 are both involved in side chain interactions at the dimer interface (Figure 1C). Mutation of either did not affect tRNA binding. These mutations also did not disrupt the dimeric structure (see above).
Prediction of tRNA binding mode
A model of the complex between the dimeric structure of Trbp111 and tRNA was built using computational methods (Katchalski-Katzir et al., 1992). The coordinates of the E.coli homolog and yeast tRNAAsp (PDB entry 2TRA) were employed. In the search for possible docking modes the tRNA was allowed to move freely with respect to the protein. The resulting potential docking models were largely scored on the basis of surface complementarity and electrostatic interactions. The model with the highest docking score shows a tRNA molecule bound to one face of the Trbp111 structure with maximum surface complementarity occurring at the inner lining of the cleft formed by the β-barrel of one monomer and the N- and C-terminal regions of the other monomer (Figure 8). Residues lining this cleft come from both monomers and are highly conserved. As stated above, single site mutations of some of these residues (K33, N71, R75, S82 and M85) resulted in reduced tRNA binding (Figures 6 and 7).
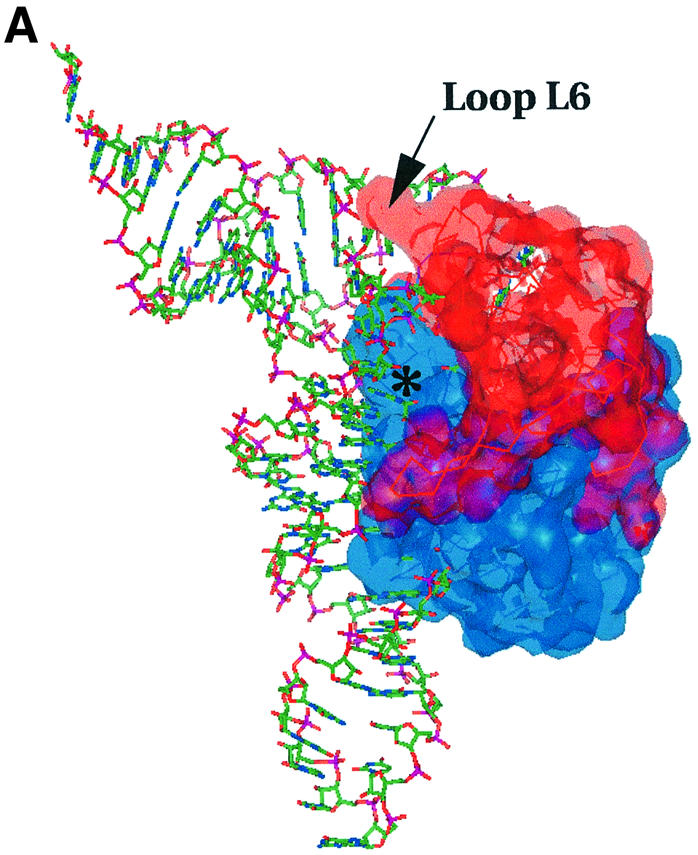

Fig. 8. (A) Highest score docking model of the Trbp111–tRNA complex showing surface complementarity and tRNA binding mode. The protein dimer is shown in a Connolly surface representation (generated in the program InsightII; Molecular Simulations, San Diego, CA) of all non-hydrogen atoms, superimposed on a Cα trace. The monomers are shown in different colors. tRNA is shown as sticks. The asterisk denotes the observed cleft (putative tRNA-binding site). Loop L6 is also labeled. (B) Side view of (A) looking down the tRNA acceptor stem helix. The surface electrostatic potential on the Trbp111 dimer is shown. Positive charge potential is shown in blue and negative charge potential in red. The surface is superimposed on a ribbon diagram of the protein. The tRNA is shown in green as a ribbon through the backbone phosphate groups.
In this model, loop L6 from the OB-fold inserts between the D and TψC loops at the outside corner of the tRNA (Figure 8A). As seen from the mutagenesis experiments, residues in this loop are highly sensitive to alanine substitutions in tRNA-binding assays. Also, tRNA footprint analysis showed that the outside corner of L is protected upon binding of Trbp111 (our unpublished observations). Thus the best docking arrangement is consistent with the results of mutagenesis.
Furthermore, the electrostatic potential distribution of the Trbp111 surface shows areas of positive charge surrounding the cleft region and the tRNA backbone (Figure 8B). This suggests a binding mode driven by general electrostatic interactions with the tRNA phosphate backbone, accompanied by surface complementarity with the cleft.
The docking model is consistent with the 2:1 (Trbp111:tRNA) complex observed by sedimentation equilibrium analysis in solution as described previously (Morales et al., 1999). There are two symmetrically related, identical clefts on the Trbp111 dimer. Assuming equal tRNA binding, and identical binding interactions, both clefts could in principle act as tRNA binding sites. However, when modeling of a second bound tRNA is attempted, severe steric clashes of the adjacent tRNA molecules occur. Thus, only one of the two potential sites on the protein may be occupied at a time.
The mutagenesis analysis does not allow assessment of whether or not tRNA binding is dependent upon dimer formation. All of the investigated mutant proteins were dimeric, including those with diminished tRNA binding. Because the dimer interactions are primarily between backbone atoms, designing mutations that cause a disruption of the dimer may prove difficult. However, the data and analysis presented here support the conclusion that the dimer is required for tRNA binding.
Discussion
The work presented here suggests that although the Trbp111 monomer is constituted largely of the OB-fold found in many DNA- and RNA-binding proteins, it is the unique quaternary structure that confers its unique tRNA binding properties. The dimer offers a putatively novel mode of tRNA binding that utilizes a common fold and dimerization interactions to form a flexible binding cleft for structure-specific recognition of a single tRNA.
Another example of a dimeric RNA-binding protein in which the dimeric structure is essential for RNA recognition is the influenza virus NS1 protein (Wang et al., 1999). The six-helical fold of this protein is held together by a buried hydrophobic center and several intermolecular electrostatic interactions. It is believed to interact with the phosphate backbone of one double-stranded RNA molecule at two symmetrically positioned clusters of solvent-exposed basic residues. In contrast, the tRNA-binding epitope on Trbp111 seems to be asymmetrical.
Although tRNA-modifying enzymes interact specifically with tRNA, some were found to act on minihelices or rRNA and some to require specific nucleotide sequences for recognition. For example, tRNA-guanine transglycosylase modifies tRNAs specific for Asn, Asp, His and Tyr with a minimum requirement for recognition of a UGU sequence in a 7 base anticodon loop (Curnow and Garcia, 1995).
A somewhat structure-specific tRNA-binding protein is the translation elongation factor (EF-Tu in prokaryotes or EF-1α in eukaryotes), which participates in the transport of aminoacyl-tRNAs to the ribosomal A-site for translation of mRNA (Nissen et al., 1995). Like Trbp111, EF-Tu specifically recognizes common features of various aminoacyl-tRNAs. However, it is different from Trbp111 in that it can recognize isolated minihelices based on the tRNA acceptor TψC stem, while Trbp111 requires the intact L shape and does not interact with minihelices (Morales et al., 1999). EF-Tu recognizes tRNA at two locations: the CCA end, which is accommodated in a specific binding site on activated EF-Tu, and the TψC helix, which is bound on its side to the surface of a β-barrel domain in a non-sequence-specific way. In this interaction only the backbone of the tRNA is recognized by EF-Tu (Clark and Nyborg, 1997). Thus, EF-Tu is seen to specifically recognize common features in the minihelix domain of all aminoacyl-tRNAs.
A similar principle is probably behind the structure-specific recognition of tRNAs by Trbp111. In this case the overall L-shape is recognized at the outer corner via large-scale backbone interactions with positively charged protein surfaces, using specific features or substructures found only in tRNA. These features can be accommodated by a narrower, more specific cleft, as the docking model shows.
The structure-specific recognition of the aminoacyl minihelix domain by EF-Tu is an essential interaction of the translation apparatus. Several lines of evidence suggest that the minihelix domain is the historical, more primitive part of the tRNA (Weiner and Maizels, 1987; Schimmel et al., 1993; Maizels and Weiner, 1994). It is possible that the interaction of Tu with the aminoacyl minihelix represents one of the early structure-specific RNA–protein interactions. Similarly, the ancient Trbp111 domain may have evolved in early living systems to assist in the assembly of modern tRNAs from primordial RNA structures that represented the minihelix and the emerging anticodon-containing domain. (A goal of future work is to test whether Trbp111 can bring together the isolated tRNA domains, which individually do not bind Trbp111, when they are mixed with each other.) The subsequent incorporation of Trbp111 as a recurrent module in larger proteins imparted or facilitated functions such as aminoacylation. It also linked tRNA binding and protein synthesis to other cellular events, including those associated with signal transduction pathways (cf. Wakasugi and Schimmel, 1999). Thus, the structure reported here demonstrates that the widespread distribution of the Trbp111 domain comes from the remarkable versatility of the OB-fold and its capacity to imbed into the framework of many different proteins and thereby carry out and connect together diverse cellular functions.
Materials and methods
Preparation of wild-type and mutant Trbp111
Wild-type A.aeolicus Trbp111 for crystallization and biochemical assays was purified from TG1 cells (Amersham, Arlington Heights, IL) containing plasmid pTrbp111 as described in Morales et al. (1999). Point mutants in the gene for Trbp111 were constructed by PCR mutagenesis using two complementary DNA oligonucleotides containing the desired mutation according to the QuickChange site-directed mutagenesis method (Stratagene, La Jolla, CA). Following 18 cycles of PCR amplification, the reaction was incubated with Dpn1 to nick the plasmid DNA. The reaction mixture was then purified on a QiaQuick (Qiagen, Santa Clarita, CA) column and introduced into E.coli XL1-blue cells (Stratagene) by heat shock transformation. Candidates bearing mutations were sequenced by automated methods to detect the desired substitution and to confirm that the remaining sequence was that of the wild-type gene.
Wild-type and mutant A.aeolicus Trbp111 were expressed in E.coli and purified by heat precipitation of cell extracts as described previously (Morales et al., 1999). The PCR-amplified coding sequence for the E.coli homolog was cloned into the PET21b vector (Novagen, Madison, WI) so as to fuse a sequence encoding a His6 tag to the C-terminal end of the Trbp111 coding sequence. The protein was expressed and then purified using Ni-NTA affinity chromatography followed by RNase digestion to remove contaminating nucleotides. Finally, ion exchange chromatography was performed on a 10/10 MonoQ column (Pharmacia, Piscataway, NJ) to achieve the desired purity. The average yield from a 200 ml initial culture volume was 0.5–1 mg of pure protein (95% purity as estimated by SDS–PAGE).
Assay for binding of tRNA
Binding of wild-type and mutant Aa-Trbp111 to tRNA was assessed using a gel mobility shift assay as described previously (Morales et al., 1999). Briefly, protein samples at increasing concentrations were incubated with 5′-32P-labeled (1 nM) for 20 min in a buffer solution (20 µl) consisting of 0.5× Tris–borate, 0.0001% Triton X-100 and 5 mM MgCl2. A solution (10 µl) containing 40% sucrose and tracer dyes was added and aliquots (15 µl) were then loaded onto a 1.5 mm thick, 10% 19:1 acrylamide:bis-acrylamide native gel (Hoefer SE260 apparatus; Hoefer Scientific, San Francisco, CA). The gel was run at 19 mA for 3 h at 4°C and dried for 120 min onto filter paper in a vacuum drier at 80°C. Free and protein-bound tRNA were visualized on a PhosphorImaging screen for 12–16 h and the image developed using a PhosphorImager SI apparatus (Molecular Dynamics, Sunnyvale, CA).
Multivariate analysis of protein sequences
A multiple sequence alignment using the program Clustal_X (Thompson et al., 1997) was constructed using 53 sequences identified in genomic databases with high sequence similarity to Trbp111. The sequences included eukaryotic Trbp111-homologous proteins, such as Arc1p, EMAPII and the C-terminal domain of human TyrRS, as well as the C-terminal region of prokaryotic and archael MetRS. The alignment was then subjected to multivariate analysis adapting the method of Ortiz and Skolnick (2000).
Crystallization and X-ray data collection
Crystals of A.aeolicus Trbp111 were grown from 30% PEG 2000, 0.24 M ammonium sulfate, 0.1 M imidazole pH 7.2 and 24 mg/ml protein. The same crystals were grown previously using different conditions and were partially analyzed (Morales et al., 1999). Crystals of the E.coli homolog were grown from 20–25% PEG 1000, 0.9–1.2 M ammonium acetate, 0.1 M imidazole pH 7.0 and 10 mg/ml protein. All crystals were obtained using the vapor diffusion method in a hanging- or sitting-drop setup at 17°C. Heavy atom derivatives of crystals of the E.coli homolog were prepared by direct soaking of native crystals in solutions containing 30% PEG 1000, 1.0 M ammonium acetate, 0.1 mM Tris pH 7.2 and either 0.5 mM mercuric acetate, 20 mM K2PtCl4 or 2 mM trimethyl lead acetate for 12, 24 and 30 h, respectively.
For the E.coli homolog, X-ray data from flash frozen native and heavy atom derivatized crystals were collected on a MAR345 imaging plate (MAR USA, Evanston, IL) using rotating anode X-rays. A 1.87 Å resolution, native dataset and an additional 1.9 Å multi-wavelength dataset from a Pt derivative were collected at the Stanford Synchrotron Radiation Laboratory (SSRL) (beamlines 7-1 and 9-2, respectively). For the A.aeolicus protein, 2.5 Å resolution native data were collected from a flash frozen crystal on a MAR345 imaging plate at SSRL (beamline 7-1). All X-ray data were processed with Denzo and scaled using Scalepack of the HKL package (Otwinowski and Minor, 1997).
Structure determination and refinement
The crystal structure of the E.coli homolog of Trbp111 was determined using a combination of MAD and MIRAS as follows. Initial heavy atom positions from MIRAS (Hg, Pt and Pb) and MAD (Pt) data were determined independently using SOLVE (Terwilliger and Berendzen, 1999; http://www.solve.lanl.gov) and their parameters partially refined using data to 3.0 Å resolution. Five major heavy atom sites were identified in the MIR solution; two of the sites are the same Pt sites found in the MAD solution. Heavy atom parameters for the two Pt MAD sites were further refined in the SHARP maximum likelihood phasing program (de la Fortelle and Bricogne, 1997) using MAD data in the resolution range 35–2.0 Å, and MAD phases were then calculated (Table I). Heavy atom positions, anisotropic b-factors and occupancies of all five MIR sites were further refined in SHARP.
In the course of the maximum likelihood refinement of MIR heavy atom parameters, the Pt MAD phases were used as refinement constraints (external phases in SHARP). In the final phase calculation in SHARP the MIRAS and MAD phases were combined and used to phase the native dataset in the resolution range 20–2.0 Å. After density modification and phase extension to 1.87 Å, using 40 cycles (with similar results using 120 cycles) of solvent flipping in SOLOMON (Abrahams and Leslie, 1996) and 39% solvent content, the overall figure of merit at 1.87 Å increased from 0.54 to 0.95, at which point the electron density map was excellent.
The 1.87 Å map was auto-traced in the program ARP/wARP (Perrakis et al., 1999) using 100 cycles of automatic building in a conservative mode, resulting in an initial model that accounted for 75 residues (of the total of 119 including residues of the His tag) in four polypeptide chains of connectivity index 0.88. Side chains for these 75 residues were automatically built using the side_dock feature of ARP/WARP, with a confidence level of 35%. Rigid body and positional refinement of this initial model, performed in the program Crystallography and NMR Systems (CNS) (Brünger et al., 1998), reduced the crystallographic R-factor from 44 to 20.4% (R-free from 43 to 35%). The model was completed with several rounds of manual model building in the program O (Jones and Kjelgaard, 1992) and simulated annealing refinement in CNS. Solvent molecules were built and refinement continued using data in the resolution range 20–1.87 Å.
The crystal structure of A.aeolicus Trbp111 was determined by molecular replacement (MR) using the structure of the E.coli protein as an initial search model. The two proteins exhibit 27 and 53% sequence identity and similarity, respectively (Figure 2B). The initial search model was constructed by changing 52 residues in the model of the E.coli protein to alanine. A self-rotation search in CNS (Brünger et al., 1998) revealed four molecules in the asymmetrical unit, related by two mutually perpendicular non-crystallographic 2-fold axes that rendered the crystal symmetry very close to C222, as described previously (Morales et al., 1999; the β angle in the C2 crystals of A.aeolicus Trbp111 varies between 92 and 95°, depending on freezing conditions). Rotation and translation searches were conducted in CNS using data in the range 20–3.5 Å. A real space rotation search, followed by Patterson correlation refinement, resulted in four rotation function solutions corresponding to the four molecules in the asymmetric unit and related by non-crystallographic symmetry (NCS) operations.
An initial translation search was done with one molecule in the range x = 0–0.5, y = 0–0.5 and z = 0–1 along the unit cell axes. The NCS 2-fold rotation operation around the x-axis was applied to the top solution, followed by another translation search, fixing the position of the first molecule and refining each as a rigid body. The top solution from this translation search was subjected to the NCS 180° rotation around the z-axis and a third translation search conducted with the first two molecules fixed in position. At this stage the crystallographic and free R-factors for 20–3.3 Å data were 41 and 44%, respectively.
Phase improvement was conducted using density modification by solvent flipping and density truncation (Read, 1997) without phase extension. Experimental amplitudes (20–3.3 Å data) and phases calculated from the first translation solution model were used in a solvent flipping calculation in CNS while including NCS averaging and a solvent content of 65%. A 2Fo – Fc (3.3 Å) map was then calculated and inspected in the program O (Jones and Kjelgaard, 1992). Structure determination proceeded in four alternating rounds of manual model rebuilding and NCS restrained refinement (Brünger et al., 1998), while including higher resolution data in increments of 0.2 Å. To remove model bias, a composite [σA-weighted simulated annealing (SA), cross-validated] omit map was calculated and inspected. The map covered the entire asymmetrical unit and was assembled from 11 SA omit maps, each calculated for an omitted region of 40 residues (9% of the model, 10 residues from each of the four molecules in the asymmetric unit). Fitting of solvent molecules proceeded using Fo – Fc maps, followed by SA refinement in CNS. During solvent fitting and refinement, NCS restraints were removed for residues in loops L2 (R28–L34), L4 (G51–T67), L6 (N71–G84), L8 (G92–E93) and L9 (D103–G107).
Modeling of the Trbp111–tRNA complex
For the docking of tRNA to A.aeolicus Trbp111 an exhaustive search of a discretized conformational space was used (as implemented in the program ftdock; Gabb et al., 1997). The method takes advantage of the fast Fourier transform to search the translational space of two rigidly rotated molecules. Docking orientations were scored according to their surface complementarity, following the approach developed by Katchalski-Katzir et al. (1992). Default parameters were used in the construction of the grid, yielding a cubic grid with 2.51 Å spacing. Euler angles were sampled in 20 or 9° steps and the best five scores were saved for each scan. The scoring function combined surface complementarity and electrostatic interactions using default parameters, as implemented in ftdock. The 10 best scoring configurations were saved for further analysis and visualization. Finally, the saved conformations were re-scored using the known experimental data from mutagenesis (this work) and tRNA footprint (our unpublished observations) analyses.
Acknowledgments
Acknowledgements
We thank Dr Xiaoping Dai for help with X-ray data collection, Marc Elsliger for assistance with computer software and Drs Tyzoon Nomanbhoy and Robert Turner for insightful discussions. This work was done partially at the SSRL, which is operated by the Department of Energy, Office of Basic Energy Sciences. The SSRL Biotechnology Program is supported by the National Institutes of Health, National Center for Research Resources, Biomedical Program and by the Department of Energy, Office of Biological and Environmental Research. This work was supported by grants GM15539 and GM23562 from the National Institutes of Health and by a fellowship from the National Foundation for Cancer Research.
Note added in proof
Kim et al. (J. Biol. Chem., 275, 27062–27068, 2000) recently reported the crystal structure of the human cytokine EMAP II. This structure bears similarity to the structures reported here, although its tRNA binding site remains undetermined. Also it is not known whether RNA binding by EMAP II is structure specific.
References
- Abrahams J.P. and Leslie,A.G.W. (1996) Methods used in the structure determination of bovine mitochondrial F1 ATPase. Acta Crystallogr. D, 52, 30–42. [DOI] [PubMed] [Google Scholar]
- Berthet-Colominas C., Seignovert,L., Hartlein,M., Grotli,M., Cusack,S. and Leberman,R. (1998) The crystal structure of asparaginyl-tRNA synthetase from Thermus thermophilus and its complexes with ATP and asparaginyl-adenylate: the mechanism of discrimination between asparagine and aspartic acid. EMBO J., 17, 2947–2960. [DOI] [PMC free article] [PubMed] [Google Scholar]
- Björk G.R., Ericson,J.U., Gustafsson,C.E.D., Hagervall,T.G., Jönsson,Y.H. and Wikström,M. (1987) Transfer RNA modification. Annu. Rev. Biochem., 56, 263–287. [DOI] [PubMed] [Google Scholar]
- Brünger A.T. et al. (1998) Crystallography and NMR system: a new software suite for macromolecular structure determination. Acta Crystallogr. D, 54, 905–921. [DOI] [PubMed] [Google Scholar]
- Bycroft M., Hubbard,T.J.P., Proctor,M., Freund,S.M.V. and Murzin,A.G. (1997) The solution structure of the S1 RNA binding domain: a member of an ancient nucleic acid-binding fold. Cell, 88, 235–242. [DOI] [PubMed] [Google Scholar]
- Clark B.F.C. and Nyborg,J. (1997) The ternary complex of EF-Tu and its role in protein biosynthesis. Curr. Opin. Struct. Biol., 7, 110–116. [DOI] [PubMed] [Google Scholar]
- Commans S., Plateau,P., Blanquet,S. and Dardel,F. (1995) Solution structure of the anticodon-binding domain of Escherichia coli lysyl-tRNA synthetase and studies of its interaction with tRNALys. J. Mol. Biol., 253, 100–113. [DOI] [PubMed] [Google Scholar]
- Curnow A.W. and Garcia,G.A. (1995) tRNA-guanine transglycosylase from Escherichia coli—minimal tRNA structure and sequence requirements for recognition. J. Biol. Chem., 270, 17264–17267. [DOI] [PubMed] [Google Scholar]
- Cusack S., Yaremchuk,A. and Tukalo,M. (1996) The crystal structures of T.thermophilus lysyl-tRNA synthetase complexed with E.coli tRNALys transcript: anticodon recognition and conformational changes upon binding of a lysyl-adenylate analogue. EMBO J., 15, 6321–6334. [PMC free article] [PubMed] [Google Scholar]
- de La Fortelle E. and Bricogne,G. (1997) Maximum-likelihood heavy-atom parameter refinement in the MIR and MAD methods. Methods Enzymol., 276, 472–494. [DOI] [PubMed] [Google Scholar]
- Eiler S., Dock-Bregeon,A.C., Moulinier,L., Thierry,J.-C. and Moras,D. (1999) Synthesis of aspartyl-tRNAAsp in Eschericha coli—a snapshot of the second step. EMBO J., 18, 6532–6541. [DOI] [PMC free article] [PubMed] [Google Scholar]
- Gabb H.A., Jackson,R.M. and Sternberg,M.J.E. (1997) Modeling protein docking using shape complementarity, electrostatics and biochemical information. J. Mol. Biol., 272, 106–120. [DOI] [PubMed] [Google Scholar]
- Goldgur Y., Mosyak,L., Reshetnikova,L., Ankilova,V., Lavrik,O., Khodyreva,S. and Safro,M. (1997) The crystal structure of phenylalanyl-tRNA synthetase from Thermus thermophilus complexed with cognate tRNAPhe. Structure, 5, 59–68. [DOI] [PubMed] [Google Scholar]
- Holm L. and Sander,C. (1996) Mapping the protein universe. Science, 273, 595–602. [DOI] [PubMed] [Google Scholar]
- Howard A.J. et al. (1987) The use of an imaging proportional counter in macromolecular crystallography. J. Appl. Crystallogr., 20, 383–385. [Google Scholar]
- Jiang W., Hou,Y. and Inouye,M. (1997) CspA, the major cold-shock protein of Escherichia coli, is an RNA chaperone. J. Biol. Chem., 272, 196–202. [DOI] [PubMed] [Google Scholar]
- Jones T.A. and Kjelgaard,M. (1992) O—The Manual. Uppsala University, Uppsala, Sweden. [Google Scholar]
- Kao J. et al. (1994) Characterization of a novel tumor-derived cytokine. J. Biol. Chem., 269, 25106–25119. [PubMed] [Google Scholar]
- Katchalski-Katzir E., Shavir,I., Eisenstein,M., Friesem,A.A., Aflalo,C. and Vakser,I.A. (1992) Molecular surface recognition: determination of geometric fit between proteins and their ligands by correlation techniques. Proc. Natl Acad. Sci. USA, 89, 2195–2199. [DOI] [PMC free article] [PubMed] [Google Scholar]
- Kraulis P.J. (1991) MOLSCRIPT: a program to produce both detailed and schematic plots of protein structures. J. Appl. Crystallogr., 24, 946–950. [Google Scholar]
- Lee B. and Richard,F.M. (1971) The interpretation of protein structures: estimation of static accessibility. J. Mol. Biol., 55, 379–400. [DOI] [PubMed] [Google Scholar]
- Maizels N. and Weiner,A.M. (1994) Phylogeny from function: evidence from the molecular fossil record that tRNA originated in replication, not translation. Proc. Natl Acad. Sci. USA, 91, 6729–6734. [DOI] [PMC free article] [PubMed] [Google Scholar]
- Merritt E.A. and Bacon,D.J. (1997) Raster3D photorealistic molecular graphics. Methods Enzymol., 277, 505–524. [DOI] [PubMed] [Google Scholar]
- Morales A.J., Swairjo,M.A. and Schimmel,P. (1999) Structure-specific tRNA-binding protein from the extreme thermophile Aquifex aeolicus. EMBO J., 18, 3475–3483. [DOI] [PMC free article] [PubMed] [Google Scholar]
- Murzin A.G. (1993) OB (oligonucleotide/oligosaccharide binding)-fold: common structural and functional solution for non-homologous sequences. EMBO J., 12, 861–867. [DOI] [PMC free article] [PubMed] [Google Scholar]
- Nissen P., Kieldgaard,M., Thirup,S., Polekhina,G., Reshetnikova,L., Clark,B.F.C. and Nyborg,J. (1995) Crystal structure of the ternary complex of Phe-tRNAPhe, EF-Tu, and a GTP analog. Science, 270, 1464–1472. [DOI] [PubMed] [Google Scholar]
- Ortiz A.R., and Skolnick,J. (2000) Sequence evolution and the mechanism of protein folding. Biophys. J., 79, 1787–1799. [DOI] [PMC free article] [PubMed] [Google Scholar]
- Otwinowski Z. and Minor,W. (1997) Processing of X-ray diffraction data collected in oscillation mode. Methods Enzymol., 276, 307–326. [DOI] [PubMed] [Google Scholar]
- Perrakis A., Morris,R.M. and Lamzin,V.S. (1999) Automated protein model building combined with iterative structure refinement. Nature Struct. Biol., 6, 458–463. [DOI] [PubMed] [Google Scholar]
- Quevillon S., Agou,F., Robinson,J.-C. and Mirande,K. (1997) The p43 component of the mammalian multi-synthetase complex is likely to be the precursor of the endothelial monocylte-activating polypeptide II cytokine. J. Biol. Chem., 272, 32573–32579. [DOI] [PubMed] [Google Scholar]
- Read R.J. (1997) Model phases: probabilities and bias. Methods Enzymol., 278, 110–128. [DOI] [PubMed] [Google Scholar]
- Ruff M., Krishnaswamy,S., Boeglin,M., Poterszman,A., Mitschler,A., Podjarny,A., Rees,B., Thierry,J.C. and Moras,D. (1991) Class II aminoacyl transfer RNA synthetases: crystal structure of yeast aspartyl-tRNA synthetase complexed with tRNAAsp. Science, 252, 1682–1689. [DOI] [PubMed] [Google Scholar]
- Schimmel P., Giegé,R., Moras,D. and Yokoyama,S. (1993) An operational RNA code for amino acids and possible relationship to genetic code. Proc. Natl Acad. Sci. USA, 90, 8763–8768. [DOI] [PMC free article] [PubMed] [Google Scholar]
- Schindelin H., Marahiel,M.A. and Heinemann,U. (1993) Universal nucleic acid-binding domain revealed by crystal structure of the B. subtilis major cold-shock protein. Nature, 364, 164–168. [DOI] [PubMed] [Google Scholar]
- Schindelin H., Jiang,W., Inouye,M. and Heiemann,U. (1994) Crystal structure of CspA, the major cold shock protein of Escherichia coli. Proc. Natl Acad. Sci. USA, 91, 5119–5123. [DOI] [PMC free article] [PubMed] [Google Scholar]
- Sette M., van Tilborg,P., Spurio,R., Kaptein,R., Paci,M., Gualerzi,C.O. and Boelens,R. (1997) The structure of the translational initiation factor IF1 from E.coli contains an oligomer-binding motif. EMBO J., 16, 1436–1443. [DOI] [PMC free article] [PubMed] [Google Scholar]
- Simos G., Segref,A., Fasiolo,F., Hellmuth,K., Shevchenko,A., Mann,M. and Hurt,E.C. (1996) The yeast protein arc1p binds to tRNA and functions as a cofactor for methionyl- and glutamyl-tRNA synthetases. EMBO J., 15, 5437–5448. [PMC free article] [PubMed] [Google Scholar]
- Simos G., Sauer,A., Fasiolo,F. and Hurt,E.C. (1998) A conserved domain within Arc1p delivers tRNA to aminoacyl-tRNA synthetases. Mol. Cell, 1, 235–242. [DOI] [PubMed] [Google Scholar]
- Terwilliger T.C. (1994) MAD phasing: treatment of dispersive differences as isomorphous replacement information. Acta Crystallogr. D, 50, 17–23. [DOI] [PubMed] [Google Scholar]
- Terwilliger T.C. and Berendzen.,J. (1999) Automated structure solution for MIR and MAD. Acta Crystallogr. D, 55, 849–861. [DOI] [PMC free article] [PubMed] [Google Scholar]
- Thompson J.D., Gibson,T.J., Plewniak,F., Jeanmougin,F. and Higgins,D.G. (1997) The CLUSTAL_X:Windows interface: flexible strategies for multiple sequence alignment aided by quality analysis tools. Nucleic Acids Res., 25, 4876–4882. [DOI] [PMC free article] [PubMed] [Google Scholar]
- Wakasugi K. and Schimmel,P. (1999) Two distinct cytokines released from a human aminoacyl-tRNA synthetase. Science, 284, 147–151. [DOI] [PubMed] [Google Scholar]
- Wang W., Riedel,K., Lynch,P., Chien,C.-Y., Montelione,G.T. and Krug,R.M. (1999) RNA binding by novel helical domain of the influenza virus NS1 protein requires its dimer structure and a small number of specific basic amino acids. RNA, 5, 195–205. [DOI] [PMC free article] [PubMed] [Google Scholar]
- Weiner A.M. and Maizels,N. (1987) tRNA-like structures tag the 3′ ends of genomic RNA molecules for replication: implications for the origin of protein synthesis. Proc. Natl Acad. Sci. USA, 84, 7383–7387. [DOI] [PMC free article] [PubMed] [Google Scholar]