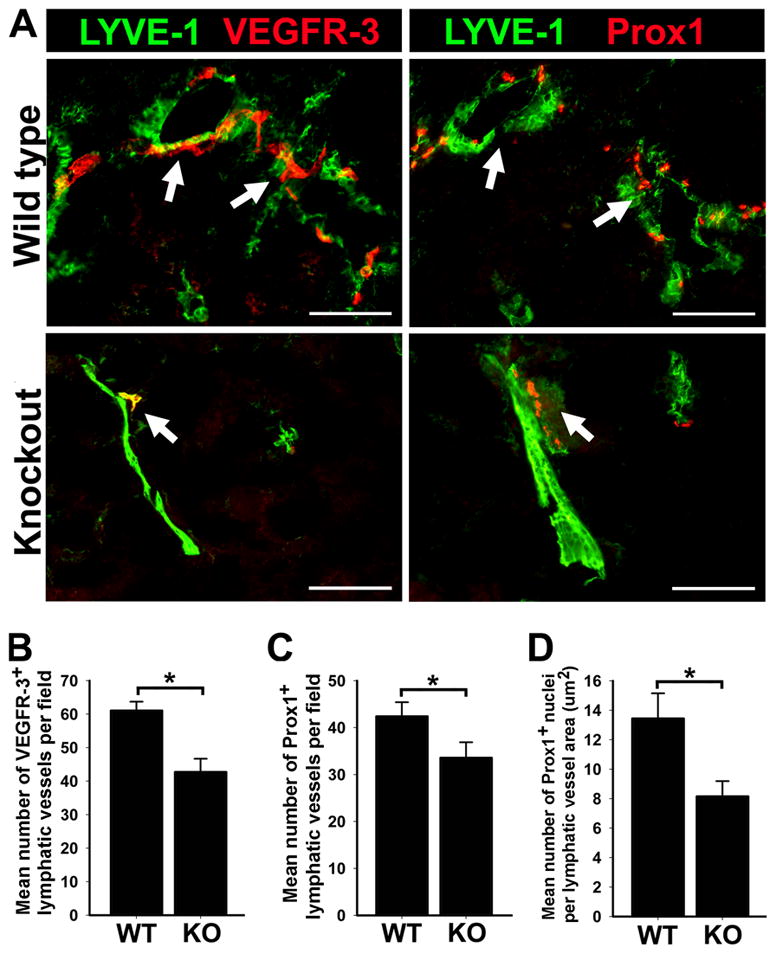
Figure 1.

Decreased lymphatic vessel density and reduced expression of Prox1 and VEGFR-3 in the lungs of p50 KO mice compared with WT. (A) Double immunofluorescent staining with anti-LYVE-1 and anti-VEGFR-3 or anti-Prox1 antibodies in serial sections of p50 KO and WT lungs, showing reduced lymphatic vessel density. Arrows indicate overlapping expression of VEGFR-3 and Prox1 on LYVE-1+ lymphatic vessels on serial sections of p50 KO and WT lungs. Scale bar represents 100 μm. Mean lymphatic vessel density of VEGFR-3 (B) and Prox1 (C) positive vessels was measured from 3 images of p50 KO and WT lungs (n = 5 mice per group) acquired at 200X magnification. Data are presented as the mean vascular area ± SEM. The P values represent *<0.05 and **<0.01 as determined by Student’s unpaired t-test. (D) The number of Prox1 positive nuclei were enumerated in 5 images of p50 KO and WT lungs (n = 3–4 mice per group) acquired at 200X magnification. Density of Prox1 positive nuclei was normalized per LYVE-1 positive lymphatic vessel area (μm2) and is presented as the average number of Prox1 positive nuclei per vessel area ± SEM. The P value represents *<0.05 as determined by Student’s unpaired t-test.
