Abstract
Infrared, Raman, and nuclear resonant vibrational (NRVS) spectroscopies have been used to address the Fe-H bonding in trans-Fe(H)(CO) iron hydride compound, Fe(H)(CO)(dppe)2, dppe = 1,2-bis(diphenylphosphino)ethane. H and D isotopomers of the compound, with the selective substitution at the metal-coordinated hydrogen, have been considered in order to address the Fe-H/D stretching and bending modes. Experimental results are compared to the normal mode analysis by the density functional theory (DFT). The results are that (i) the IR spectrum does not clearly show Fe–H stretching or bending modes; (ii) Fe–H stretching modes are clear but weak in the Raman spectrum, and Fe–H bending modes are weak; (iii) NRVS 57Fe spectroscopy resolves Fe-H bending clearly, but Fe–H or Fe–D stretching is above its experimentally resolved frequency range. DFT caclulations (with no scaling of frequencies) show intensities and peak locations that allow unambigous correlations between observed and calculated features, with frequency errors generally less than 15 cm−1. Prospects for using these techniques to unravel vibrational modes of protein active sites are discussed.
1 Introduction
Molecular hydrogen plays an important role in the metabolism of numerous aerobic and anaerobic microorganisms. The evolution or consumption of H2 in nature is performed by a family of enzymes, known as hydrogenases, by catalyzing H2/H+ interconversion reactions.1 These enzymes are more efficient catalysts than platinum, which is used in industry to catalyze hydrogenation. The studies of the structure and catalytic mechanisms of hydrogenases is not only due to the curiosity of human to the nature, but also may prove crucial for finding new H2-activating catalysts with low cost, high efficiency and stability to help utilize H2 as a clean renewable energy currency, known as the “hydrogen economy.”
There are three known types of hydrogenases: [NiFe]-hydrogenase (in bacteria and archaea), [FeFe]-hydrogenase (in bacteria and eukaryotes),1,2 and Hmd hydrogenase – formally named H2-forming methylenetetrahydromethanopterin (methylene-H4MPT) dehydrogenase.3 Recently, Shima et al. reported the crystal structure of Hmd hydrogenase.4 Although, the three hydrogenases are not phylogenetically related, a common feature of the active sites is that they all contain a low-spin, nonredox-active iron ligated by at least one CO.3 The function of the low-spin iron is thought to polarize H2 so that it can be subject to electrophilic attack by the redox-active transition metals (Ni in [NiFe]-hydrogenase, and a second Fe in [FeFe]-hydrogenase) or the carbocation (C14 of methenyl-H4MPT+ in Hmd hydrogenase). The presence of CO ligand(s) is thought to tune the electrophilicity of the low-spin iron in trans-position to the potential H2-binding site for optimal heterolytic cleavage.5 In addition, all three hydrogenases can be inhibited by extrinsic CO.
Another important metal ligand of the active centers of all three types of hydrogenases in the key catalytic states is hydride (H−). The previous ENDOR6,7 and HYSCORE7,8 studies on [NiFe]-hydrogenase showed that a bridging H− was identified between Fe and Ni centers in the activated enzyme upon long time incubation with H2.9 In [FeFe] hydrogenase, the identification of H− ligand is less successful. A terminal H− on the distal Fe of the 2Fe subunit of the H-cluster of the enzyme and a bridging hydride between the two Fe of the 2Fe subunit have been proposed.9 In Hmd hydrognease, a terminal H− ligand on the iron center has been proposed based on DFT calculations.10
In the past several decades, numerous structural and functional model compounds of the active sites of these three types of hydrogenases have been synthesized and characterized by various spectroscopic methods.11 These model compounds and the chemistry associated with them played an important role in helping us understand the catalytic mechanisms in the enzyme systems.
In an earlier study we reported the detailed spectroscopic characterization on a model compound, Fe (S2C2H4)(CO)2(PMe3)2 using nuclear resonance vibrational spectroscopy (NRVS), IR and Resonance Raman as well as density functional quantum calculations.12 This compound contains a cis-(CO)2 moiety and sulfur ligands similar to the iron center structure in Hmd hydrogenase. The results from this model compound study have then been used to interpret the NRVS spectra obtained from Hmd hydrogenase. The study showed that the combination of several vibrational spectroscopic techniques together with DFT calculations is a powerful tool to illustrate the bonding interactions between iron and surrounding ligands in model compounds, and further facilitate the identification of iron ligands in protein molecules.
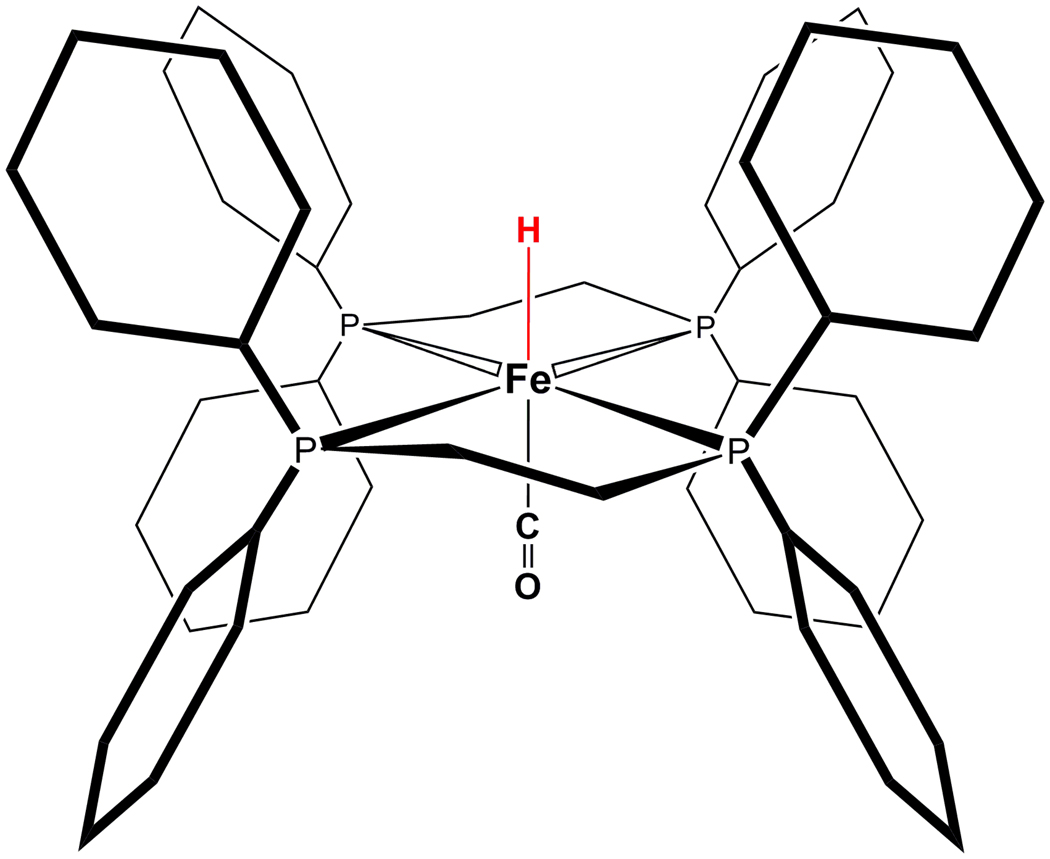
In this paper, we use several vibrational spectroscopic techniques together with DFT calculations to study an iron carbonyl hydrido compound – [HFe(CO)(dppe)2](BF4) (1, Fig. 1). Our focus is to identify Fe–H vibrational interactions in this compound. The same compound with different anion has been reported earlier by Landau et. al.13 The compound has a FeCO moiety with a H- ligand trans to CO. This is a good structural model compound mimicking the possible terminal H- binding to the Fe sites of [FeFe] hydrogenase and Hmd hydrogenase. We used NRVS, IR, Raman spectroscopy in connection to DFT calculations to identify the Fe-H stretching mode and H-Fe-CO bending modes on 1 and its deuterated version, 1-D. The implication of the results of this work to the hydrogenase enzyme studies will be discussed.
Figure 1.
Structure of [Fe(H)(CO)(dppe)2]+, or 1.
2 Results
2.1 NRVS, IR and Raman Spectra
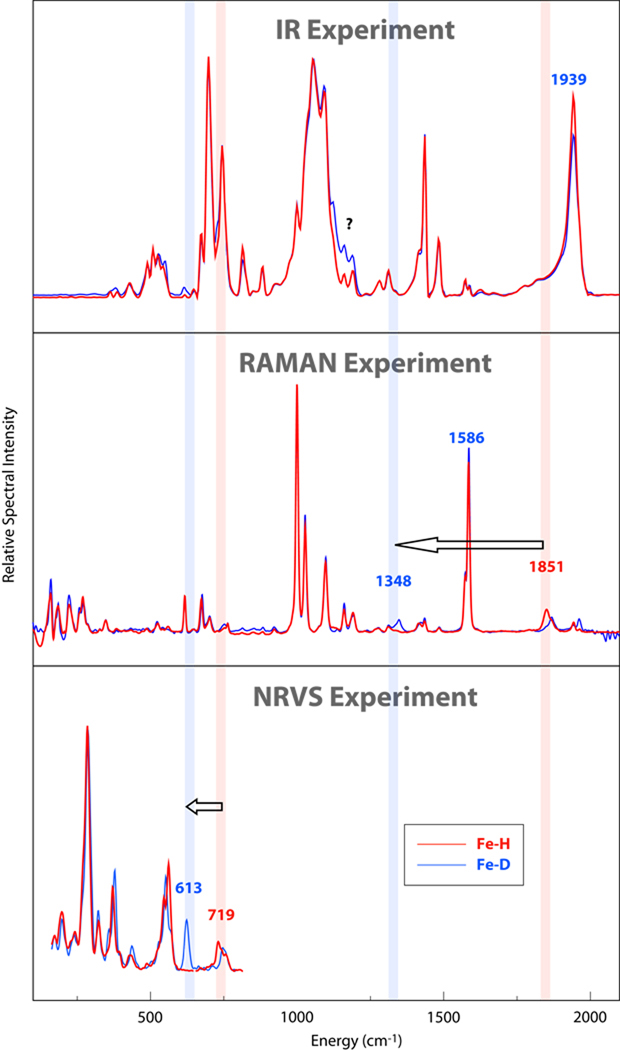
Figure 2 shows the NRVS, FT-IR and FT-Raman spectra of [(H,D)FeCO(dppe)2]BF4. As expected, there is clear evidence of common frequencies in the three spectra, but very large differences in intensities. The “classic” way to identify particular modes, such as those involving the hydride, is to carry out isotopic substitution, and results from both H and D isotopomers are shown in the figure. Key mass-dependent shifts are illustrated by arrows in the figure, but these identifications were made based on arguments presented below, and are clearly not possible just from a casual inspection of the spectra alone. Some tentative assignments can be made based on previous vibrational spectroscopy studies of metal hydride complexes,14–16 but argument by analogy has clear limitations. Here, we will discuss ways in which Fe–H stretching and bending modes can be identified through a combination of different spectroscopies and comparisons to results from quantum chemical calculations. A more detailed account of all of the spectra peaks, including fits using empirical force fields, is given elsewhere.17
Figure 2.
IR, Raman and NRVS spectra for 1 (red) and 1-D (blue). Vertical bars show H/D shifts for important stretching and bending interactions, as discussed in the text.
In the region between 1000 and 2000 cm−1, no NRVS intensity can be detected (because of limitations in this technique), whereas many features are observed in IR and Raman spectra. In the IR spectra, both isotopomers give almost identical spectral features, showing only small intensity differences between 1100 and 1200 cm−1 and at about 1940 cm−1. The feature at ~1940 cm−1 can be assigned to a CO stretching mode, based on extensive studies on metal carbonyl complexes.18 In the Raman spectra, although all the strong features at 1586, 1098, 1028 and 1001 cm−1 show no shifts upon deuteration, other small differences can still be observed. A weak feature is seen at 1851 cm−1 in the Fe–H species which disappears upon deuteration, being replaced by a weak feature at 1348 cm−1. If we assume 1851 cm−1 feature is Fe–H stretching mode, then the shift of this mode due to the isotopic substitution is predicted by a simple diatomic model to be ~530 cm−1 to 1320 cm−1. This suggests that the small feature near 1348 cm−1 feature observed in the deuterated complex may be primarily an Fe–D stretch. Computational support for this assignment will be presented below.
At lower frequencies, one can search for Fe–H bending modes. The NRVS spectrum is the clearest, showing a complex feature with peaks at 719 and 746 cm−1, which changes while a new feature appears at 613 cm−1 upon deuteration. This indeed involves Fe–H bending, as we discuss below. (There is a remaining feature in the deuterated spectrum in this region (730–740) which does not show up in the calculations. As discussed elsewhere,17 the Mossbauer spectrum of both the H and D versions of the complex suggest that only one species is present, and we don’t at present have an understanding of this feature.) No significant isotope shift is observed in the region below 600 cm−1 in either the Raman and IR spectra.
In the 500–600 cm−1 region, the NRVS spectrum shows a feature at 550 cm−1 with a lower energy peak at 533 cm−1, this feature shifts a little to 540 cm−1 with shoulders in both lower and higher energy side in the deuterated spectrum. This feature can be assigned primarily to Fe-C-O bending and Fe-CO stretching modes with Fe-C-O bending mode in higher energy. These modes, and other lower-frequency ones that primarily involve Fe–P motions, are discussed elsewhere.17
2.2 Computed spectra from DFT
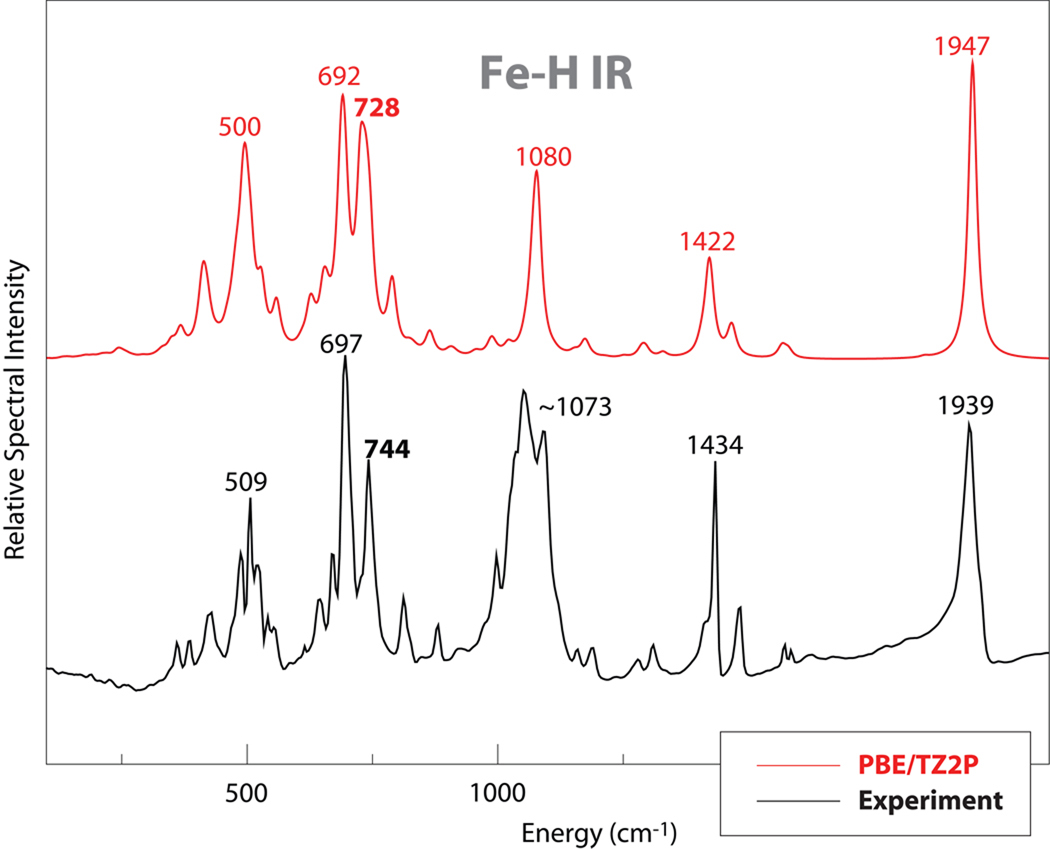
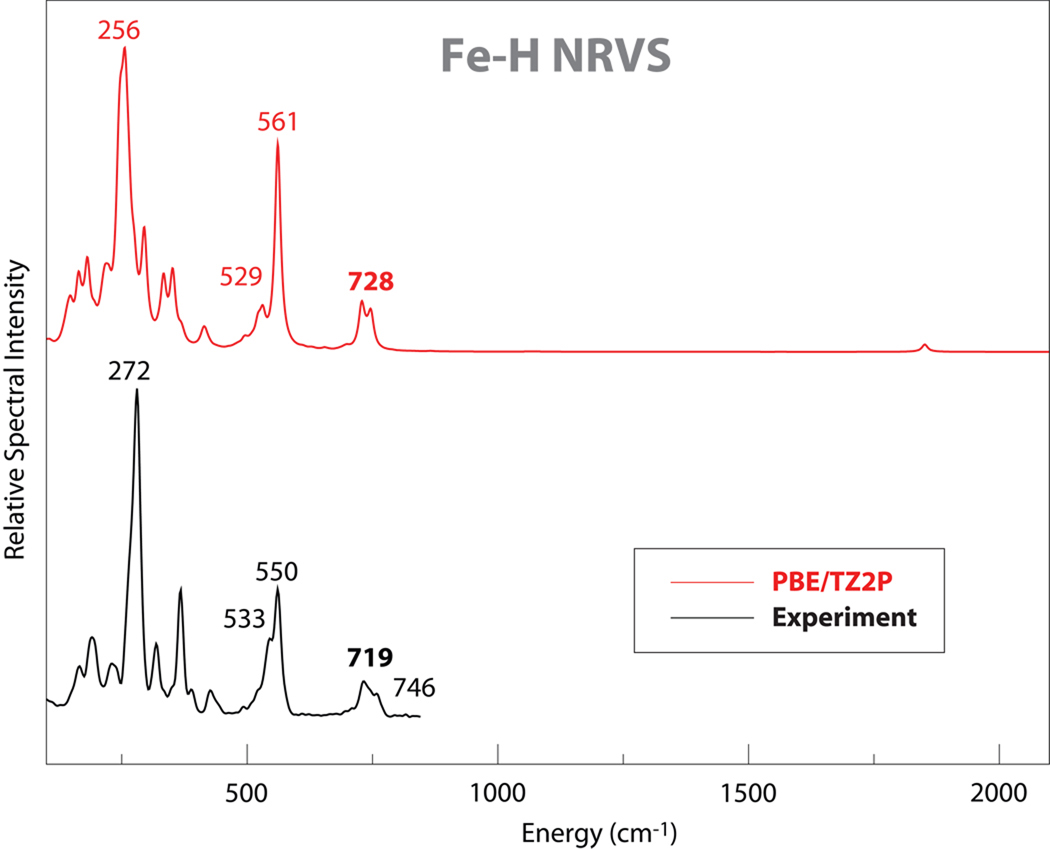
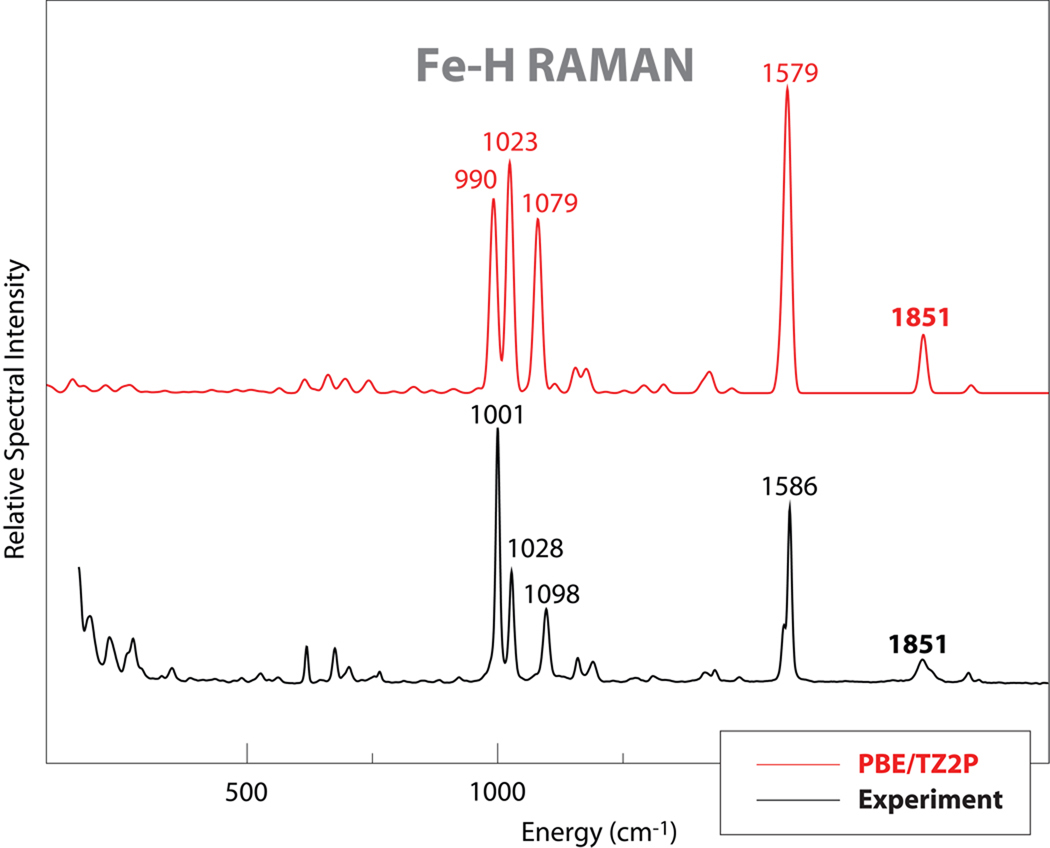
DFT calculations were used to simulate IR, Raman and NRVS spectra, as shown in Fig. 3 to 5. The simulations reproduced the experimental data well, with almost one-to-one peak correspondence, especially for the Raman spectrum simulations. In the IR simulations, the CO stretching mode was calculated at 1947 cm−1 close to the observed peak at 1939 cm−1. A 9 cm−1 down-shift of CO stretching mode was calculated by the DFT simulation upon deuteration; this is not observed in the experimental IR spectra due to the relative broad feature around 1940 cm−1. In the simulated IR spectra, a very weak feature at 1851 cm−1 was calculated as Fe-H stretching mode, and it shifted to ~1327 cm−1 upon deuteration. So there is no doubt that the feature observed at 1851 cm−1 in the Raman is the Fe-H stretching mode.
Figure 3.
Comparison of experimental and DFT results for infrared spectra for 1.
Figure 5.
Comparison of experimental and DFT results for NRVS spectra for 1.
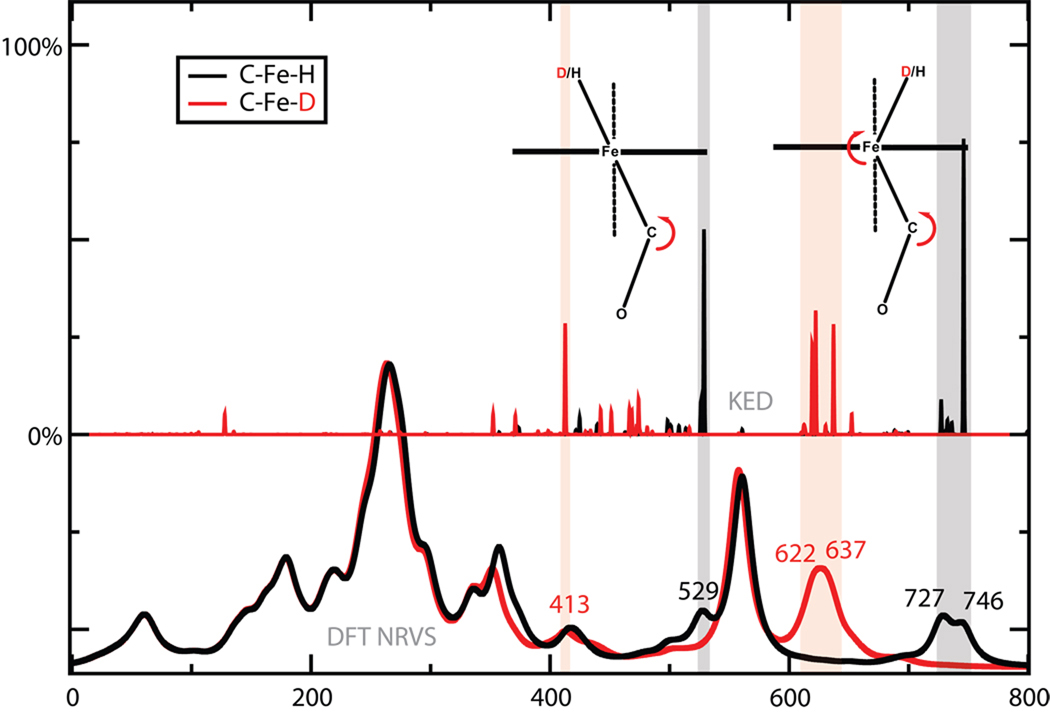
Other iron-hydride modes beyond the Fe–H stretch also help to establish the nature of the bonding around iron. Fig. 6 illustrates again the power of comparisons to DFT results, since the nature of the two bending modes can be clearly seen. In the lower frequency mode at 529 cm−1, the H–Fe–C triplet remains nearly linear, whereas in the higher frequency modes at 727 and 746 cm−1, there is bending about H–Fe–C as well as about the Fe–C–O. NRVS spectra is clearly helpful in identifying these modes, since it allows one to focus on vibrations involving the iron atom. These modes are highly mixed, and the connection to the NRVS experiment is most clear in the higher frequency region, where a new feature near 613 cm−1 appears in the experimental deuterated spectrum and intensity near 719 cm−1 disappears (Fig. 2). This shift is well-matched int the DFT results in Fig. 6, and is similar to an Fe–H bending shift (from 783 to 573 cm−1) reported by Tuczek and co-workers for an FeHN2 complex.14 The lower frequency feature (at 529 cm−1 in the DFT calculation on the H isotopomer) may be the same as a shoulder in the experimental spectrum at the about the same location. There is no obvious correpondence in the experimental spectrum of the deuterated spectrum, which is consistent with a number of peaks in the 400–500 cm−1 range with significant Fe kinetic energy. Although an arrow is shown in Fig. 6, it is probably more correct to say that there is no single “isotope shift” for this bending mode.
Figure 6.
Fe-H (Fe-D) bending modes. Spectra at the bottom are from the DFT calculations, with the H isotopomer in black and D in red. Stick figures show the kinetic energy distribution (KED) from Eq. 3.
In 200–500 cm−1 region, the intensity mainly was derived from Fe-P stretching modes, P-C stretching modes from phenol ring C atoms, and Fe-P-C bending modes from both pdt ligand and phenol ring C atoms in the low frequency end. The strongest PVDOS feature observed at 272 cm−1 was calculated as mainly Fe-P stretching modes in both simulations. All the calculated modes showed little shift upon deuteration, as expected. In the DFT simulation, the calculated features were generally lower in frequency than the experimental spectra. This is probably due to the fact that the Fe-ligand bond distances predicted in the DFT optimized geometric structure are ~ 0.03 Å longer than in the actual crystal structure.17 The intensity in 100–200 cm−1 mainly derived from Fe-P-C bending, P-Fe-P bending and C-Fe-P bending modes.
3 Discussion
In addition to their biochemical interest, the computed and observed vibrational spectra analyzed here provide and instructive example of how alternate spectroscopies, isotopic substitution, and electronic structure calculations can be used in concert to assign peaks and analyze vibrational motion. Perhaps the mode of greatest interest is the Fe–H stretch, since its frequency is expected to be directly related to the length and strength of the iron–hydride bond. This peak is outside the frequency range of NRVS spectra, and has essentially no intensity in the infrared spectrum. A very weak feature can be seen in the Raman spectrum at 1851 cm−1, but it would in fact be difficult to use this for an unambiguous assignment.
The “classic” way to confirm such an assignment is by isotope substitution, and one can indeed see a small feature in the Raman spectrum at 1348 cm−1, shifted by the expected amount. But this is still quite a weak feature, and relies on having a “clean” spectrum in the relevant regions. Here is where computational methods can play a real role. DFT calculations (here at the PBE TZ2P/TZ2P+ level, with no scaling) reproduces experimental results very well. The deviation between the experiment and DFT does not exceed ~15 cm−1 and commonly much less. Since the nature of the modes is clear in the calculation, and since it is easy to use frequencies and intensities to correlate observed and calculated peaks, the identification of the Fe–H stretch is now completely straightforward. The calculations don’t include anharmonic corrections, and have the usual limitations arising from the use of approximate functionals and limited one-particle basis sets; hence numerical agreement of any particular peak with the observed one may involve some cancellation of errors. But as long as the correlation of observed and calculated peaks is as clear as what is seen here, the benefits of a straightforward DFT calculation, with a large but accessible basis set, seem clear.
The analysis of hydride modes in iron-hydride complexes similar to this one has a long history.14,19–22 In similar compounds, the Fe–H stretching frequency ranges from 1800 to 2000 cm−1, and Fe–H distances from 1.4 to 1.6 Å. These high frequencies place the stretching modes outside the range of NRVS spectroscopy, but the results presented here show that bending modes can be intensified and assigned (both by isotopic substitution and by computation), in accord with earlier NRVS studies on high-spin iron complexes. 15 A key question regards the ability to identify such modes in the much more crowded, and possibly heterogeneous environment found in metalloproteins. Our previous report on a non-hydride state of Hmd hydrogenase and its comparison to a model compound12 is encouraging in this respect, as are comparisons of proteins and model complexes in nitrogenase23 and ferredoxins.24,25
The successful identification of Fe-H vibrations in [HFe(CO)(dppe)2](BF4) using the combination of three different vibrational spectroscopic techniques together with DFT calculations should enable us to ask the question whether we can identify Fe-H binding in hydrogenase enzymes using the same methodology. Hmd hydrogenase should be the best system to study in the next step due to its relative simple mononuclear Fe center. Recently, a DFT study on Hmd hydrogenase10 proposed that the Fe center has a strong Fe-Hδ-… Hδ+-O dihydrogen bond in the resting state of the enzyme with the presence of H2. Upon arrival of the enzyme substrate – Methenyl-H4MPT+, this dihydrogen bond breaks and a hydride binding to the iron center is formed. Then the hydride is transferred to the substrate and the next H2 cleavage initiates. By combining NRVS and DFT calculations, the identification of this proposed hydride through vibrational information, especially Fe-H bending vibrations, in the Fe center of Hmd hydrogenase should be feasible.
4 Methods
4.1 Synthesis of [HFeCO(dppe)2]BF4
The synthesis of 57Fe-1 starts with the synthesis of 57Fe(Cl)2(dppe)2. A slurry of 57FeCl2 (0.050 g, 0.39 mmol) in benzene (10 mL) was treated with dppe (0.34 g, 0.85 mmol), and the reaction mixture was heated to reflux for 3 h. The tan ferrous chloride dissolved to give a colorless solution, which precipitated a white microcrystalline solid. The reaction mixture was transferred via cannula to an air-free frit, and the solid was washed with hexane (3 × 4 mL). The white solid was dissolved from the frit with thf, and solvent was removed under vacuum. Next, the synthesis of 57FeHCl(dppe)2 was carried out. To a mixture of diphosphine (0.3311 g, 0.8308 mmol) and 57FeCl2 (0.0526 g, 0.411 mmol) in 25 ml of ethanol was slowly added at 50°C in a countercurrent of argon and under vigorous stirring, a solution of sodium borohydride (0.0181 g, 0.432 mmol) in 20 ml of ethanol. The stirring was continued until the precipitate became red (about 90 min), and then the product was filtered, washed with water and with ethanol at 40 °C, dried in vacuo and recrystallized from benzene by adding ethanol. The deuteride was prepared in the same manner from NaBD4. Then, A CO-saturated slurry of 57FeHCl(dppe)2 (0.1331 g, 0.1493 mmol) in acetone (20 mL) was treated with NaBF4 (0.0685 g, 0.624 mmol) to make 57Fe-1.13 The reaction mixture was stirred until no more of red-violet starting material was visible. The resulting yellow solution was filtered away from the insoluble NaCl, and the filtrate was dried under vacuum. The product was purified by reprecipitation by slow addition of Et2O to a CH2Cl2 solution of the salt. Solution IR in CH2Cl2: 1950 (s) cm−1 ([HFeCO(dppe)2]BF4), 1946 (s) cm−1 ([DFeCO(dppe)2]BF4).
4.2 Nuclear resonant vibrational spectroscopy
NRVS is rapidly becoming a popular technique for probing the dynamics of Fe in metalloproteins.26,27 This measurement involves scanning an extremely monochromatic x-ray beam through a nuclear resonance. Apart from the zero phonon recoil-free Mössbauer resonance, there are transitions that correspond to nuclear excitation plus creation (Stokes) or annihilation (anti-Stokes) of phonons. The NRVS intensity for a given normal mode is proportional to the motion of the resonant nucleus j (in this case 57Fe) along the direction of the incident x-ray beam.27,28 For a randomly oriented sample, a NRVS transition for normal mode α contributes a fraction ϕα to the normalized excitation probability that is directly proportional to the Fe mode composition factor and inversely proportional to ν̄α :28,29
| (1) |
In the above equation, ν̄α is the difference between the photon energy and the recoil-free nuclear resonance energy in wave numbers, ν̄R is the recoil energy (~16 cm−1), n̄α = [exp(hcν̄α/kBT) − 1]−1 is the thermal occupation factor for a mode of frequency ν̄α at temperature T,28 and the recoilless fraction f depends on , the mean square fluctuation of the Fe nucleus along the beam direction. It is also useful to define an 57Fe-centered partial vibrational density of states (PVDOS), , using a lineshape function:28,29
| (2) |
The 57Fe PVDOS can be extracted from the raw NRVS using the PHOENIX software package,30 and the Fe mode composition factor for a given eigenvector can be calculated from a normal mode analysis via:28,31
| (3) |
where mi and are the mass of atom i and its mean square motion respectively.
57Fe NRVS spectra were recorded using published procedures32 on multiple occasions at beamline 3-ID at the Advanced Photon Source (APS)33 and at beamline 9-XU at SPring-8, Japan.34 The APS provided ~2.5 × 10⁹ photons/sec in 1 meV bandwidth at 14.4125 keV in a 1 mm (vertical) × 3 mm (horizontal) spot. The APS monochromators consisted of a water-cooled diamond (1,1,1) double crystal monochromator with 1.1 eV bandpass, followed by separate Si(4,0,0) and Si(10,6,4) channel-cut crystals in a symmetric geometry. The flux at SPring-8 was ~3.2 × 10⁹ in a 1.1 meV bandwidth; the monochromators there consisted of a liquid N2-cooled Si(1,1,1) double crystal monochromator, and asymmetrically cut Si(5,1,1) and Si(9,7,5) crystals. During NRVS measurements, samples were maintained at low temperatures using liquid He cryostats. Temperatures for individual spectra were calculated using the ratio of anti-Stokes to Stokes intensity according to S(−E) = S(E)exp(−E/kT). Spectra were recorded between −30 meV and 90 meV in 0.25 meV steps. Delayed nuclear fluorescence and Fe K fluorescence (from internal conversion) were recorded with a single avalanche 1 cm2 square photodiode (APD) at the APS and with an APD array at SPring-8.35 Each scan required about 1 hour, and all scans were added and normalized to the intensity of the incident beam.
4.3 FT-IR spectroscopy
Far and mid-infrared absorption spectra (100 to 2000 cm−1) were recorded at room temperature using a Brüker IFS 66 v/S FTIR spectrometer at 4 cm−1 resolution. The measurements were make using different medium materials, windows, beam splitters and infrared detectors. All the measurements were made using a broadband mid-infrared source inside the FTIR spectrometer. The sample chamber was continuously pumped to < 1 torr during the measurement to minimize the absorption by moisture vapor
For the region of 100–500 cm−1, the sample was prepared as Nujol mulls and mounted in between two polyethylene windows. A 6 micrometer thick mylar beamsplitter (100–550 cm−1) was selected in the FTIR spectrometer and a liquid He cooled Si bolometer was used to collect the infrared signal transmitted through the sample. For the region of 400–700 cm−1, KBr mixture with the sample was pressed and mounted in between polyethylene windows to prevent air from contacting the sample during measurement. A KBr beamsplitter and a liquid He cooled Si bolometer were used to collect the data. The region above 700 cm−1 was measured with KBr press / ZnSe windows / KBr beam splitter / region extended MCT detector (600–2000 cm−1). All the samples were prepared inside a nitrogen glovebox.
4.4 FT-Raman spectroscopy
FT- Raman spectra were recorded in Frei’s Research Lab in LBNL, with a Bruker model FRA-106 spectrometer equipped with a Nd:YAG laser source and with a liquid N2 cooled Ge detector (Canberra). The Nd:YAG laser emits at 1.064 µm (9394.3 cm−1), and has a maximum power of 525 mW. In our particular experiment, a reduced laser power of 50 mW is used to reduced the possibility of the samples from fluorescence and from radiation damage. No sample radiation damage was observed. The resolution is set to 4 cm−1 in agreement with the FTIR measurement on the same samples. The accumulation time is about 6 hours for each sample. The FT-Raman samples were loaded into 100 mm in length 4 mm in diameter quartz tubes inside a nitrogen glovebox (O2< 1 ppm) and were wax sealed. Such sealed tubes were then inserted into a special aluminum sample holder inside the FT-Raman’s sample compartment.
4.5 DFT calculations
The PBE functional36 as implemented in the ADF 2007.01 software, has been presently used for all the calculations. Our tests show that PBE performs very similarly to PW9137,38 which we used previously to simulate NRVS spectra.12 A TZ2P non-relativistic valence triple zeta basis set with two polarization functions was used for all the atoms. An extra d Slater type orbital has been used to describe the iron center, meaning TZ2P+ basis set for Fe. The (unpublished) X-ray structure of [Fe(H)(CO)(dppe)2]C2H4)2, wh-ich is very similar to the corresponding cyanide complex,39 was used as a starting point for modeling. Together with the hydrogen atoms added, the size of the system is 108 atoms. The metal center is low spin Fe(II), and the total charge of the iron hydride complex is +1. The DFT optimized structure of the complex was further used for the analytic Hessian calculation and generation of the IR and Raman intensities as implemented in ADF. NRVS intensities were calculated using an in-house “Q-SPECTOR” program that analyzes the Cartesian normal mode displacements computed by ADF and other quantum chemistry programs. To mimic the experimental resolution, the DFT spectra were prepared using a convolution of the ‘stick’ intensities with 7 cm-1 broadening. Lorentz line shape was chosen to simulate the IR and NRVS results, and Gaussian line shape was chosen for the Raman spectroscopy.
Figure 4.
Comparison of experimental and DFT results for Raman spectra for 1.
Ackowledgements
This work was supported by NIH grants GM39914, GM61153, GM-65440 and EB-001962. V.P. is grateful a a research fellowhip provided by the Alexander von Humboldt Foundation. The FTIR spectra were done in ALS beamline 1.4 with the assistant of Dr. Hao Zhao and Dr. Michael Martin. The FT-Raman were performed in Frei’s Lab in LBNL, with the assistant of Dr. WalterWeare, and Dr. Heinz Frei. We thank Dr. Curtis Whaley for providing information about the crystal structure of 1.
References
- 1.Vignais PM, Billoud B, Meyer J. FEMS Microbiol. Rev. 2001;25:455–501. doi: 10.1111/j.1574-6976.2001.tb00587.x. [DOI] [PubMed] [Google Scholar]
- 2.Siegbahn PEM, Tye JW, Hall MB. Chem. Rev. 2007;107:4414–4435. doi: 10.1021/cr050185y. [DOI] [PubMed] [Google Scholar]
- 3.Shima S, Thauer SK. Chem. Rec. 2007;7:37–46. doi: 10.1002/tcr.20111. [DOI] [PubMed] [Google Scholar]
- 4.Shima S, Pilak O, Vogt S, Schlick M, Stagni MS, Meyer-Klaucke W, Warkentin E, Thauer RK, Ermler U. Science. 2008;321:572–575. doi: 10.1126/science.1158978. [DOI] [PubMed] [Google Scholar]
- 5.Vogt S, Lyon EJ, Shima S, Thauer RK. The exchange activities of [Fe] hydrogenase (iron-sulfur-cluster free. J. Biol. Inorg. Chem. 2008;13:97–106. doi: 10.1007/s00775-007-0302-2. [DOI] [PMC free article] [PubMed] [Google Scholar]
- 6.Whitehead JP, Gurbiel RJ, Bagyinka C, Hoffman BM, Maroney MJ. J. Am. Chem. Soc. 1993;115:5629. [Google Scholar]
- 7.Brecht M, vanGastel M, Buhrke T, Friedrich B, Lubitz W. J. Am. Chem. Soc. 2003;125:13075–13083. doi: 10.1021/ja036624x. [DOI] [PubMed] [Google Scholar]
- 8.Foerster S, va Gastel M, Brecht M, Lubitz W. J. Biol. Inorg. Chem. 2005;10:51. doi: 10.1007/s00775-004-0613-5. [DOI] [PubMed] [Google Scholar]
- 9.Lubitz W, Reijerse E, van Gastel M. Chem. Rev. 2007;107:4331–4365. doi: 10.1021/cr050186q. [DOI] [PubMed] [Google Scholar]
- 10.Yang X, Hall MB. J. Am Chem. Soc. 2009;131:10901–10908. doi: 10.1021/ja902689n. [DOI] [PubMed] [Google Scholar]
- 11.Tard C, Pickett CJ. Chem. Rev. 2009;109:2245. doi: 10.1021/cr800542q. [DOI] [PubMed] [Google Scholar]
- 12.Guo Y, Wang H, Xiao Y, Vogt S, Thauer RK, Shima S, Volkers PI, Rauchfuss TB, Pelmenschikov V, Case DA, Alp EE, Sturhahn W, Yoda Y, Cramer SP. Inorg. Chem. 2008;47:3969–3977. doi: 10.1021/ic701251j. [DOI] [PMC free article] [PubMed] [Google Scholar]
- 13.Landau SE, Morris RH, Lough AJ. Inorg. Chem. 1999;38:6060–6068. doi: 10.1021/ic990876a. [DOI] [PubMed] [Google Scholar]
- 14.Franke O, Wiesler BE, Lehnert N, Tuczek F. Z. Anorg. Allg. Chem. 2002;628:2395–2402. [Google Scholar]
- 15.Bergmann U, Sturhahn W, Linn J, Donald, Jenney J, Francis, Adams MWW, Rupnik K, Hales BJ, Alp EE, Mayse A, Cramer SP. J. Am. Chem. Soc. 2003;125:4016–4017. doi: 10.1021/ja028767+. [DOI] [PubMed] [Google Scholar]
- 16.Kubas GJ. Chem. Rev. 2007;107:4152–4205. doi: 10.1021/cr050197j. [DOI] [PubMed] [Google Scholar]
- 17.Guo Y. Ph.D. thesis. Davis: University of California; 2008. [Google Scholar]
- 18.Nakamoto K. Infrared and Raman Spectra of Inorganic and Coordination Compounds. 5th ed. New York: Wiley-Interscience; 1997. [Google Scholar]
- 19.Brunet J-J, Chauvin R, Chiffre J, Huguet S, Leglaye P. J. Organomet. Chem. 1998;566:117–123. [Google Scholar]
- 20.Rocchini E, Rigo P, Mezzetti A, Stephan T, Morris RH, Lough AJ, Forde CE, Fongc TP, Drouinc SD. J. Chem. Soc., Dalton Trans. 2000:3591–3602. [Google Scholar]
- 21.Franke O, Wieslerb BE, Lehnerta N, Petersa G, Burgerc P, Tuczeka F. Z. Anorg. Allg. Chem. 2006;632:1247–1256. [Google Scholar]
- 22.Robalo MP, Teixeira APS, Garcia MH, da Piedade MFM, Duarte MT, Dias AR, Campo J, Wenseleers W, Goovaerts E. Eur. J. Inorg. Chem. 2006:2175–2185. [Google Scholar]
- 23.Xiao Y, Fisher K, Smith MC, Newton WE, Case DA, George SJ, Wang H, Sturhahn W, Alp EE, Zhao J, Yoda Y, Cramer SP. J. Am. Chem. Soc. 2006;128:7608–7612. doi: 10.1021/ja0603655. [DOI] [PMC free article] [PubMed] [Google Scholar]
- 24.Xiao Y, Koutmos M, Case DA, Coucouvanis D, Wang, Cramer HSP. J. Chem. Soc. Dalton. 2006:2192–2201. doi: 10.1039/b513331a. [DOI] [PubMed] [Google Scholar]
- 25.Mitra D, Pelmenschikov V, Guo A, Case DA, Wang H, Jenney F, Adams MWW, Cramer SP. Submitted for publication. 2010 [Google Scholar]
- 26.Alp E, Sturhahn W, Toellner TS, Zhao J, Hu M, Brown DE. Hyp. Interact. 2002;144/145:3–20. [Google Scholar]
- 27.Sturhan W. J. Phys. Cond. Matt. 2004;16:S497–S530. [Google Scholar]
- 28.Leu BM, Zgiersi MZ, Wyllie GR, Scheidt WR, Sturhahn W, Alp EE, Durbin SM, Sage JT. J. Am. Chem. Soc. 2004;126:4211–4227. doi: 10.1021/ja038526h. [DOI] [PMC free article] [PubMed] [Google Scholar]
- 29.Sage JT, Paxson C, Wylie GRA, Sturhahn W, Durbin SM, Champion PM, Alp EE, Scheidt WR. J. Phys. Condens. Matter. 2001;13:7707–7722. [Google Scholar]
- 30.Sturhahn W. Hyperfine Interact. 2000;125:149–172. [Google Scholar]
- 31.Chumakov AI, Rüffer R, Leupold O, Sergueev I. Struct. Chem. 2003;14:109–119. [Google Scholar]
- 32.Sturhahn W. J. Phys. Conden. Mater. 2004;16:S497–S530. [Google Scholar]
- 33.Toellner T. Hyperfine Interact. 2000;125:3–28. [Google Scholar]
- 34.Yoda Y, Yabashi M, Izumi K, Zhang XW, Kishimoto S, Kitao S, Seto M, Mitsui T, Harami T, Imai Y, Kikuta S. Nucl. Instrum. Meth. A. 2001;467:715–718. [Google Scholar]
- 35.Kishimoto S, Yoda Y, Seto M, Kitao S, Kobayashi Y, Haruki R, Harami T. Nucl. Instrum. Meth. A. 2003;513:193–196. [Google Scholar]
- 36.Perdew JP, Burke K, Ernzerhof M. Phys. Rev. Lett. 1996;77:3865–3868. doi: 10.1103/PhysRevLett.77.3865. [DOI] [PubMed] [Google Scholar]
- 37.Perdew JP, Chevary JA, Vosko SH, Jackson KA, Pedersen MR, Singh DJ, Fiolhais C. Phys. Rev. B. 1991;46:6671–6687. doi: 10.1103/physrevb.46.6671. [DOI] [PubMed] [Google Scholar]
- 38.Burke K, Perdew JP, Wang Y. In: Electronic Density Functional Theory: Recent Progress and New Directions. Dobson JF, Vignale G, Das MP, editors. New York: Plenum; 1997. pp. 81–100. [Google Scholar]
- 39.Almeida SSPR, Fatima M, da Silva CG, Jerzykeiwicz LB, Sobota P, Pombeiro AJL. Inorg. Chim. Acta. 2003;356:259–266. [Google Scholar]


