Abstract
Objectives
Prospectively identifying children with significant dehydration from gastroenteritis is difficult in acute care settings. Previous work by our group has shown that bedside ultrasound (US) measurement of the inferior vena cava (IVC) and the aorta (Ao) diameter ratio is correlated with intravascular volume. This study was designed to validate the use of this method in the prospective identification of children with dehydration by investigating whether the IVC/Ao ratio correlated with dehydration in children with acute gastroenteritis. Another objective was to investigate the inter-rater reliability of the IVC/Ao measurements.
Methods
A prospective observational study was carried out in a pediatric emergency department (PED) between November 2007 and June 2009. Children with acute gastroenteritis were enrolled as subjects. A pair of investigators obtained transverse images of the IVC and Ao using bedside US. The ratio of IVC and Ao diameters (IVC/Ao) was calculated. Subjects were asked to return after resolution of symptoms. The difference between the convalescent weight and ill-weight was used to calculate the degree of dehydration. Greater than or equal to 5% difference was judged to be significant. Linear regression was performed with dehydration as the dependent variable, and the IVC/Ao as the independent variable. Pearson’s correlation coefficient was calculated to assess the degree of agreement between observers.
Results
One hundred and twelve subjects were enrolled. Seventy-one subjects (63%) completed follow-up. Twenty-eight subjects (39%) had significant dehydration. The linear regression model resulted in an R-squared of 0.21 (p < 0.001), and a slope (B) of 0.11 (95% confidence interval [CI] = 0.08 to 0.14). An IVC/Ao cut-off of 0.8 produced a sensitivity of 86% and a specificity of 56% for the diagnosis of significant dehydration.
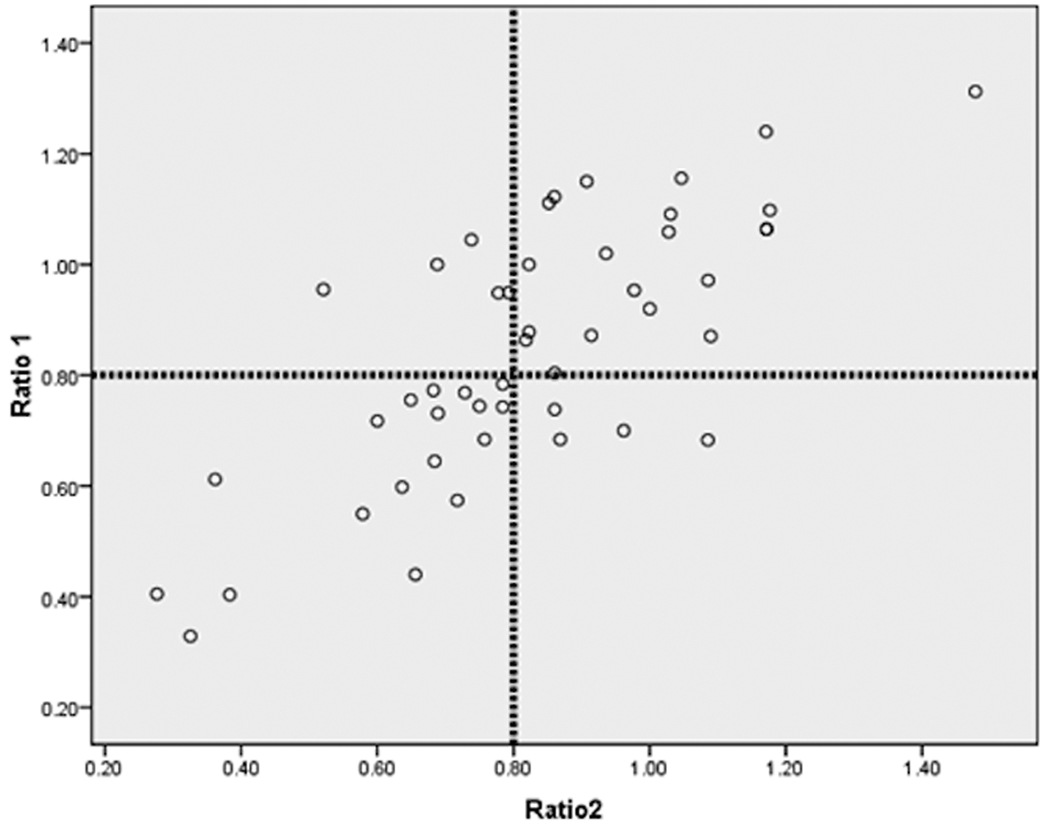
Forty-eight paired measurements of IVC/Ao ratios were made. The Pearson correlation coefficient was 0.76.
Conclusions
In this pilot study the ratio of IVC to Ao diameters, as measured by bedside ultrasound, was a marginally accurate measurement of acute weight loss in children with dehydration from gastroenteritis. The technique demonstrated good inter-rater reliability.
Keywords: gastroenteritis, ultrasound, pediatrics
INTRODUCTION
Dehydration from gastroenteritis remains is a common condition encountered in the emergency department (ED), despite progress in medicine including the wide-spread use of vaccine against rotavirus-associated gastroenteritis in developed countries. In the United States, annually there are about 220,000 hospitalizations for children less than five years of age due to gastroenteritis and dehydration.1 Dehydration from gastroenteritis remains a leading cause of death in developing countries.
One definition of the degree of dehydration is the change in body weight that has occurred over a limited period.2 This number is difficult to determine acutely, as recent well-weights are generally not available. In clinical settings, the assessment of severity of dehydration usually involves taking into account a constellation of signs and symptoms, some of which may be subjective or unreliable. Current methods for determining the presence of significant dehydration, defined as a deficit of 5% or more of body weight, have been evaluated. The combinations of clinical signs and symptoms have generally low sensitivities and specificities.3,4 Laboratory values can also be used to judge the severity of dehydration in children. It is generally acknowledged that these also have limited sensitivity and specificity.2,4,5 There is a need for a non-invasive, rapid, and objective tool that accurately reflects the volume status in children with dehydration.
Emergency bedside ultrasound (US) is a relatively new imaging modality in pediatrics.6 US assessment of the inferior vena cava (IVC) has been used as a noninvasive diagnostic tool for the assessment of intravascular volume and right heart function.7 In a recent pilot study, our group was able to demonstrate that the ratio of diameters of IVC and aorta (IVC/Ao) correlated with intravascular status in children.8 The ratio was ~1.0 in euvolemic children, while it was lower in children who were assessed to be clinically dehydrated. Immediately after intravenous rehydration, a rise in the IVC/Ao was measured. In the current study we sought to confirm and expand these preliminary findings.
We hypothesized that the IVC/Ao diameter ratio correlated with the amount of fluid loss in pediatric patients with gastroenteritis. In addition, we sought to establish the inter-observer reliability of this novel method of assessing intravascular volume. We assessed the usefulness of serum chemistries in predicting degree of dehydration. Finally, we set out to assess the ability of physicians to predict significant dehydration in children with gastroenteritis clinically, as compared to with bedside US. This method, which is easy to use and noninvasive, has the potential to standardize future research in dehydration in children.
METHODS
Study Design
This was a prospective observational study. The study was approved by the Human Investigation Committee at Yale University School of Medicine. Written informed consent was obtained from a parent or guardian for each subject. Written assents were obtained from children ages 7 to 16 years.
Study Setting and Population
We carried out the study in the urban pediatric emergency department (PED) at Yale-New Haven Children’s Hospital between November 2007 and June 2009. Five pediatric emergency physicians performed the US measurements during the course of the study. They underwent brief focused training given by the principal investigator (LC) prior to the initiation of the study. Patients between 6 months and 18 years of age who presented to the PED with gastroenteritis were eligible to become subjects. They were approached for enrollment if at least one of the investigators was available. Gastroenteritis was defined as diarrhea with or without vomiting, with onset within 7 days of the PED visit. The exclusion criteria included chronic medical conditions such as congenital heart disease, bronchopulmonary dysplasia, and renal and liver diseases. Children with acute blood loss were also excluded.
Study Protocol
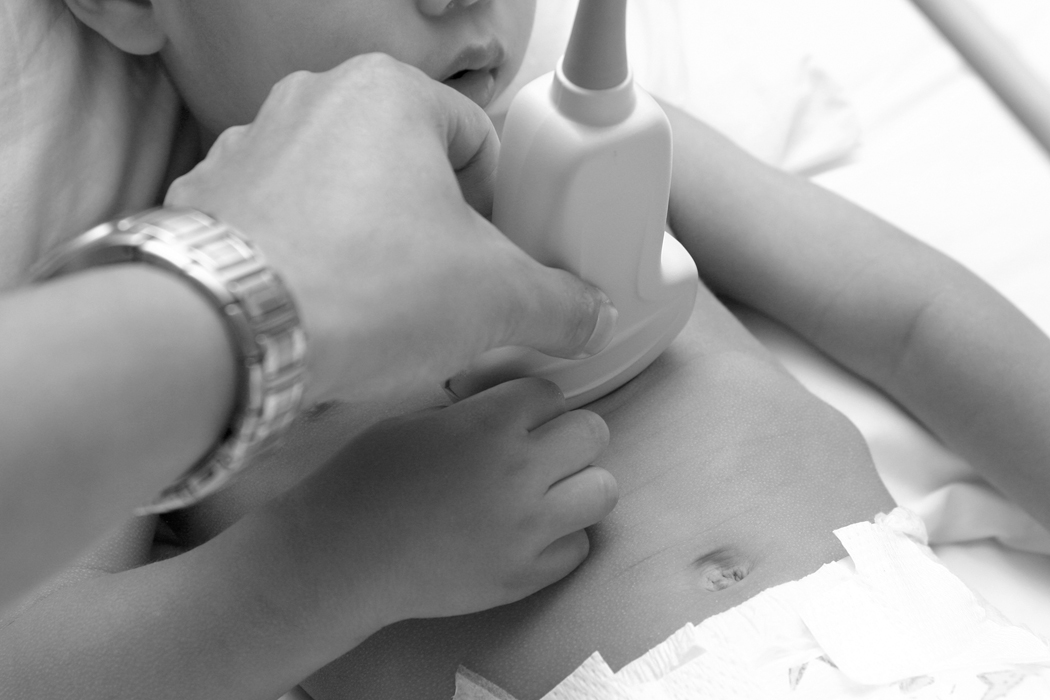
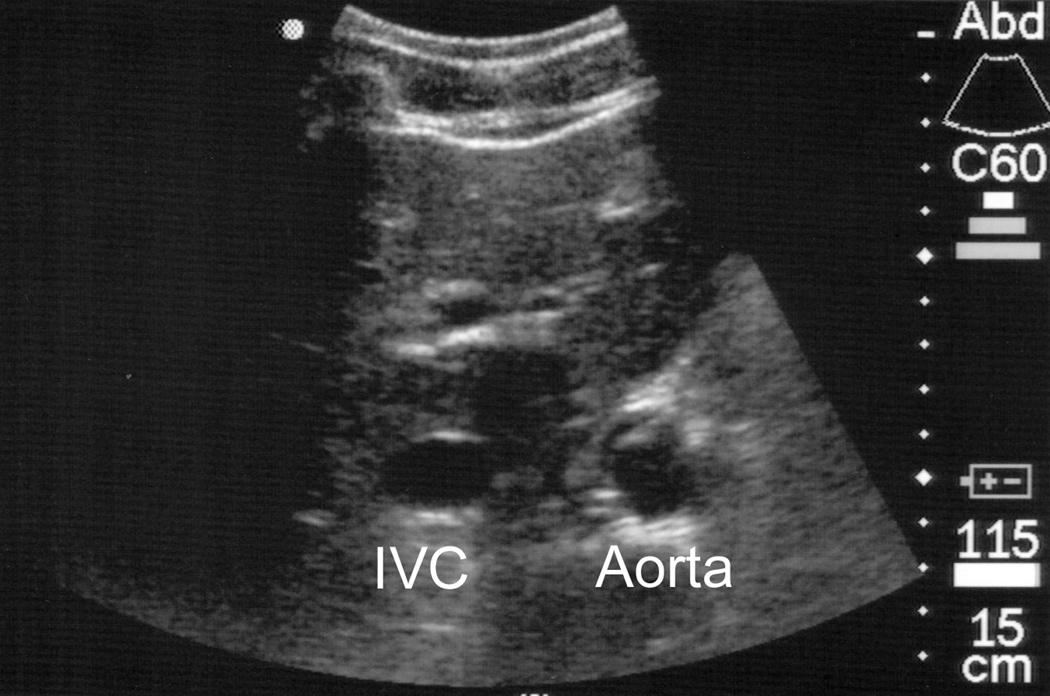
Patient weights at triage were recorded. Prior to any therapy, IVC and Ao diameters were measured with a Sonosite MicroMAXX ultrasound (Sonosite, Bothell, WA), using the C60 curvilinear probe. The subjects were placed in supine position. The transducer was placed over the subxiphoid region (Figure 1) as previously described.9 A transverse image of the vessels was obtained. The maximal diameter in the IVC was measured during the expiratory phase of the respiratory cycle. The maximal diameter of the Ao was obtained during systole of the cardiac cycle. Representative portions of the study were recorded electronically (see Figure 2). To assess inter-rater reliability, whenever possible each measurement was to be performed by two investigators who were blinded to each other’s measurements.
Figure 1. Placement of probe in the subxiphoid region.
Figure 2. Sample image of transverse imaging of inferior vena cava (IVC) and descending aorta (Ao).
The attending physician responsible for the clinical care of the patient, blinded to the ultrasound findings, was asked to rate the severity of dehydration on a ordinal scale (0: <5%; 1: 5%–10%; 2: >10%).
When serum electrolytes or glucose were obtained as part of the care of the patient, those results were recorded. The patient disposition from the PED was also recorded.
After the initial PED visit, study subjects were contacted by telephone and asked to return to the PED for repeat weight measurement once they were well, within 7 to 10 days of the initial visit and after they have been asymptomatic for 48 hours. The difference between ill weight and well weight was used to calculate the actual percent fluid loss during the initial visit. The subjects were considered to have significant dehydration if the weight loss was at least 5%.
All weights were performed according to hospital protocol, on either an infant scale (Scale Tronix 4800, Wheaton, IL) or a scale for older children (Scale Tronix 5002, Wheaton, IL). The same scale was used for each subject.
Data Analysis
We used linear regression with IVC/Ao ratio as the predictor variable and dehydration as the dependent variable to assess the number of subjects needed. A sample size of 80 achieves 80% power to detect an R-square of 0.10 attributed to the single independent variable, using an F-test with a significance level of 0.05. Assuming a 33% attrition rate, we aimed to enroll 120 subjects.
Linear regression was performed with IVC/Ao ratio as the predictor variable and dehydration as the dependent variable. R-squared values were calculated, and F-test was used to assess statistical significance of results. Continuous variables between groups were compared with Mann-Whitney U test. Proportions were compared with chi-square test. Receiver operator curves were constructed. Pearson’s correlation coefficient was calculated to assess the degree of agreement between observers. All analyses were performed using SPSS 16.0 (SPSS, Chicago, IL).
RESULTS
One hundred and twelve subjects were enrolled. In eight subjects, the measurements could not be performed, either due to the lack of patient cooperation (n = 4) or because large body habitus precluded transverse imaging of the vessels (n = 4). Thirty-three subjects were lost to follow-up, leaving a total of 71 patients for complete analysis. Their characteristics are presented in Table 1.
Table 1.
Demographics of subjects
| Demographic | Completed follow-up | Lost to follow-up | p value |
|---|---|---|---|
| Variable | n = 71 | n = 33 | |
| Mean age, yrs (SD) | 5.3 (± 4.3) | 3.6 (± 3.2) | 0.100 |
| Mean IVC/Ao ratio (SD) | 0.77 (± 0.22) | 0.88 (± 0.26) | 0.015 |
| Admission rate | 8% | 3% | 0.300 |
| Intravascular fluids rate | 39% | 12% | 0.005 |
| Mean HCO3 (meq/dl) (SD) | 20.6 (± 4.4) | 19.4 (± 4.2) | 0.590 |
n = 112
IVC = inferior vena cava; Ao = aorta
Validity
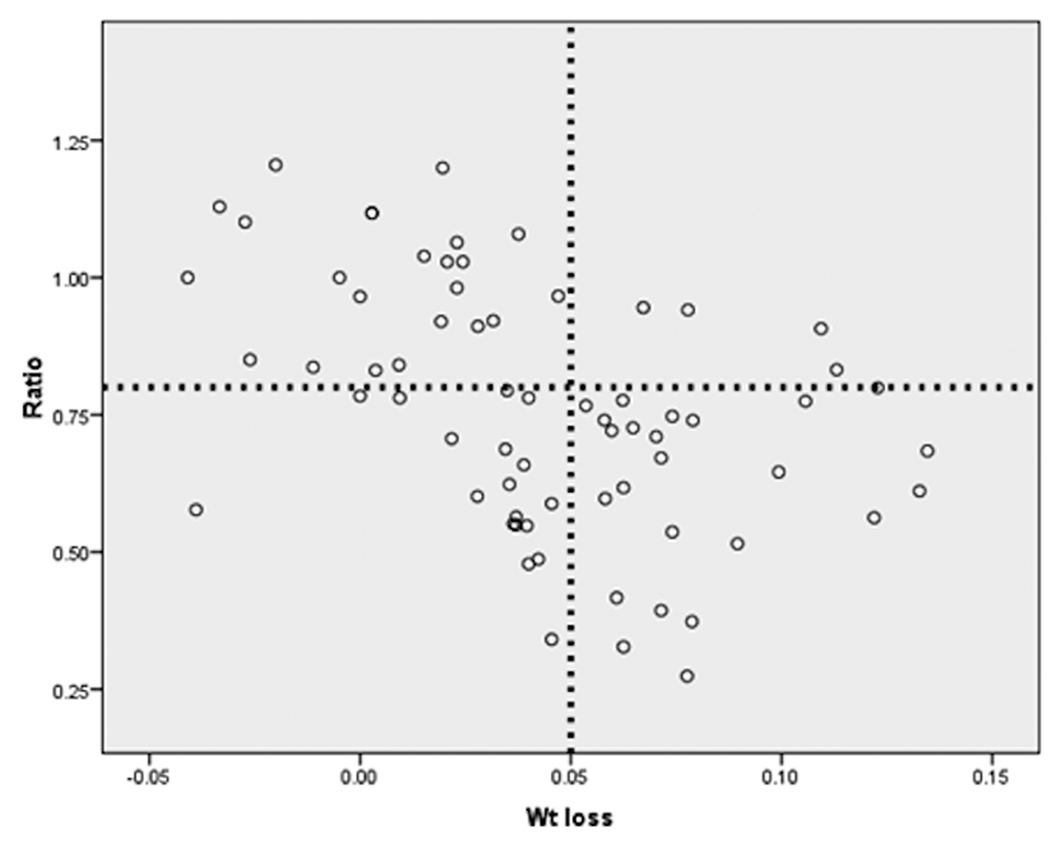
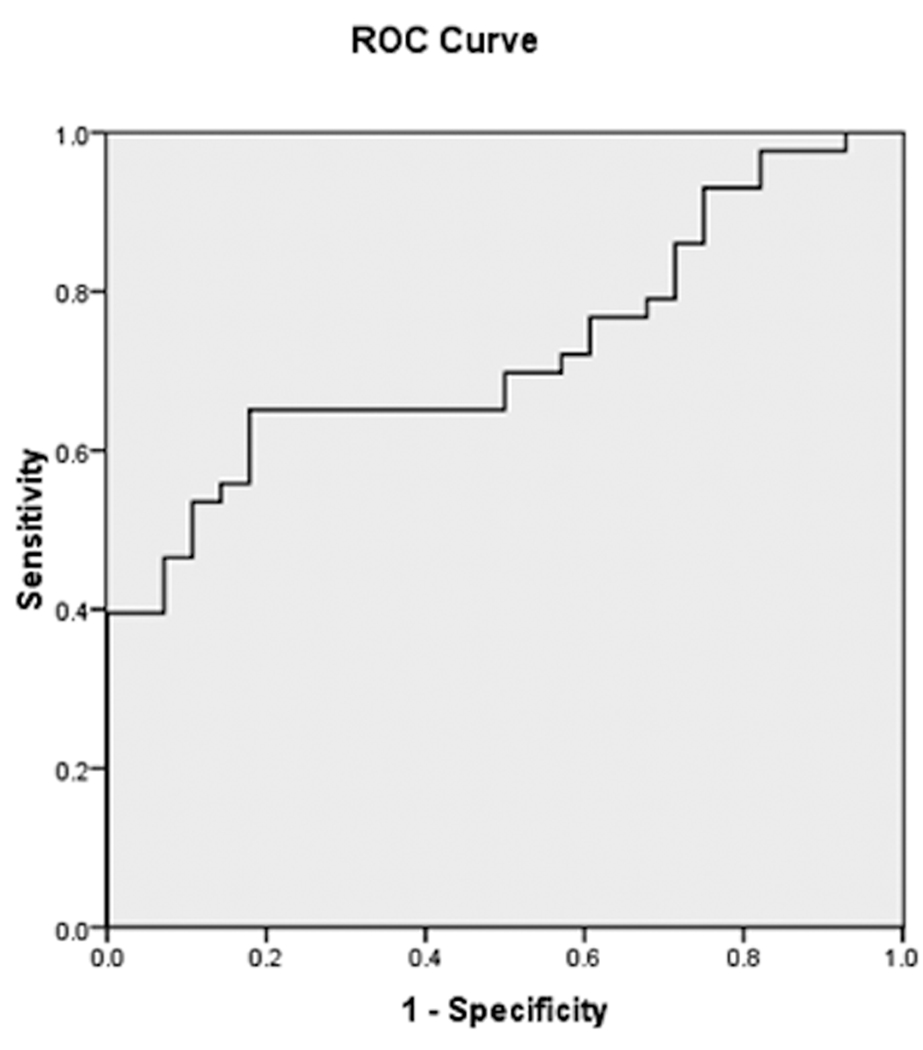
Each subject’s IVC/Ao ratio and severity of dehydration is shown in Figure 3. The IVC/Ao ratio and weight loss were evaluated for normality using the Kolmogorov-Smirnov test, resulting in p values of 0.20 and 0.22 respectively. The linear regression model resulted in an R-squared of 0.21 (p < 0.001), and a slope (B) of 0.11 (95% confidence interval [CI] = 0.08 to 0.14). Twenty-eight subjects (39%) had significant dehydration based on greater than or equal to 5% of weight loss. A receiver-operator characteristic curve generated from this data is shown in Figure 4. The area under the curve (AUC) was 0.73 (95% CI = 0.61 to 0.84). An IVC/Ao cut-off of 0.8 produced a sensitivity of 86% and a specificity of 56% for the diagnosis of significant dehydration. The positive predictive value was 56%, and the negative predictive value was 86%.
Figure 3. Scatter plot of weight loss and IVC/Ao ratio.
The x axis represents weight loss as a proportion of well weight. The vertical line indicates 5% dehydration. The y axis represents IVC/Ao ratio. The horizontal line indicates an IVC/Ao ratio of 0.80.
IVC = inferior vena cava; Ao = aorta
Figure 4. Receiver operating characteristic curve of weight loss and IVC/Ao ratio.
IVC = inferior vena cava; Ao = aorta
Reliability
Forty-eight paired measurements of IVC/Ao ratios were made and are shown in Figure 5. Pearson correlation coefficient was 0.76. When the data were dichotomized around an IVC/Ao ratio of 0.8, the measurements were congruent 83% of the time.
Figure 5. Scatter plot of IVC/Ao ratio between two operators.
The vertical and horizontal lines are for IVC/Ao values of 0.80. IVC = inferior vena cava; Ao = aorta
Physician assessment of dehydration
Twelve PEM attending physicians assessed the 71 subjects for the severity of dehydration. Eleven of the physicians are PEM board-eligible or board-certified. They have a mean of 7.4 years of post-training clinical experience. The physician assessment of dehydration had a sensitivity of 78%, and a specificity of 51%. The AUC for physician assessment was 0.65 (95% CI = 0.53 to 0.77).
Administration of intravascular fluids
Twenty eight subjects (39%) received intravenous fluid administration in the PED. Fifteen significantly dehydrated children received intravascular fluids, as did 13 children who did not have significant dehydration, based on subsequent weight measurements.
Biochemical abnormalities
Serum glucose levels were measured in 30 subjects. They were significantly lower in children who were dehydrated than those who were not (mean of 81 mg/dl vs. 98 mg/dl, p = 0.04), but were not different in children who had IVC/Ao ratios less than 0.8 than those who did not (mean of 85 mg/dl vs. 100 mg/dl, p = 0.15).
Serum bicarbonate levels were measured in 28 subjects. The levels were not statistically different between dehydrated and non-dehydrated children (mean 19.4 meq/dl vs. 22.1 meq/dl, p = 0.1).
Blood urea nitrogen (BUN) was measured in 30 subjects. The levels were not statistically different between dehydrated and non-dehydrated children (mean of 12.7 mg/dl vs. 11.9 mg/dl, p = 0.8).
DISCUSSION
Objective assessment of hydration status in children in the ED is fraught with difficulties. Historical information such as oral intake, stool and urine output, and well weight are often inaccurate or difficult to obtain. Clinical signs and symptoms of dehydration are inconsistent. Laboratory testing is invasive and potentially of dubious utility,4 as confirmed by our current data. Studies using IVC measurements to assess intravascular volume status have been conducted in adults.9,10 We had previously designed a novel parameter, the ratio between the IVC and Ao diameters, and demonstrated a relationship between this ratio and intravascular volume in children receiving intravenous rehydration.8 In the current study, a cut-off value of 0.8 identified children with significant dehydration at 86% sensitivity and 56% specificity, respectively.
The technique demonstrated good reliability in the hands of PEM physicians who were novice sonographers. Methods relying on a combination of clinical signs and symptoms, while initially demonstrating good reliability, have generally not been widely adopted.4 This novel technique with its simplicity may prove more generalizable and acceptable. Specifically, physicians who are less experienced in the care of children may find this method superior to reliance upon observing nuances in the behavior and physical appearances of children. Finally, with the wide availability of bedside ultrasound equipment in EDs, there is little cost associated with the use of this modality.
While the study was not powered to compare the discriminatory abilities of other methods of detecting dehydration (serum HCO3, BUN, physician assessment), it is worthwhile to keep in mind the advantages of this technique over traditional methods. It is objective, noninvasive, and can be performed rapidly with minimal amount of training. Combined with rapid bedside point-of-care testing and non-invasive assessment of acid-base status,11 it may lead to more rapid and accurate assessment of children, and help to determine which children would most likely benefit from aggressive fluid resuscitation.
Oral rehydration therapy has been found to be a good alternative to intravenous rehydration in children with mild to moderate dehydration.1,12,13 A significant proportion of our study subjects received intravenous fluid as part of their treatment in the PED. The study did not specifically address the rationale for choosing intravenous over oral rehydration. A number of factors in addition to the severity of dehydration are considered in the decision regarding the route of rehydration. These include, among others, local resources and parental preference. In addition to studies to validate this modality, future studies could address whether tailoring ED treatment to the severity of dehydration measured by US may lead to more efficient utilization of resources. This could help decrease unnecessary treatment by specifically targeting those who would benefit the most from aggressive rehydration.
LIMITATIONS
A significant proportion of the patients did not return for follow-up. Different prevalence of dehydration in the entire group may affect the test characteristics of our parameter.
Eight subjects could not be adequately imaged. The four infants who could not be imaged were enrolled in the beginning months of the study. During the course of the study we were able to refine the procedure so that the transducer only had to remain on the patient for a very brief period of time (< 15 sec). Images were able to be reviewed in the computer buffer. Measurements were made without the transducer remaining on the patients. This allowed imaging even in the most recalcitrant subjects. In the other four patients, their large body habitus made transverse imaging of the vessels difficult. Longitudinal imaging of the vessels could be obtained using the liver as the acoustic window. We chose not to record these data for the sake of consistency in methodology. Future similar studies should consider incorporating a “ramp-up” period to fine tune the technique.
We did not insist on the use of any particular dehydration score when the PEM attending were asked to judge the severity of dehydration. This reflects the reality of the practice in our institution and probably many other academic EDs as well. However, our findings of the limitations of clinical judgment may not be generalizable to other settings where clinical experiences and expertise may vary.
Our sample size was relatively small, and we did not reach the a priori sample size based on power calculations. Larger prospective studies should be conducted to validate these results. Future design could include sub-group analysis of children stratified by age and severity of illness. Larger sample sizes would allow more robust comparison with standardized dehydration scores.
CONCLUSIONS
In this pilot study, the ratio of IVC to Ao diameters, as measured by bedside ultrasound, is a marginally accurate measurement of acute weight loss in children with dehydration from gastroenteritis. The technique demonstrated good inter-rater reliability.
Acknowledgments
Supported in part by CTSA, Grant Number KL2 RR024138 from the National Center for Research Resources (NCRR), a component of the National Institutes of Health (NIH), and NIH Roadmap for Medical Research.
Footnotes
Disclosures: The authors state that they have no relevant financial interests to declare.
Presentations: Pediatric Academic Society Annual Meeting, Baltimore, MD, May 2009
REFERENCES
- 1.McConnochie K, Conners G, Lu E, Wilson C. How commonly are children hospitalized for dehydration eligible for care in alternative settings? Arch Pediat Adolesc Med. 1999;153(12):1233–1241. doi: 10.1001/archpedi.153.12.1233. [DOI] [PubMed] [Google Scholar]
- 2.McMillan JD, Feigin R, Warshaw J. Oski's Pediatrics: Principles and Practice. 3 edition. New York, NY: Lippincott Williams & Williams; 1999. [Google Scholar]
- 3.Gorelick MH, Shaw KN, Murphy KO. Validity and reliability of clinical signs in the diagnosis of dehydration in children. Pediatrics. 1997;99(5):e6. doi: 10.1542/peds.99.5.e6. [DOI] [PubMed] [Google Scholar]
- 4.Steiner MJ, DeWalt DA, Byerley JS. Is this child dehydrated? JAMA. 2004;291(22):2746–2754. doi: 10.1001/jama.291.22.2746. [DOI] [PubMed] [Google Scholar]
- 5.Rudolph CR, Hostetter M, Lister G, Siegel N. Rudolph's Pediatrics. 21 edition. New York, NY: McGraw-Hill Companies; 2003. [Google Scholar]
- 6.Chen L, Baker MD. Novel applications of ultrasound in pediatric emergency medicine. Pediatric Emerg Care. 2007;23(2):115–123. doi: 10.1097/PEC.0b013e3180302c59. [DOI] [PubMed] [Google Scholar]
- 7.Pershad J, Myers S, Plouman C, et al. Bedside limited echocardiography by the emergency physician is accurate during evaluation of the critically ill patient. Pediatrics. 2004;114(6):e667–e671. doi: 10.1542/peds.2004-0881. [DOI] [PubMed] [Google Scholar]
- 8.Chen L, Kim Y, Santucci KA. Use of ultrasound measurement of the inferior vena cava diameter as an objective tool in the assessment of children with clinical dehydration. Acad Emerg Med. 2007;14:841–845. doi: 10.1197/j.aem.2007.06.040. [DOI] [PubMed] [Google Scholar]
- 9.Yanagawa Y, Nishi K, Sakamoto T, Okada Y. Early diagnosis of hypovolemic shock by sonographic measurement of inferior vena cava in trauma patients. J Trauma. 2005;58(4):825–829. doi: 10.1097/01.ta.0000145085.42116.a7. [DOI] [PubMed] [Google Scholar]
- 10.Lyon M, Blaivas M, Brannam L. Sonographic measurement of the inferior vena cava as a marker of blood loss. Am J Emerg Med. 2005;23(1):45–50. doi: 10.1016/j.ajem.2004.01.004. [DOI] [PubMed] [Google Scholar]
- 11.Nagler J, Wright R, Krauss B. End-tidal carbon dioxide as a measure of acidosis among children with gastroenteritis. Pediatrics. 2006;118(1):260–267. doi: 10.1542/peds.2005-2723. [DOI] [PubMed] [Google Scholar]
- 12.Atherly-John YC, Cunningham SJ, Crain EF. A randomized trial of oral vs intravenous rehydration in a pediatric emergency department. Arch Pediat Adolesc Med. 2002;156(12):1240–1243. doi: 10.1001/archpedi.156.12.1240. [DOI] [PubMed] [Google Scholar]
- 13.Spandorfer PR, Alessandrini EA, Joffe MD, Localio R, Shaw KN. Oral versus intravenous rehydration of moderately dehydrated children: a randomized, controlled trial. Pediatrics. 2005;115(2):295–301. doi: 10.1542/peds.2004-0245. [DOI] [PubMed] [Google Scholar]


