

Abstract
BACKGROUND
Hepatitis B e antigen (HBeAg)-negative chronic hepatitis B has a divergent presentation and clinical course from that of HBeAg-positive infection. The former usually presents with lower viral levels, but faster progression to liver disease. We sought to understand better the balance between replication and the immune response against hepatitis B virus (HBV).
METHODS
Viral kinetics in 50 HBeAg-negative patients under various treatment protocols with interferon-α and/or nucleos(t)ide analogues was analyzed. HBV DNA level was measured frequently and the data fitted to a viral dynamic model. A meta-analysis of all published studies of viral kinetics in HBeAg-positive and negative infection was also conducted.
RESULTS
We found that the clearance of both HBV virions and infected cells was significantly faster in HBeAg-negative than -positive infection. In HBeAg-negative infection, there was also a negative correlation between baseline HBV DNA levels and infected cell half-life, suggesting that the higher the viral load the faster the turnover of infected cells.
CONCLUSIONS
These results reveal the dual role of the immune response in maintaining lower viral levels and inducing faster turnover of infected cells, the latter of which may be responsible for the more aggressive nature of HBeAg-negative infection.
Keywords: HBeAg, mathematical model, e antigen, HBV, dynamics
Approximately 2 billion people have been infected with hepatitis B virus (HBV) in their lifetime [1, 2]. Since only a small percentage of infected adults develops chronic hepatitis B, global prevalence of this disease is estimated at 350 million people [1]. End-stage HBV infection can lead to cirrhosis and to hepatocellular carcinoma (HCC), and up to 1.2 million people die every year from the consequences of this infection [1].
Chronic HBV infection (CHB) is usually characterized by detectable HBV DNA in serum, as well as the presence of hepatitis B surface antigen (HBsAg). Hepatitis B e antigen (HBeAg) can also be present. However, a large proportion of infected individuals are HBeAg-negative [3], because they are infected with HBV variants that are unable to produce high amounts of the excreted protein that bears the HBe epitope. These HBV mutants are rather uncommon in North America and Northern Europe, but the vast majority of patients with CHB in Southern Europe and Africa is infected with variants that express little or no HBeAg, and prevalence of HBeAg-negative CHB seems to be increasing worldwide [3–5].
Infection with HBeAg-negative hepatitis B variants is associated with lower serum viral levels [6–8], higher intra-hepatic necroinflammatory lesions and more severe progression of disease, with frequent development of cirrhosis and/or HCC [9, 10], than infection with HBeAg-positive strains [6, 11]. Taken together these observations may indicate a stronger immune response against HBeAg-negative infection. Consistent with this, even though the function of the HBe protein is not clear, it has been suggested that it serves to down modulate the immune response [12, 13]. In addition, HBeAg-negative HBV patients represent a more difficult to treat patient pool, due to lower off-treatment sustained responses [7, 14, 15].
Modeling of different viral infections and their treatment has given insight into aspects of viral evolution, pathogenesis and the mechanisms of antiviral drug action [16–20]. Such analyses of HBeAg-positive HBV infection showed that this virus has a short half-life in plasma and rapid viral production. We and others have calculated that the daily production of HBV in HBeAg-positive infection is in excess of 1011 virions and that infected cell lifespan is very variable but can be as short as 2 days [21, 22]. A few studies have also analyzed the effect of drug therapy on the kinetics of HBeAg-negative viral infection [23, 24]. The results from these studies suggest that viral clearance may be even faster in the setting of HBeAg-negative infection.
Here we analyze the dynamics of HBeAg-negative infection under a variety of drug treatments and conduct an exhaustive meta-analysis of published results concerning HBV viral dynamics. Our goal was to understand the respective roles of viral production and the immune response in HBeAg-negative infection and compare them with HBeAg-positive infection.
PATIENTS AND METHODS
Patients
The study population included 50 patients (40 men) with chronic HBeAg-negative infection, enrolled between 2000 and 2002. Their mean age was 40±11 years, median serum alanine aminotransferase (ALT) level was 72±64 international units (IU)/L and diagnosis of CHB was made according to well established criteria [25]. All had well compensated active liver disease and liver biopsy showed a modified Ishak Histological Activity Index of at least 6, with a fibrosis score of at least 1. The patients had no coinfections with hepatitis delta virus, hepatitis C virus, or HIV. The study was approved by the Ethical Committee of the Scientific Council of Papageorgiou General Hospital. All patients gave informed consent for the kinetic study.
Therapy
The therapy protocols used in this study were accepted clinical practice or investigational protocols for drugs being developed at the time of patient enrollment. Twelve patients received standard IFN-α2a monotherapy, 4.5 MU tiw (IFN group), 10 received lamivudine monotherapy, 100mg qd (LAM group), 10 received a combination of both standard IFN-α2a and lamivudine at the same doses (IFN+LAM group), 6 received pegylated IFN-α2a monotherapy, 180 μg qw (PEG group), 7 received a combination of pegylated IFN-α2a and lamivudine (PEG+LAM group), and 11 received a combination of adefovir dipivoxil, 10mg qd, and lamivudine, 100mg qd (ADV+LAM group) (Table 1). Of this last group, 6 were patients whose first treatment regimen had failed and they were retreated with this second protocol: they were numbered with the suffix “b” after their number, eg. P11b. Treatment was maintained in all included patients for 48 weeks, and all patients were followed for at least 12 more months. However, for the majority of the patients (29 patients), biochemical response (normal ALT), virological response (undetectable HBV DNA), and complete response (HBsAg loss), were assayed at 24 months post treatment.
Table 1.
HBV Kinetic Parameters (SD: standard deviation)
| Patient | Tx | V0 (log10 IU/ml) | c (day−1) | δ (day−1) | ε | τ (days) | V half-life (days) | I half-life (days) |
|---|---|---|---|---|---|---|---|---|
| 1 | IFN | 7.73 | 2.32 | 0.072 | 0.727 | 1.6 | 0.30 | 9.63 |
| 2 | IFN | 7.81 | 0.42 | 0 | 0.965 | 0.0 | 1.65 | |
| 3 | IFN | 6.98 | NA | NA | NA | |||
| 4 | IFN | 4.18 | 0.24 | 0.053 | 0.855 | 2.9 | 2.89 | 13.08 |
| 5 | IFN | 5.56 | 1.3 | 0.061 | 0.988 | 0.3 | 0.53 | 11.36 |
| 6 | IFN | 5.52 | 1.32 | 0.036 | 0.953 | 0.0 | 0.53 | 19.25 |
| 30 | IFN | 6.41 | 17.36 | 0.008 | 0.559 | 0.9 | 0.04 | 86.64 |
| 31 | IFN | 6.23 | 1.3 | 0.027 | 0.363 | 0.0 | 0.53 | 25.67 |
| 32 | IFN | 4.65 | 1.02 | 0.041 | 0.852 | 0.1 | 0.68 | 16.91 |
| 45 | IFN | 5.74 | 0.64 | 0.113 | 0.985 | 0.0 | 1.08 | 6.13 |
| 46 | IFN | 8.76 | NA | NA | NA | |||
| Mean | 6.33 | 2.88 | 0.046 | 0.805 | 0.6 | 0.91 | 23.58 | |
| 8 | LAM | 5.61 | 6.19 | 0.135 | 0.922 | 1.2 | 0.11 | 5.13 |
| 9 | LAM | 7.57 | 2.22 | 0.139 | 0.966 | 0.8 | 0.31 | 4.99 |
| 10 | LAM | 7.66 | NA | NA | NA | |||
| 11 | LAM | 6.58 | 1.81 | 0.172 | 0.934 | 0.6 | 0.38 | 4.03 |
| 12 | LAM | 7.72 | 1.71 | 0.188 | 0.896 | 0.0 | 0.41 | 3.69 |
| 13 | LAM | 5.76 | 0.77 | 0.029 | 0.998 | 0.0 | 0.90 | 23.90 |
| 14 | LAM | 7.76 | 1.93 | 0.292 | 0.964 | 0.1 | 0.36 | 2.37 |
| 15 | LAM | 4.56 | 2.09 | 0 | 0.982 | 0.7 | 0.33 | |
| 16 | LAM | 4.11 | 0.69 | 0.064 | 0.990 | 0.0 | 1.00 | 10.83 |
| 17 | LAM | 5.02 | NA | NA | NA | |||
| Mean | 6.24 | 2.18 | 0.127 | 0.957 | 0.4 | 0.48 | 7.85 | |
| 18 | IFN+LAM | 7.86 | 0.55 | 0.028 | 1.000 | 0.0 | 1.26 | 24.76 |
| 19 | IFN+LAM | 7.48 | 1.58 | 0.133 | 0.779 | 0.4 | 0.44 | 5.21 |
| 20 | IFN+LAM | 6.11 | 0.87 | 0.023 | 0.998 | 0.0 | 0.80 | 30.14 |
| 21 | IFN+LAM | 9.00 | 1.49 | 0.184 | 0.801 | 0.3 | 0.47 | 3.77 |
| 22 | IFN+LAM | 7.53 | 1.06 | 0.155 | 0.941 | 0.3 | 0.65 | 4.47 |
| 35 | IFN+LAM | 8.26 | 0.81 | 0.189 | 0.996 | 0.0 | 0.86 | 3.67 |
| 37 | IFN+LAM | 6.30 | 0.87 | 0.067 | 0.934 | 0.0 | 0.80 | 10.35 |
| Mean | 7.51 | 1.03 | 0.111 | 0.921 | 0.1 | 0.75 | 11.77 | |
| 23 | PEG+LAM | 5.49 | 0.77 | 0 | 0.999 | 1.8 | 0.90 | |
| 24 | PEG+LAM | 8.11 | 0.62 | 0.164 | 0.912 | 1.0 | 1.12 | 4.23 |
| 25 | PEG+LAM | 6.76 | 0.61 | 0 | 0.885 | 0.1 | 1.14 | |
| 26 | PEG+LAM | 9.00 | NA | NA | NA | |||
| 27 | PEG+LAM | 7.63 | NA | NA | NA | |||
| 28 | PEG+LAM | 3.45 | 0.46 | 0 | 0.983 | 1.1 | 1.51 | |
| 29 | PEG+LAM | 5.36 | 1.3 | 0.076 | 0.990 | 0.9 | 0.53 | 9.12 |
| Mean | 6.54 | 0.75 | 0.048 | 0.954 | 1.0 | 1.04 | 6.67 | |
| 38 | PEG | 8.48 | NA | NA | NA | |||
| 40 | PEG | 8.00 | 5.86 | 0.42 | 0.811 | 0.3 | 0.12 | 1.65 |
| 41 | PEG | 7.08 | 3.39 | 0.199 | 0.509 | 0.8 | 0.20 | 3.48 |
| 42 | PEG | 4.78 | 0.78 | 0.027 | 0.988 | 0.9 | 0.89 | 25.67 |
| 43 | PEG | 8.38 | NA | NA | NA | |||
| Mean | 7.34 | 3.34 | 0.215 | 0.769 | 0.6 | 0.40 | 10.27 | |
| 11b | ADV+LAM | 3.78 | 1.54 | 0 | 0.942 | 0.0 | 0.45 | |
| 12b | ADV+LAM | 7.41 | 1.96 | 0.227 | 0.934 | 0.5 | 0.35 | 3.05 |
| 14b | ADV+LAM | 6.48 | 1.63 | 0.262 | 0.986 | 0.0 | 0.43 | 2.65 |
| 26b | ADV+LAM | 7.61 | 1.27 | 0.094 | 0.980 | 0.0 | 0.55 | 7.37 |
| 27b | ADV+LAM | 7.18 | 1.03 | 0.166 | 0.765 | 0.0 | 0.67 | 4.18 |
| 47 | ADV+LAM | 4.98 | 1.18 | 0.067 | 0.992 | 0.0 | 0.59 | 10.35 |
| 48 | ADV+LAM | 4.73 | 1.33 | 0.013 | 0.990 | 0.0 | 0.52 | 53.32 |
| 50 | ADV+LAM | 4.30 | 1.57 | 0 | 0.978 | 0.5 | 0.44 | |
| 51 | ADV+LAM | 6.08 | 0.91 | 0.171 | 0.885 | 0.0 | 0.76 | 4.05 |
| Mean | 5.84 | 1.38 | 0.111 | 0.939 | 0.1 | 0.53 | 12.14 | |
| Overall Mean | 6.52 | 1.87 | 0.100 | 0.899 | 0.4 | 0.69 | 13.39 | |
| Overall SD | 1.49 | 2.76 | 0.096 | 0.142 | 0.6 | 0.50 | 16.94 | |
We initiated treatment in 56 cases (6 patients treated twice). However, for seven cases there was not enough follow-up to analyze the data either because the viral load went below detection too quickly, usually within the first 2 days (4 cases: P24b, P34, P36, P49), or circumstances precluded sampling the patient at the protocol times (3 cases: P7, P33, P39). We do not consider these cases further. Thus, in all we analyzed data of 49 cases (Table 1).
HBV DNA quantification
HBV DNA was quantified by an in-house real-time polymerase chain reaction (PCR) assay with lower limit of detection of 350 IU/ml using an international quantification standard (Optiqual® HBV DNA Controls, AcroMetrix, Benicia, California). This test is linear up to 109 IU/ml and samples with more than 9 logs were diluted 1/100 and retested. The patients were sequentially included into the different treatment groups according to availability of the drugs and treatment guidelines. Therefore, the sampling protocols differed slightly among the groups. All patients from the PEG+LAM and PEG groups and seven patients from the LAM group had HBV DNA measurements at treatment commencement, then at 8 hours; 1, 2, 4, 5, and 7 days; and 2, 3, 4, 5, 6, 8, 12, 18, 24, and 30 weeks after initiation of treatment. In the ADV+LAM group, the schedule was almost identical except that no samples were taken at 8 hours. Measurements were taken more frequently in the 3 remaining patients from the LAM group and in all patients from the IFN or IFN+LAM groups: 0h, every 6h up to and including 48 hours, and every 12h through day 5. Measurements were then taken every second day through day 15, every third day from days 15 through 30, and then at the end of every month through 12 months after therapy initiation. For most patients, samples were obtained 4 and 2 weeks before treatment to define baseline viral load as the average of these and the time zero sample.
Mathematical Model
Analysis of the dynamics of HBV under treatment was based on the standard model of viral infection [21]:
| (Equation 1) |
| (Equation 2) |
| (Equation 3) |
where T is the number of target cells, I is the number of productively infected cells, and V is the virion concentration. The parameter s denotes the rate at which target cells are produced and the constant d represents their death rate. Target cells become infected at rate β per uninfected cell per virion, and infected cells die at rate δ. The production and release of hepatitis B virions by infected cells occurs at an average rate of p virions per cell per day, and virion clearance occurs at rate c per virion. This model considers two possible effects of treatment: a reduction of the production of virions from infected cells by a factor (1 − ε) and/or a reduction of the de novo rate of infection by a factor (1 − η). Assuming that during the period of analysis, target cells remain constant at its pretreatment steady state level, we have the solution:
| (4) |
where λ1= 0.5(c + δ + θ), λ2 = 0.5(c + δ − θ), and .
This solution includes a delay, τ, between treatment administration and its effect on viral level, and is valid for all times t after this delay. For t < τ, V(t) = V0, the initial viral level. This modeling approach corresponds to that used in many viral dynamics studies [19, 21, 26, 27], to which we would like to compare our results.
Data Fitting
Individual non-linear least squares fits were performed using a Levenberg-Marquardt algorithm. To maintain the validity of the assumption that the number of target cells remains constant, the fits were limited to data collected during the first 30 days. Because previous work indicates that η has very little influence on the data fits, we fixed it at 0.5 for all patients [21, 28]. Other parameters were free, with the exception of τ for patients 12 and 32, for whom we could not find a stable value and this delay was fixed (Table 1). The virion and infected cell half-lives were calculated from the estimated values of c and δ as ln(2)/c and ln(2)/δ, respectively.
Meta-analysis of published data
A meta-analysis was conducted to compare viral kinetics in HBeAg-positive and HBeAg-negative patients. On October 23, 2008, a Pubmed search was performed with the keywords “dynamics HBV”, “model kinetics HBV”, “mathematical model HBV”, “dynamics HBV treatment” and the same expressions with “HBV” replaced with “hepatitis B”, for papers in English without restriction of dates. Of the over 140 papers retrieved, 17 papers included viral dynamics analyses similar to the one conducted in this paper, but only seven provided individual patient’s parameter estimates that could be used for our analyses. We also analyzed by forest plots [29] the data in all studies that provided mean and standard deviations for the kinetic parameters of HBeAg-positive and -negative individuals (n=10 studies).
Statistical Analyses
We used parametric tests whenever the necessary assumptions were met. We checked these assumptions by analyzing normality of the data and/or the residuals of the fits as appropriate. When necessary transformations of the data (eg. taking the square root or the logarithm) were used to comply with homoscedasticity and normality of residuals. Results are presented as mean ± standard error of the mean, unless otherwise specified. All statistics were performed using S-Plus 2000 (MathSoft Inc, California) and R (The R Project for Statistical Computing, Vienna, Austria).
RESULTS
Baseline Characteristics and Outcome of Treatment
Pre-treatment HBV DNA levels, at t = 0, ranged from 2.8 × 10³ IU/ml to 1.0 × 10⁹ IU/ml (Table 1), with a geometric mean of 6.5±0.2 log10 IU/ml. There were no significant differences in average pre-treatment HBV DNA levels across treatment groups (p=0.39).
HBV DNA levels went below the detection limit of 350 IU/ml at least once during treatment in 36 patients, mostly within the first 24 weeks. Relapses in viral load and biochemical parameters were observed within 12 months of stopping therapy, except for patient 5 (sustained responder for over two years) and patient 41 (seroconverted to anti-HBs antibodies at 8 months post-therapy). Baseline HBV DNA level was the most important factor predicting the patient’s early response to treatment. Patients with undetectable HBV DNA at 8 or 12 weeks of treatment had significantly lower baseline HBV DNA levels, independent of treatment schedule (p=0.008), as previously reported [30].
HBV Decay Patterns
In most patients, HBV DNA levels showed a biphasic decay after treatment initiation (Figure 1). Four patients had only a single decay phase over the first 30 days (P26, P27, P38, P43). The biphasic decay was characterized by an early, rapid decline in HBV, followed by a slower second-phase decrease.
Figure 1.

Representative results of the fit of the model (line) to the HBV DNA level (circles). Each row corresponds to a different treatment protocol (1st row: IFN; 2nd row: LAM; 3rd row: IFN+LAM; 4th row: PEG+LAM; 5th row: PEG; 6th row: ADV+LAM). See methods for full description of fitting procedure.
The average drop in HBV DNA level after 48 hours of treatment was 0.83 log10 IU/ml. This decrease over the first 48 hours differed significantly by treatment regimen: average HBV declines were 1.30 log10 IU/ml, 1.01 log10 IU/ml, 1.05 log10 IU/ml, 0.57 log10 IU/ml, 0.48 log10 IU/ml, and 0.45 log10 IU/ml for patients in the LAM, ADV+LAM, IFN+LAM, PEG+LAM, PEG alone, and IFN alone regimens, respectively (p=0.0008). These differences became less pronounced with time and, at one month, all (except the IFN) groups had similar viral declines (between −2.6 and −3.1 log10, p=0.31); the IFN monotherapy group had a −1.5 log10 decline.
Kinetic Parameters
In Figure 1 we show representative fits of the model to the data (see online supplemental content for all fits). We could not fit the data in those patients for whom therapy induced no or minimal decay (4 cases: P3, P10, P17, P46) – non-responders –, or for whom only one phase of decay was observed (4 cases: P26, P27, P38, P43). The reasons why some patients present these non-biphasic patterns are not known, but this is often the case for large viral dynamics datasets.
In general, the estimated parameters (Table 1) were not significantly different among the treatment groups. Overall, the mean±standard error values for the clearance rate of virions (c) and infected cells (δ) were 1.9±0.4 day−1 and 0.10±0.01 day−1, respectively. The corresponding half-lives were 16.6±1.9 hours for virions and 13.4±2.9 days for infected cells. The average effectiveness (ε) of all treatment regimens was 0.90±0.02, and the average delay (τ) between treatment initiation and its effect on viral load was 9.6±2.4 hours. However, protocols including pegylated IFN-α2a had a significantly larger delay than other treatments (20.6 vs. 9.1 hours, p=0.002).
Baseline HBV DNA level correlated negatively with infected cell half-life (r=−0.55, p=0.0008; Figure 2, filled circles), suggesting that, in HBeAg-negative infection, patients with higher baseline viral levels clear infected cells faster.
Figure 2.

Correlation between infected cell half-lives and baseline HBV DNA levels for HBeAg-negative infection. The symbols correspond to different studies as indicated in the legend (see Table 2), and the best fit regression line is also shown.
Meta-analysis comparison with other viral kinetic studies
In order to compare our results with other available viral dynamics studies of HBV treatment in both HBeAg-positive and -negative patients, a Pubmed search was conducted (see Methods). Table 2 presents a summary of the seven published studies that were used in our meta-analysis. Those papers together with the present study have information on 79 HBeAg-positive patients and 100 HBeAg-negative patients treated with a variety of different antiviral treatment regimens. For each patient, the half-life of free virions and the half-life of infected cells were obtained. The information on baseline viral level was more difficult to use, because different HBV DNA assays were used in the seven studies (Table 2). In four of the studies that did not report IU/ml, we converted baseline HBV DNA levels according to the conversion factors provided by Shyamala et al. [31]. The other two studies [21, 32] either did not report individual baseline HBV DNA levels or used in-house assays, for which the conversion factor was not reported. Importantly, the estimates for the half-lives of free virions and infected cells are not impacted by the specific assay/units used in a given study.
Table 2.
Viral kinetic studies used in the meta-analysis’ comparison of treatment in HBeAg-positive (+) and HBeAg-negative (−) infection (LAM: lamivudine, ETV: entecavir, FAM: famciclovir, ADV: adefovir, EMT: emtricitabine, PEG: pegylated IFN).
| Study | HBeAg | n | Treatment | Sampling |
|---|---|---|---|---|
| Wang et al.[32] | + | 10 | 100mg vs 600mg LAM | 0, 6, 24, 30, 36, 72, 76, 84h, d 5, 6, 7, 10, 14, , 21, 28 |
| Wolters et al.[43] | + | 10 | 4 doses of ETV | 0, 8, 24, 32h, d 3, 4, 6, 7, 10, 14, 21, 28 |
| Lewin et al.[21] | + | 15 | LAM vs LAM+FAM | 0, 24, 48h, d 3, 4, 5, 6, 7, 10, 14, 28, 42, 56, 70, 84 |
| Tsiang et al.[27] | + | 10 | ADV | d 0, 7, 14, 28, 56, 70, 84 |
| Lau et al.[33] | + | 30 | ADV vs ADV+EMT | d 0, 1, 3, 5, 7, 9, 11, 14, 21, 28 |
| Mihm et al.[44] | +/− | 8 | LAM+ADV | d 0, 1, 2, 3, 4, 5, 6, 7, 14, 21, 28, 56 |
| Colombatto et al.[24] | − | 72 | LAM vs LAM+PEG vs PEG | 0, 8, 24, 48h, d 4, 5, 7, 14, 21, 28, 35, 42, 84 |
| Ribeiro et al., present study | − | 42 | Multiple | See methods |
As expected, baseline HBV DNA levels were significantly lower in HBeAg-negative than in HBeAg-positive patients: means 6.3±0.1 vs 7.9±0.1 log10 IU/ml, respectively (p<0.00001). The range in baseline viral levels in HBeAg-negative (range: 3.4–9.5 log10 IU/ml) was 100-fold larger than that in HBeAg-positive infection (range: 5.3–9.7 log10 IU/ml), mostly at the lower end.
We next compared the viral kinetics parameters. The half-life of free virions was significantly shorter in HBeAg-negative than -positive infection (mean=13.1±1.1 h vs 25.2±1.7 h, p<0.00001) (Figure 3a) and the same was true for the half-life of infected cells (mean=12.1±1.4 days vs 16.0±1.7 days, p=0.0001) (Figure 3b). To extend these results, we included three other studies (for a total of 10 studies) that reported means and standard deviations for the kinetic parameters in HBeAg-positive and HBeAg-negative infection and summarize the entire dataset as forest plots in Figure 4. The diamonds, representing the overall parameter estimates in HBeAg-positive and -negative subjects, do not overlap, lending support to our results above.
Figure 3.
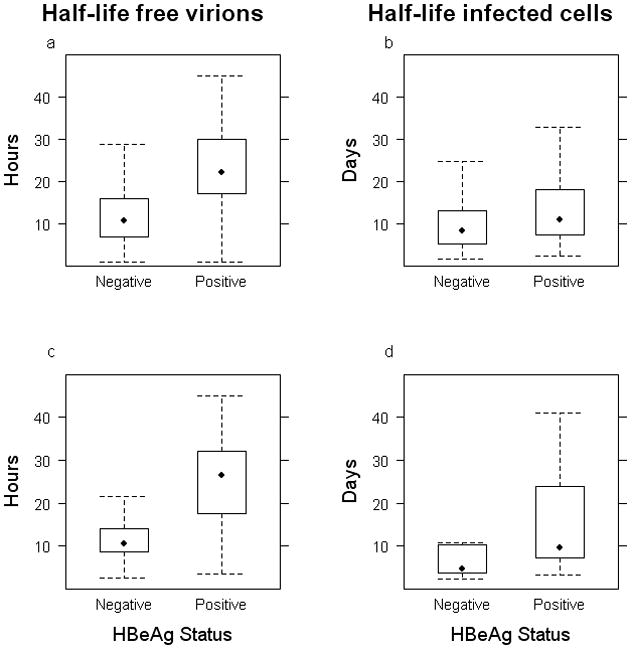
Comparison of the half-lives of free virions and infected cells between infections with HBeAg-negative (Neg) and HBeAg-positive (Pos) HBV strains. a) and b) present the data for all the studies in Table 2, for free virions and infected cells, respectively. c) and d) restrict the data to those studies with similar treatments, frequent early sampling, and models (see text). The bottom and top of the box represents the 25th and 75th percentile of the data, respectively; the whiskers represent 1.5 times the inter-quartile range and give an idea of the range of values in the data; and the symbol inside the box represents the median of the data.
Figure 4.

Forest plots representing the results for (a) virion half-life and (b) infected cell half-life in the different studies analyzed. The vertical line represents the global average of HBeAg-positive (top 8 rows) and the HBeAg-negative (bottom 3 rows) together. Note that study [26] reported the two treatment arms separately as indicated in the two first rows of the graphs. The diamonds indicate the point estimates for the studies in each group, with the width indicating the 95% confidence interval. Each study is indicated by its mean (square) and confidence interval (horizontal line). The size of the square shows the contribution of that study to the summary mean, and this depends on study size and uncertainty.
It could be argued that the different treatments, sampling schedules (Table 2) and modeling approaches affect the interpretation of these estimates [23]. Especially since none of the studies in HBeAg-positive infection used IFN or PEG-IFN. Thus, we compared the half-lives of virus and infected cells only in studies with nucleos(t)ide analogue RTI. The results were consistent: the half-lives of virus (p<0.00001) and infected cells (p=0.013) are faster in HBeAg-negative infection. To make this comparison even more strict, we repeated this last analysis with data from two studies conducted by us, with similar sampling and, crucially, the same fitting procedure (present work and [33]) (Figure 3c,d). The conclusions were similar for both the free virion half-life (p=0.00017) and the infected cell half-life (p=0.029).
Analyzing all the patients infected with HBeAg-negative HBV (n=81) confirmed our results above that the half-life of infected cells is negatively correlated with baseline HBV DNA level (r=−0.51, p<0.00001) (Figure 2). This was not the case in the HBeAg-positive HBV patients (n=48, p=0.73). Importantly, if we restrict the analysis of HBeAg-negative infection to those patients who have baseline viral load in a similar range to the HBeAg-positive cohort, we find that the negative correlation still holds (r=−0.45, p=0.0003, n=63). Thus, this relationship between infected cell half-life and baseline viral load is a characteristic of HBeAg-negative infection, and not an artifact of different viral load levels in these patients. We then compared pre-treatment steady state viral production, calculated by multiplying the free virion clearance rate by baseline viral load. There was a significantly larger virion production in HBeAg-positive than -negative infection (7.8±0.15 vs 6.4±0.15 log10 IU/ml/day, p<0.00001), consistent with the higher viral load at baseline observed in the former case.
DISCUSSION
In this study we have analyzed the viral dynamics in HBe antigen-negative hepatitis B virus infection, based on patient response to different antiviral treatment protocols involving IFN-α and/or nucleos(t)ide analogues. By using a standard model [19] of viral infection, we were able to estimate viral clearance, infected cell loss rate and the effectiveness at stopping viral production of different treatment protocols. Overall, we did not detect significant differences in viral kinetic parameters among the different study groups. However, we cannot make definitive conclusions about the differences in treatment regimens, because the inclusion in each arm was not random (see Methods).
We also conducted a meta-analysis to compare our results to those of all previous viral kinetic studies that included data for individual patients (Table 2). We found a significantly faster viral clearance rate (and thus shorter viral half-life) for HBeAg-negative infection than for HBeAg-positive infection. The viral half-life in HBeAg-positive infection was ~25 hours, whereas in HBeAg-negative infection it was ~13 hours. This observation may be related to the lower viral levels at baseline in the latter group of patients, as it was reported that faster virion clearance correlate with lower baseline viral loads [34, 35]. However, we did not find such a correlation in our dataset or meta-analyses, when we considered just HBeAg-negative or HBeAg-positive patients, consistent with previous observations [36]. On the other hand, our observation of shorter half-life of infected cells in HBeAg-negative infection could contribute to the lower baseline viral load seen in these patients, since each infected cell should produce fewer virions over its shorter lifespan. This effect is in addition to lower viral productivity in HBeAg-negative infection vs. HBeAg-positive infection, since a recent study found that the number of intrahepatic replicating HBV DNA molecules per cccDNA was much lower in HBeAg-negative infection [37].
In our meta-analysis we included all the extant studies with viral dynamic data. This implies that we collected data generated by different groups, and with different treatment protocols, different assays, and different viral kinetics models. Since this variability could bias our results, we also repeated our comparisons of HBeAg-positive and –negative infection using more homogeneous studies, including two studies conducted by us, with similar sampling and the same modeling methodology. Restricting the analyses in this way helps control for the effect of different studies. Crucially, in these more restricted analyses, we also reached the same conclusions (see also [38]).
Cytoplasmic HBeAg can enter both the major histocompatibility complex (MHC) class I pathway and the MHC class II pathway, but HBcAg probably does not enter the class II pathway [39]. Therefore, hepatocytes producing HBeAg may be targeted for destruction through both CD8-positive and/or CD4-positive pathways. Moreover, hepatocytes expressing concomitantly HBcAg and HBeAg epitopes could present a better immune target for CTLs, compared with cells expressing only HBcAg epitopes [40, 41]. These observations suggest a stronger immune response in the context of HBeAg-positive infection. In contrast, secreted HBeAg has been suggested to have a tolerogenic function, down-regulating the immune response against HBV [12, 40, 42]. Thus, in HBeAg-negative infection lack of this tolerogenic effect may lead to a stronger immune response against the virus. What can the present study say about these mutually exclusive propositions? While exact mechanisms remain unknown, our findings of faster clearance of virus and infected cells are compatible with a stronger immune response in the setting of HBeAg-negative infection. This indicates that the loss of the immunomodulatory functions of the secreted e protein has a dominating effect over any additional immune response it may elicit.
In conclusion, analysis of HBeAg-negative early viral kinetics under various antiviral treatments showed faster dynamics of HBV DNA and infected hepatocytes in comparison with HBeAg-positive chronic infection. These results reveal the dual role of the immune response in maintaining lower viral levels and inducing faster turnover of infected cells, the latter of which may be responsible for the more aggressive nature of HBeAg-negative infection.
Supplementary Material
Acknowledgments
Financial Support: Portions of this work were done under the auspices of the United States Department of Energy under contract DE-AC52-06NA25396 and supported by NIH grants AI28433-19 (ASP), RR06555-18 (ASP), and P20-RR18754 (RMR). Portions of this work are part of the activity of the VIRGIL European Network of Excellence on Antiviral Drug Resistance supported by a grant (LSHM-CT-2004-503359) from the Priority 1 “Life Sciences, Genomics and Biotechnology for Health” programme in the 6th Framework Programme of the European Union and have been supported by the French National Agency for AIDS and Viral Hepatitis Research (ANRS).
Abbreviations
- HBeAg
hepatitis B e antigen
- HBV
hepatitis B virus
- HBsAg
hepatitis B s antigen
- CTL
cytotoxic T lymphocytes
Footnotes
Disclosures: The authors have nothing to disclose, except that Dr Pawlotsky received research grants from Gilead and served as an advisor for Gilead, Bristol-Myers Squibb and Roche.
Part of this work was presented at the Annual Meeting of the American Association for the Study of Liver Disease, San Francisco 2005.
References
- 1.Lavanchy D. Worldwide epidemiology of HBV infection, disease burden, and vaccine prevention. J Clin Virol. 2005;34 (Suppl 1):S1–3. doi: 10.1016/s1386-6532(05)00384-7. [DOI] [PubMed] [Google Scholar]
- 2.Maddrey WC. Hepatitis B: an important public health issue. J Med Virol. 2000;61:362–6. doi: 10.1002/1096-9071(200007)61:3<362::aid-jmv14>3.0.co;2-i. [DOI] [PubMed] [Google Scholar]
- 3.Funk ML, Rosenberg DM, Lok AS. World-wide epidemiology of HBeAg-negative chronic hepatitis B and associated precore and core promoter variants. J Viral Hepat. 2002;9:52–61. doi: 10.1046/j.1365-2893.2002.00304.x. [DOI] [PubMed] [Google Scholar]
- 4.Knoll A, Rohrhofer A, Kochanowski B, Wurm EM, Jilg W. Prevalence of precore mutants in anti-HBe-positive hepatitis B virus carriers in Germany. J Med Virol. 1999;59:14–8. [PubMed] [Google Scholar]
- 5.Chu CJ, Keeffe EB, Han SH, et al. Prevalence of HBV precore/core promoter variants in the United States. Hepatology. 2003;38:619–28. doi: 10.1053/jhep.2003.50352. [DOI] [PubMed] [Google Scholar]
- 6.Hadziyannis SJ, Vassilopoulos D. Hepatitis B e antigen-negative chronic hepatitis B. Hepatology. 2001;34:617–24. doi: 10.1053/jhep.2001.27834. [DOI] [PubMed] [Google Scholar]
- 7.Hadziyannis SJ. Treatment paradigms on hepatitis B e antigen-negative chronic hepatitis B patients. Expert Opin Investig Drugs. 2007;16:777–86. doi: 10.1517/13543784.16.6.777. [DOI] [PubMed] [Google Scholar]
- 8.Chu CJ, Hussain M, Lok AS. Quantitative serum HBV DNA levels during different stages of chronic hepatitis B infection. Hepatology. 2002;36:1408–15. doi: 10.1053/jhep.2002.36949. [DOI] [PubMed] [Google Scholar]
- 9.Laras A, Koskinas J, Avgidis K, Hadziyannis SJ. Incidence and clinical significance of hepatitis B virus precore gene translation initiation mutations in e antigen-negative patients. J Viral Hepat. 1998;5:241–8. doi: 10.1046/j.1365-2893.1998.00109.x. [DOI] [PubMed] [Google Scholar]
- 10.Hadziyannis SJ, Papatheodoridis GV. Hepatitis B e antigen-negative chronic hepatitis B: natural history and treatment. Semin Liver Dis. 2006;26:130–41. doi: 10.1055/s-2006-939751. [DOI] [PubMed] [Google Scholar]
- 11.Bonino F, Rosina F, Rizzetto M, et al. Chronic hepatitis in HBsAg carriers with serum HBV-DNA and anti-HBe. Gastroenterology. 1986;90:1268–73. doi: 10.1016/0016-5085(86)90395-1. [DOI] [PubMed] [Google Scholar]
- 12.Milich D, Liang TJ. Exploring the biological basis of hepatitis B e antigen in hepatitis B virus infection. Hepatology. 2003;38:1075–86. doi: 10.1053/jhep.2003.50453. [DOI] [PubMed] [Google Scholar]
- 13.Rehermann B, Nascimbeni M. Immunology of hepatitis B virus and hepatitis C virus infection. Nat Rev Immunol. 2005;5:215–29. doi: 10.1038/nri1573. [DOI] [PubMed] [Google Scholar]
- 14.Hadziyannis SJ, Papatheodoridis GV, Vassilopoulos D. Treatment of HBeAg-negative chronic hepatitis B. Semin Liver Dis. 2003;23:81–8. doi: 10.1055/s-2003-37584. [DOI] [PubMed] [Google Scholar]
- 15.Fattovich G. Natural history and prognosis of hepatitis B. Semin Liver Dis. 2003;23:47–58. doi: 10.1055/s-2003-37590. [DOI] [PubMed] [Google Scholar]
- 16.Perelson AS. Modelling viral and immune system dynamics. Nat Rev Immunol. 2002;2:28–36. doi: 10.1038/nri700. [DOI] [PubMed] [Google Scholar]
- 17.Perelson AS, Herrmann E, Micol F, Zeuzem S. New kinetic models for the hepatitis C virus. Hepatology. 2005;42:749–54. doi: 10.1002/hep.20882. [DOI] [PubMed] [Google Scholar]
- 18.Perelson AS, Ribeiro RM. Hepatitis B virus kinetics and mathematical modeling. Semin Liver Dis. 2004;24 (Suppl 1):11–6. doi: 10.1055/s-2004-828673. [DOI] [PubMed] [Google Scholar]
- 19.Ribeiro RM, Lo A, Perelson AS. Dynamics of hepatitis B virus infection. Microbes Infect. 2002;4:829–35. doi: 10.1016/s1286-4579(02)01603-9. [DOI] [PubMed] [Google Scholar]
- 20.Neumann AU. Hepatitis B viral kinetics: a dynamic puzzle still to be resolved. Hepatology. 2005;42:249–54. doi: 10.1002/hep.20831. [DOI] [PubMed] [Google Scholar]
- 21.Lewin SR, Ribeiro RM, Walters T, et al. Analysis of hepatitis B viral load decline under potent therapy: complex decay profiles observed. Hepatology. 2001;34:1012–20. doi: 10.1053/jhep.2001.28509. [DOI] [PubMed] [Google Scholar]
- 22.Lewin S, Walters T, Locarnini S. Hepatitis B treatment: rational combination chemotherapy based on viral kinetic and animal model studies. Antiviral Res. 2002;55:381–96. doi: 10.1016/s0166-3542(02)00071-2. [DOI] [PubMed] [Google Scholar]
- 23.Sypsa VA, Mimidis K, Tassopoulos NC, et al. A viral kinetic study using pegylated interferon alfa-2b and/or lamivudine in patients with chronic hepatitis B/HBeAg negative. Hepatology. 2005;42:77–85. doi: 10.1002/hep.20738. [DOI] [PubMed] [Google Scholar]
- 24.Colombatto P, Civitano L, Bizzarri R, et al. A multiphase model of the dynamics of HBV infection in HBeAg-negative patients during pegylated interferon-alpha2a, lamivudine and combination therapy. Antivir Ther. 2006;11:197–212. [PubMed] [Google Scholar]
- 25.Hoofnagle JH, Doo E, Liang TJ, Fleischer R, Lok AS. Management of hepatitis B: summary of a clinical research workshop. Hepatology. 2007;45:1056–75. doi: 10.1002/hep.21627. [DOI] [PubMed] [Google Scholar]
- 26.Lau GK, Tsiang M, Hou J, et al. Combination therapy with lamivudine and famciclovir for chronic hepatitis B-infected Chinese patients: a viral dynamics study. Hepatology. 2000;32:394–9. doi: 10.1053/jhep.2000.9143. [DOI] [PubMed] [Google Scholar]
- 27.Tsiang M, Rooney JF, Toole JJ, Gibbs CS. Biphasic clearance kinetics of hepatitis B virus from patients during adefovir dipivoxil therapy. Hepatology. 1999;29:1863–9. doi: 10.1002/hep.510290626. [DOI] [PubMed] [Google Scholar]
- 28.Neumann AU, Lam NP, Dahari H, et al. Hepatitis C viral dynamics in vivo and the antiviral efficacy of interferon-alpha therapy. Science. 1998;282:103–7. doi: 10.1126/science.282.5386.103. [DOI] [PubMed] [Google Scholar]
- 29.Lewis S, Clarke M. Forest plots: trying to see the wood and the trees. British Medical Journal. 2001;322:1479–1480. doi: 10.1136/bmj.322.7300.1479. [DOI] [PMC free article] [PubMed] [Google Scholar]
- 30.Kau A, Vermehren J, Sarrazin C. Treatment predictors of a sustained virologic response in hepatitis B and C. J Hepatol. 2008;49:634–51. doi: 10.1016/j.jhep.2008.07.013. [DOI] [PubMed] [Google Scholar]
- 31.Shyamala V, Arcangel P, Cottrell J, et al. Assessment of the target-capture PCR hepatitis B virus (HBV) DNA quantitative assay and comparison with commercial HBV DNA quantitative assays. J Clin Microbiol. 2004;42:5199–204. doi: 10.1128/JCM.42.11.5199-5204.2004. [DOI] [PMC free article] [PubMed] [Google Scholar]
- 32.Wang CC, Holte S, Huang ML, et al. Kinetics of hepatitis B viral load during 48 weeks of treatment with 600 mg vs 100 mg of lamivudine daily. J Viral Hepat. 2004;11:443–7. doi: 10.1111/j.1365-2893.2004.00523.x. [DOI] [PubMed] [Google Scholar]
- 33.Lau GK, Cooksley H, Ribeiro RM, et al. Impact of early viral kinetics on T-cell reactivity during antiviral therapy in chronic hepatitis B. Antivir Ther. 2007;12:705–18. [PubMed] [Google Scholar]
- 34.Murray JM, Purcell RH, Wieland SF. The half-life of hepatitis B virions. Hepatology. 2006;44:1117–21. doi: 10.1002/hep.21364. [DOI] [PubMed] [Google Scholar]
- 35.Dandri M, Murray JM, Lutgehetmann M, Volz T, Lohse AW, Petersen J. Virion half-life in chronic hepatitis B infection is strongly correlated with levels of viremia. Hepatology. 2008;48:1079–86. doi: 10.1002/hep.22469. [DOI] [PubMed] [Google Scholar]
- 36.Dahari H, Cotler SJ, Layden TJ, Perelson AS. Hepatitis B virus clearance rate estimates. Hepatology. 2009;49:1779–80. doi: 10.1002/hep.22874. author reply 1780–1. [DOI] [PubMed] [Google Scholar]
- 37.Volz T, Lutgehetmann M, Wachtler P, et al. Impaired intrahepatic hepatitis B virus productivity contributes to low viremia in most HBeAg-negative patients. Gastroenterology. 2007;133:843–52. doi: 10.1053/j.gastro.2007.06.057. [DOI] [PubMed] [Google Scholar]
- 38.Lewin SR, Ribeiro RM, Avihingsanon A, et al. Viral Dynamics of Hepatitis B Virus DNA in Human Immunodeficiency Virus-1–Hepatitis B Virus Coinfected Individuals: Similar Effectiveness of Lamivudine, Tenofovir, or Combination Therapy. Hepatology. 2009;49:1113–1121. doi: 10.1002/hep.22754. [DOI] [PMC free article] [PubMed] [Google Scholar]
- 39.Diepolder HM, Ries G, Jung MC, et al. Differential antigen-processing pathways of the hepatitis B virus e and core proteins. Gastroenterology. 1999;116:650–7. doi: 10.1016/s0016-5085(99)70187-3. [DOI] [PubMed] [Google Scholar]
- 40.Hadziyannis SJ, Vassilopoulos D. Immunopathogenesis of hepatitis B e antigen negative chronic hepatitis B infection. Antiviral Res. 2001;52:91–8. doi: 10.1016/s0166-3542(01)00173-5. [DOI] [PubMed] [Google Scholar]
- 41.Frelin L, Wahlstrom T, Tucker AE, et al. A mechanism to explain the selection of the hepatitis e antigen-negative mutant during chronic hepatitis B virus infection. J Virol. 2009;83:1379–92. doi: 10.1128/JVI.01902-08. [DOI] [PMC free article] [PubMed] [Google Scholar]
- 42.Milich DR, Schodel F, Hughes JL, Jones JE, Peterson DL. The hepatitis B virus core and e antigens elicit different Th cell subsets: antigen structure can affect Th cell phenotype. J Virol. 1997;71:2192–201. doi: 10.1128/jvi.71.3.2192-2201.1997. [DOI] [PMC free article] [PubMed] [Google Scholar]
- 43.Wolters LM, Hansen BE, Niesters HG, DeHertogh D, de Man RA. Viral dynamics during and after entecavir therapy in patients with chronic hepatitis B. J Hepatol. 2002;37:137–44. doi: 10.1016/s0168-8278(02)00115-0. [DOI] [PubMed] [Google Scholar]
- 44.Mihm U, Gartner BC, Faust D, et al. Viral kinetics in patients with lamivudine-resistant hepatitis B during adefovir-lamivudine combination therapy. J Hepatol. 2005;43:217–24. doi: 10.1016/j.jhep.2005.02.037. [DOI] [PubMed] [Google Scholar]
Associated Data
This section collects any data citations, data availability statements, or supplementary materials included in this article.