Abstract
Background
ATP-binding cassette (ABC) proteins and cytochrome P450 (CYP) enzymes regulate the bioavailability of HIV-1 antiretroviral therapeutic (ART) drugs, non-nucleoside reverse transcriptase inhibitors (NNRTIs) and protease inhibitors (PIs). They are also involved in regulating, and responding to, oxidative stress in various tissues and organs including liver. The present study is designed to assess the effect of alcohol on the ABCC1 and CYP enzymes involved in the metabolism of NNRTIs and PIs (CYP2B6, CYP2D6, CYP3A4) and oxidative stress (CYP1A1, CYP2A6, CYP2E1) in U937 macrophages. The U937 cell line has been utilized as an in vitro model of human macrophages.
Methods
The expression levels of the ABCC1 and CYP enzymes in U937 macrophages were characterized in terms of mRNA quantification, protein analysis, and assays for functional activity. In addition, oxidative stress was monitored by measuring the activities of oxidative stress marker enzymes and production of reactive oxygen species (ROS).
Results
The order of mRNA expression in U937 macrophages was ABCC1 ~ CYP2A6 > CYP3A4 ~ CYP2E1 ~ CYP1A1 > CYP2D6 > CYP2B6. Alcohol (100 mM) increased the mRNA levels of ABCC1 and CYP2A6 (200%), CYP2B6 and CYP3A4 (150%), and CYP2E1 (400%) compared with the control. Alcohol caused significant upregulation of ABCC1, CYP2A6, CYP2E1, and CYP3A4 proteins (50-85%) and showed >50% increase in the specific activity of CYP2A6 and CYP3A4 in U937 macrophages. Furthermore, alcohol increased the production of ROS and significantly enhanced the activity of oxidative stress marker enzymes, superoxide dismutase and catalase in U937 macrophages.
Conclusions
Our study showed that alcohol causes increases in genetic and functional expressions of ABCC1 and CYP enzymes in U937 macrophages. This study has clinical implications in alcoholic HIV-1 individuals, because alcohol consumption is reported to reduce the therapeutic efficacy of NNRTIs and PIs and increases oxidative stress.
Keywords: Alcohol, Cytochrome P450, ABCC1, antiretroviral therapy, oxidative stress
Introduction
ATP-binding cassette (ABC) transporters are responsible for effluxing antiretroviral therapeutic (ART) drugs, including non-nucleoside reverse transcriptase inhibitors (NNRTIs) and protease inhibitors (PIs) (Lee et al., 1998; Ronaldson et al., 2008). ABCC1 is an ABC transporter that is not only responsible for transporting antiretrovirals, but it is also involved in regulating oxidative stress (Cole and Deeley, 2010; Deeley et al., 2006). NNRTIs and PIs are predominantly metabolized by cytochrome P450s (CYPs) in the liver (Anzenbacher and Anzenbacherová, 2001; Walubo, 2007). Although the majority of NNRTIs and PIs are metabolized by CYP3A4, some of these drugs are also susceptible to metabolism by CYP1A2, CYP2B6, CYP2C9, CYP2C19, CYP2D6, and CYP3A5 (Walubo, 2007). The simultaneous presence of ABC drug transporters and CYP enzymes are known to alter drug bioavailability, including NNRTIs and PIs (Pal and Mitra, 2006).
Alcohol-induced liver damage is associated with the induction of CYP2A6, CYP2El, and CYP3A4, which can metabolize alcohol and generate acetaldehyde and lipid peroxidation-derived protein-aldehyde adducts (Lu and Cederbaum, 2008; Niemela et al., 2000). In addition, CYP1A1, CYP1A2, CYP2A6, CYP2A13, and CYP3A4 are known to activate numerous polycyclic aromatic hydrocarbons and aromatic amines into genotoxic and carcinogenic compounds (Fukami et al., 2008; Nebert et al., 2004).
Monocytes/macrophages are one of the important cellular targets of HIV-1 replication and also function as critical viral reservoir (Aquaro et al., 1997; Igarashi et al., 2001; Kedzierska and Crowe, 2002; Montaner et al., 2006). It has been shown that virus residing in monocytes/macrophages requires significantly higher concentration of PI (Aquaro et al., 2006; Perno et al., 1998). In view of existing information that alcohol affects CYPs' expression in the liver (Lu and Cederbaum, 2008; Niemela et al., 2000), it becomes important to determine the effect of alcohol in monocytes/macrophages. In the present study, we investigated the role of alcohol on ABCC1 and CYP enzymes in U937-derived macrophages, which is a widely used cell line for primary human macrophages, and is free from the complication of ABCC1 and CYPs' single nucleotide polymorphism (Kerb et al., 2001; Zanger et al., 2008).
Materials and Methods
Cell culture and alcohol treatment
The U937 monocytic cell line was obtained from ATCC (Manassas, VA). U937 monocytes (undifferentiated) cells were grown in Roswell Park Memorial Institute (RPMI) 1640 media (Sigma Aldrich, St. Louis, MO), supplemented with 1% gentamicine at 37°C in a humidified incubator with 5% CO2. U937 monocytes (106 cells) were differentiated into macrophages by 80 nM phorbol 12-myristate 13-acetate (PMA) in 12-well plate containing 1.5 ml RPMI 1640 media. Differentiated cells formed a uniform layer of cells (~80% confluent) in 3 days. Alcohol experiment was optimized in a 12-well plate using different doses of alcohol. The plate was kept in a reservoir containing the same concentration of alcohol in a 100 ml water to prevent its evaporation. In addition, the alcohol dose in a fresh media was repeated every 6 h to constantly maintain its concentration during the treatment. Then, qRTPCR for multiple genes was performed from several independent treatments for consistent results. Finally, alcohol treatments for quantitative reverse transcriptase polymerase chain reaction (qRTPCR), western blotting, and activity were performed in triplicate in 12-well plates simultaneously, and each experiment was independently repeated twice. The control (cells grown simultaneously in the same media without alcohol) and alcohol-treated cells were harvested at the times indicated.
RNA extraction and qRTPCR
Total RNA was isolated using Qiagen RNeasy kit (Qiagen, Valencia, CA) according to manufacturer's protocols. RNA (100 ng) from each sample was reverse-transcribed into cDNA using the High Capacity cDNA Reverse Transcription Kit (Applied Biosystems, Foster City, CA) according to the manufacturer's protocol. qRTPCR was performed, using cDNA that was generated from the reverse transcription of RNA in a 96-well plate as according to supplier's instructions (TaqMan® Gene Expression Kit, Applied Biosystems) using the iCycler iQ system (BioRad Laboratories, Hercules, CA). All the primers and probes from Applied Biosystems were as follows: ABCB1, Hs00184500_m1; CYP1A1, Hs01054794_m1; CYP1A2, Hs01070369_m1; CYP2A6, Hs0071162_m1; CYP2A13, Hs00426372_m1; CYP2B6, Hs03044636_m1; CYP2C9, Hs00426397_m1; CYP2C19, Hs00426387_m1; CYP2D6, Hs_00164385_m1; CYP2E1, Hs00559367_m1; CYP3A4, Hs00430021_m1; CYP3A5, Hs0024417_m1. Relative gene expression was calculated for each gene by the 2−ΔΔCt method using glyceraldehyde 3-phosphate dehydrogenase (GAPDH) as an endogenous control. Alcohol did not alter GAPDH gene expression significantly under our experimental conditions in U937 cells (data not shown).
Western blotting
Total cell lysates were prepared in HEPES buffer, pH 7.2, containing 1% Triton-X, 10% glycerol, and 1X protease inhibitor cocktail. 20 μg total proteins were run on a mini gel (4% stacking, 12% separating SDS-PAGE). Following electrophoretic separation, gels were transferred to polyvinylidene fluoride membranes overnight at 20 V, 4°C. Transferred blots were blocked in 5% non-fat dry milk and incubated overnight with primary antibody (1:1000 dilution; Santa Cruz Biotechnoloy Inc., Santa Cruz, CA) followed by 2 h incubation with an appropriate secondary antibody (1:1500 dilution; Santa Cruz Biotechnology Inc.). Proteins were visualized by BM chemiluminscence blotting substrate (Roche Diagnostic, Indianapolis, IN) using the Alpha Innotech FluorChem HD2 gel documentation system (Alpha Innotech, San Leandro, CA), and the densitometry data were analyzed using AlphaEase FC StandAlone software (version 6.0.0.14; Alpha Innotech). β-actin served as an internal loading control to normalize the expression of proteins of interest.
CYP enzyme activity
CYP3A4 activity was determined in cell extracts using 7-benzyloxy-4-(trifluoromethyl) coumarin (7-BFC; Invitrogen, Carlsbad, CA) and cumene-hydroperoxide (CuOOH) in the presence of cytochrome b5 as described previously (Kumar et al., 2006). Similarly, CYP2A6 activity was determined using coumarin (Sigma-Aldrich) and CuOOH as described for CYP3A4. The cells were re-suspended in 500 μl HEPES buffer (0.1 M, pH 7.4) and homogenized for 20 sec. Then, a 90 μl reaction mixture in a 96-well microplate was prepared that contained: 50 μl cell extracts (5 μg protein), 10 U of polymyxin B sulfate (Sigma-Aldrich), 20 pmoles cytochrome b5, and substrates (50 μM 7-BFC or 100 μM coumarin). Cytochrome b5 from rat liver was prepared as described previously (Harlow and Halpert, 1997). In a parallel experiment, 50 μM nicotine (Sigma-Aldrich), a CYP2A6 inhibitor, and 25 μM ketoconazole (Sigma-Aldrich, a CYP3A4 inhibitor, were included in the respective reaction mixtures. Upon incubation for 10 min at room temperature, the background fluorescence intensity was measured at λex = 405 nm and λem = 535 nm using LB70 fluorescence plate reader (Titertek, Huntsville, AL). Finally, 10 μl of 25 mM CuOOH (2.5 mM final concentration) was added to initiate the reaction and the fluorescence was measured every 2.5 min for up 10 min. The concentration of the products, 7-hydroxy-coumarin and 7- hydroxyl-4-(trifluoromethyl) coumarin, were measured by using a standard curve generated for these compounds. The specific activity was defined as pmoles of product formed/min/mg of total protein.
Protein measurements
The protein concentrations for western blot and CYP activity were determined using a BCA protein assay kit (Thermo Scientific, Rockford, IL).
Measurements of reactive oxygen species (ROS)
ROS measurements were performed essentially as described (McCartney et al., 2008). In brief, the production of ROS was measured by flow cytometry using the fluorogenic dye dichlorofluoroscein diacetate (DCFDA) (Invitrogen). U937 macrophages were incubated with 0 and 100 mM alcohol for 12 and 24 h or with hydrogen peroxide (H2O2, 1 mM) as a positive control. The medium was replaced by PBS (1% paraformaldehyde) including 10 μM DCFDA. The cells were kept in a humidified incubator at 37°C for 30 min and then were washed with PBS containing 1% paraformaldehyde. DCF emission was immediately measured at 525 ± 20 nm by flow cytometry (BD Biosciences, San Jose, CA), and mean fluorescence intensity (MFI) presented by the software was analyzed.
Assays for oxidative stress marker enzymes
Superoxide dismutase (SOD) and catalase assays were performed as described by the manufacturer's protocol (Cayman Chemicals, Ann Arbor, MI). In brief, the total cell pellet was resuspended in HEPES buffer, pH 7.2, 1X protease inhibitor cocktail. The homogenized cell suspensions were centrifuged and supernatant was collected for the enzyme assays. SOD activity was assayed by measuring the dismutation of superoxide radicals generated by xanthine oxidase and hypoxanthine into peroxide in a 96 well format. Catalase assay was measured based on the reaction with methanol in the presence of H2O2. The formaldehyde produced was measured spectrophotometrically (6800 UV/Visible spectrophotometer, GENWAY, Grants Pass, OR) with 4-amino-3-hydrazino-5-mercapto-1,2,4-triazole (Purpald) as the chromogen.
Statistical Analyses
Statistical analysis for qRTPCR, western, and enzyme activity data was performed to determine mean ± SD, and a t-test was applied to determine p values. A p value of ≤0.05 was considered significant.
Results
Expression of ABC efflux proteins and CYP enzymes in U937 macrophages
The basal levels of mRNA of ART drug efflux protein ABCC1, ART drug-metabolizing CYP enzymes (1A2, 2B6, 2C9, 2C19, 2D6, 3A4, and 3A5), and oxidative stress-related CYP enzymes (1A1, 2A6, 2A13, and 2E1) were determined in U937 macrophages (data not shown). The order of mRNA expression in U937 macrophages was ABCC1 ~ CYP2A6 > CYP3A4 ~ CYP2E1 ~ CYP1A1 > CYP2D6 > CYP2B6, which is similar to the expression of these mRNAs in the liver (Anzenbacher and Anzenbacherová, 2001; Freeman et al., 2007).
Effect of alcohol on the expression of ABCC1 and ART-metabolizing CYP enzymes
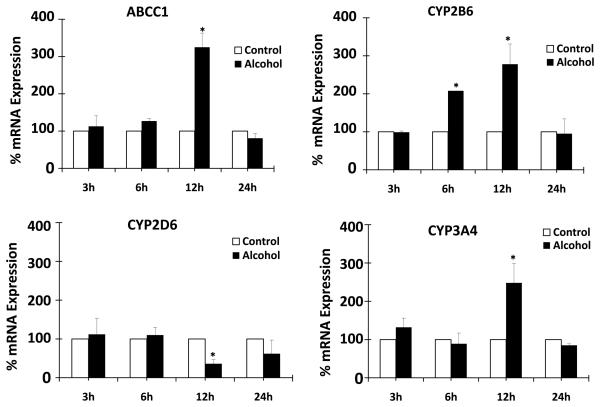
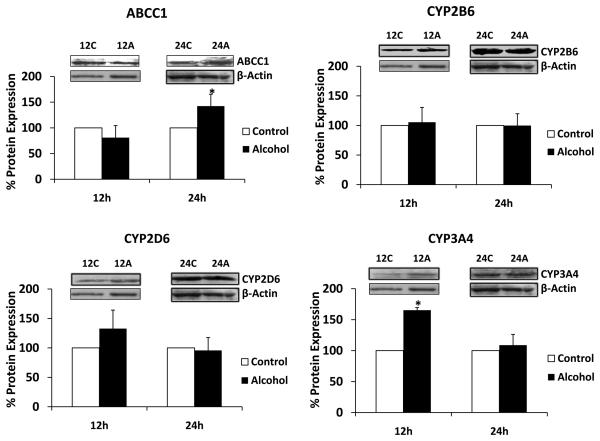
We determined the effect of alcohol on mRNA and protein expressions of ART efflux protein ABCC1, major ART-metabolizing enzyme CYP3A4, and minor ART-metabolizing enzymes CYP2B6 and CYP2D6. All the experiments were performed using 100 mM alcohol for 3-24 h. Alcohol resulted in a significant upregulation of mRNA of ABCC1 (200 ± 40% at 12 h), CYP2B6 (100 ± 5% at 6 h and 175 ± 50% at 12 h), and CYP3A4 (150 ± 50% at 12 h) (Fig. 1). In contrast, there was a significant decrease in CYP2D6 mRNA in U937 macrophages treated with alcohol for 12 h (Fig. 1). Western blot analysis was performed with samples treated with alcohol for 12 and 24 h because we observed the majority of mRNA induction by alcohol at 12 h. ABCC1 at 24 h showed approximately 40 ± 20% enhanced protein expression, whereas expression of CYP3A4 at 12 h was increased by approximately 70 ± 5% compared to the control (Fig. 2). On the other hand, CYP2B6 did not show significant increase in protein expression as a result of alcohol treatment.
Figure 1. Effect of alcohol on mRNA expression of ABCC1, CYP2B6, CYP2D6, and CYP3A4.
The mRNA expression levels using quantitative reverse transcriptase polymerase chain reaction are presented in percent, with 100% expression normalized for the untreated cells at every time point. Expression of each gene was normalized using glyceraldehyde 3-phosphate dehydrogenase. The Alcohol treatment times (h) are presented in X-axis, while % expression is presented in Y-axis. * represents p≤0.05 compared to respective controls.
Figure 2. Effect of alcohol on protein expression of ABCC1, CYP2B6, CYP2D6, and CYP3A4.
The protein expression levels using western blot analysis followed by their quantification are presented in percent, with 100% expression normalized for the untreated cells at every time point. Expression of each protein was normalized using β-actin. C represents control (untreated samples) and A represents alcohol-treated at respective time in hour. The molecular weight of the proteins are as follows: β-actin (42 kDa), ABCC1 (190 kDa), CYP2A6 (55 kDa), (56 kDa), and CYP2D6 (60 kDa), CYP2E1 (51 kDa), and CYP3A4 (56 kDa). The quantitative analysis was performed using at least three independent blots from three independent treatments as described in the Materials and Methods section. Alcohol treatment times (h) are presented in X-axis, while % expression is presented in Y-axis. * represents p≤0.05 compared to respective controls.
Effect of alcohol on the expression of oxidative stress-related CYP enzymes
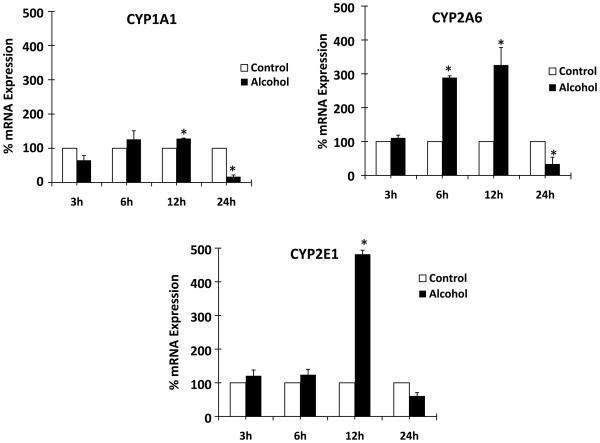
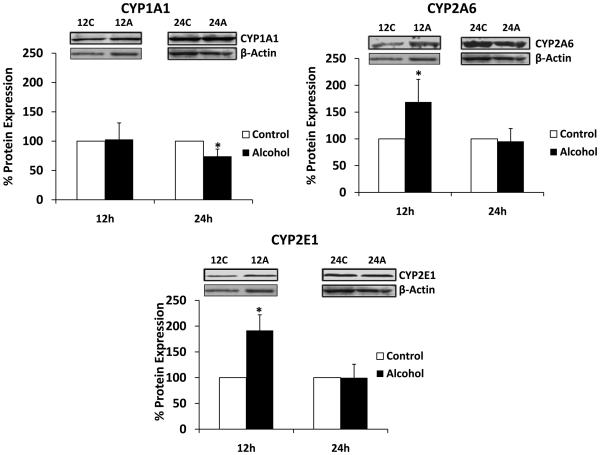
We determined the effect of 100 mM alcohol on the mRNA and protein expressions of oxidative stress-related genes CYP1A1, CYP2A6, and CYP2E1 at 3, 6, 12, and 24 h. Alcohol resulted in upregulation of mRNA of CYP1A1 (40 ± 5% at 12 h), CYP2A6 (175 ± 10% at 6 h and 225 ± 60% at 12 h), and CYP2E1 (400 ± 20% at 12 h) (Fig. 3). In contrast to the early time points, alcohol caused a significant decrease in mRNA levels of CYP1A1 (5-fold) and CYP2A6 (2.5-fold) at 24 h. Further, western analysis was performed with samples prepared after alcohol treatment at 12 and 24 h (Fig. 4). CYP2A6 and CYP2E1 showed approximately 70 ± 40% and 90 ± 30% enhanced protein expression at 12 h upon alcohol treatment. In contrast, alcohol resulted in a significantly decreased (~25%) protein expression of CYP1A1 at 24 h.
Figure 3. Effect of alcohol on mRNA expression of CYP1A1, CYP2A6, and CYP2E1.
The mRNA expression levels using quantitative reverse transcriptase polymerase chain reaction are presented in percent, with 100% expression normalized for the untreated cells at every time point. Expression of each gene was normalized using glyceraldehyde 3-phosphate dehydrogenase. Alcohol treatment times (h) are presented in X-axis, while % expression is presented in Y-axis. * represents p≤0.05 compared to respective controls.
Figure 4. Effect of alcohol on protein expression of CYP1A1, CYP2A6, and CYP2E1.
The protein expression levels were measured using western blot followed by their quantification, which are presented in percent with 100% expression was normalized for the untreated cells at every time point. Expression of each protein was normalized using β-actin. C represents control (untreated samples) and A represents alcohol-treated at respective time in hour. The molecular weight of the proteins are as follows: β-actin (42 kDa), CYP1A1 (54 kDa), CYP2A6 (55 kDa), and CYP2E1 (51 kDa). The quantitative analysis was performed using at least three independent blots from three independent treatments as described in the Materials and Methods section. Alcohol treatment times (h) are presented in X-axis, while % expression is presented in Y-axis. * represents p≤0.05 compared to respective controls.
Effect of alcohol on CYP2A6 and CYP3A4 activity
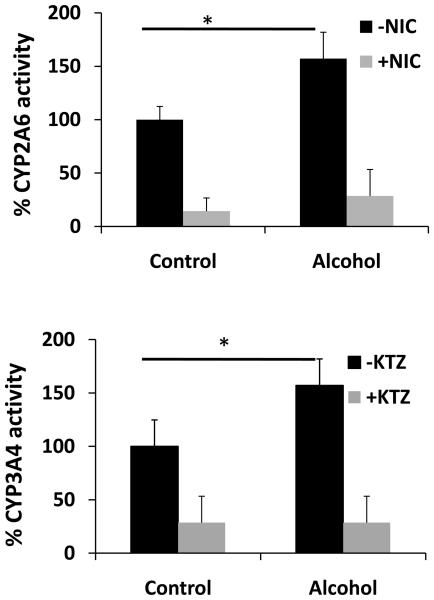
In order to determine whether alcohol-induced protein expression of CYPs is consistent with the increase in enzyme activity, we developed a simple and sensitive activity method for two representative CYP enzymes (2A6 and 3A4) that are expressed at y higher levels than other CYP enzymes in U937 macrophages. CYP2A6 and CYP3A4 showed detectable activity in U937 macrophages (Fig. 5). Further, alcohol-treated cells showed approximately 50 ± 20% increased CYP2A6 and CYP3A4 activity at 12 h compared to untreated cells, which is consistent with their increased protein expression (Fig. 5). As expected, the specific inhibitors of CYP2A6 (nicotine) and CYP3A4 (ketoconazole) significantly decreased their activity in control and alcohol-treated samples (Fig. 5).
Figure 5. Effect of alcohol on activities of CYP2A6 and CYP3A4.
The activities of CYP2A6 (top panel) and CYP3A4 (bottom panel) were determined for control and alcohol-treated cells at 12 h in the absence or presence of their respective inhibitors nicotine (NIC) or ketoconazole (KTZ) as described in the Materials and Methods section. The activities, presented in Y-axis, are in percent, with 100% activity normalized for the untreated cells. 100% activity of CYP2B6 and CYP3A4 correspond to the specific activity of 93 and 46 pmoles/min/mg, respectively. * represents p≤0.05 compared to controls.
Effect of alcohol on ROS production and activity of oxidative stress marker enzymes
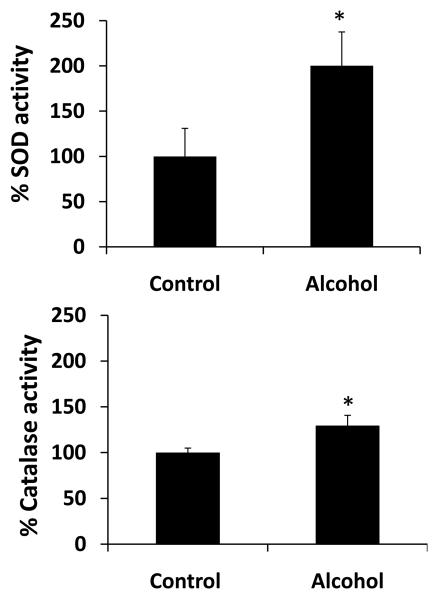
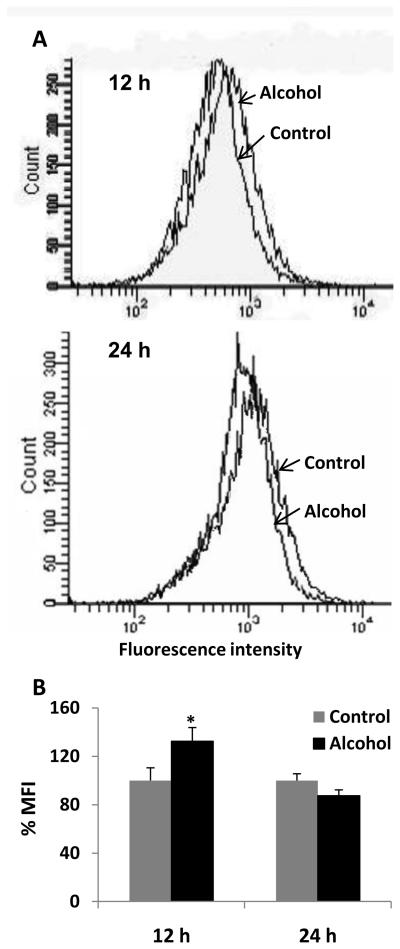
To determine whether alcohol treatment will cause increased oxidative stress, we measured ROS production using flow cytometry and we measured the activity of SOD and catalase. Our results showed that 100 mM alcohol significantly increased activity of SOD (100 ± 40%) and catalase (25 ± 10%) at 24 h (Fig. 6). However, there was no significant change in their activity at 12 h by alcohol (data not shown). Flow cytometry data showed an increase in fluorescence intensity indicating the formation of ROS in U937 cells, with a marginal, but significant increase in mean fluorescence intensity (MFI) upon alcohol treatment at 12 h (Fig. 7). The results from three independent samples showed a MFI of 100 ± 10% in alcohol treated samples compared to 132 ± 11% in control (Fig. 7B). However, there was no significant difference in MFI between alcohol treated cells (100 ± 6%) and control (87 ± 5%) at 24 h.
Figure 6. Effect of alcohol on oxidative stress marker enzymes.
The activities of superoxide dismutase (SOD) (top panel) and catalase (bottom panel) were determined from at least three independent samples at 24 h in control and alcohol-treated U937 macrophages as described in the Materials and Methods section. The activities, presented in Y-axis, are in percent, with 100% activities normalized for the untreated cells. 100% specific activity of SOD corresponds to 0.45 U/mg, while 100% specific activity of catalase corresponds to 0.55 pmoles/min/mg. * represents p≤0.05 compared to controls.
Figure 7. Effect of alcohol on reactive oxygen species (ROS).
A. Representative figures of ROS production. The ROS production was measured using flow cytometer from control and alcohol-treated cells at 12 h and 24 h in U937 macrophages as described in the Materials and Methods section. The events (cell population) are presented in Y-axis and relative fluorescence intensity is presented in X-axis. B. Bar graphs of mean fluorescence intensity. The graphs were plotted as mean ± SD from three independent experiments. The mean fluorescence intensity (MFI) is presented in Y-axis. * represents p≤0.05 compared to controls.
Discussion
Alcohol use is highly prevalent among HIV-1 individuals (Kalichman et al., 2009) and is known to increase oxidative stress in these individuals (Bautista, 2001; Haorah et al., 2004, 2009). In addition, there are some indications that alcohol decreases efficacy of ART drugs (Flexner et al., 2001; Miguez, 2003). However, the mechanism by which alcohol decreases ART efficacy and increases oxidative stress is not known. In this study, we tested the hypothesis that alcohol-mediated induction of ABCC1 and CYP enzymes play important role in these processes.
Consistent with the reported data in human macrophages, PIs' efflux protein ABCC1 is expressed in U937 macrophages (Langman et al., 2006; Skazik et al., 2008). Although the mRNA expression of many CYPs has been demonstrated in several human myeloblastic and lymphoid cell lines, the relative quantification as well as implication of CYPs' expression in these cell lines is lacking (Nagai et al., 2002). In our study, CYP3A4, which metabolizes the majority of NNRTIs and PIs, is expressed approximately 100-fold higher than the CYP2B6 and CYP2D6. High expression of ABCC1 and CYP3A4 in U937 macrophages is consistent with the fact that the EC50 for the PIs is significantly higher in chronically infected macrophages than in chronically infected lymphocytes (Aquaro et al., 2006; Perno et al., 1998). As shown with U937 macrophages in this study, CYP2E1 has also been reported in human monocyte-derived macrophages, which suggests the potential importance of these cells in CYP2E1-mediated alcohol-induced cytotoxicity (Hutson and Wickramasinghe, 1999).
Although alcohol showed increased mRNA and protein expressions at the same time point (12 h) in several cases, there are discrepancies between the levels of mRNA and protein expression as well as with the time period of expression. ABCC1 protein expression (peak at 24 h) did not correlate with the time of mRNA expression (peak at 12 h), which is consistent with the prior finding that ABCC1 protein is expressed 8-12 h after the mRNA expression (Silverstein et al., 2009). Similarly, lack of CYP2A6 protein induction by alcohol at 6 h could be due to its delayed protein expression as a result of translational and/or post-translational modifications. A lack of CYP2B6 protein induction by alcohol might be due to an increased protein turnover rate in vivo that may obscure minor increases in the mRNA of CYP2B6. In addition, CYP enzymes, especially CYP2B6 is known to be less stable in vitro, which may increase its degradation (Kumar et al., 2007). Overall our findings are similar to others, which have shown differences in the magnitude of CYP mRNA and protein expression levels (Lee and Lee, 2003; Raucy et al., 2004).
Alcohol is shown to enhance the expression of cholesterol transporters ABCA1 and ABCG1 in the brain and fetal human astrocytes (Guizetti et al., 2007). However, there are no reports yet regarding the effects of alcohol on transporters that are involved in the efflux of antiretroviral agents (e.g. ABCB1 or ABCCs) in any cell types or organs. This is the first report of the induction of ABCC1 by alcohol in U937 macrophages. Alcohol is known to induce CYP3A4 and accelerate the metabolism of several drugs, including NNRTIs and PIs, in the liver (Gómez-Lechón et al., 2008; Louis et al., 1994). However, no information is available about the role of alcohol on CYP3A4 induction in human macrophages. Based on the results presented here it is plausible that the decreased efficacy of NNRTIs and PIs that is reported in individuals who use alcohol may be the result of a decrease in the bioavailability of PIs caused by induction of ABCC1 (increased efflux) and CYP3A4 (increased metabolism). A synergism between enhanced ART drug efflux and metabolism is expected to further decrease ART bioavailability. This would ultimately cause an increased viral load and suppressed immune system in HIV-1 individuals who use alcohol.
A significant induction of CYP2E1, a major source of alcohol-mediated oxidative stress in the liver, is expected to cause similar event in macrophages. A significant induction of CYP2A6 and CYP3A4 is expected to increase the metabolism of alcohol, in addition to the metabolism of nicotine and polycyclic aromatic hydrocarbons (CYP2A6 substrates) (Nakajima et al., 1996) as well as metabolism of NNRTIs and PIs (CYP3A4 substrates) (Walubo, 2007). The enhanced metabolism of these substrates would ultimately lead to increased oxidative stress in macrophages. Thus, CYP-mediated alcohol metabolism is also likely to enhance oxidative stress in macrophages. This argument is supported by the reports that alcohol-induced CYP2E1-mediated metabolism of alcohol leads to formation of ROS in macrophages, astrocytes, and human neurons (Floreani et al., 2010; Haorah et al., 2004; 2009).
In conclusion, the present study describes the upregulation of ABCC1, CYP2A6, CYP2E1, and CYP3A4 by alcohol. This is the first report about the effects of alcohol on the expression of ABCC1 and multiple CYP enzymes in macrophages. The data presented strongly suggest that alcohol exposure may have a deleterious effect upon bioavailability of NNRTIs and PIs in macrophages, as well as alcohol-induced oxidative stress in alcoholic HIV-1 individuals.
Acknowledgments
This work was supported by School of Pharmacy, UMKC and University of Missouri Research Board grant funding to S. Kumar and NIH funding to A. Kumar (AA015045) and H.K. Bhat (CA109551).
Contributor Information
Mengyao Jin, University of Missouri-Kansas City
Priyanka Arya, University of Missouri-Kansas City
Kalpeshkumar Patel, University of Missouri-Kansas City
Bhupendra Singh, University of Missouri-Kansas City
Peter S. Silverstein, University of Missouri-Kansas City
Hari K. Bhat, University of Missouri-Kansas City
Anil Kumar, University of Missouri-Kansas City
Santosh Kumar, University of Missouri-Kansas City
References
- Anzenbacher P, Anzenbacherová E. Cytochromes P450 and metabolism of xenobiotics. Cell Mol Life Sci. 2001;58:737–747. doi: 10.1007/PL00000897. [DOI] [PMC free article] [PubMed] [Google Scholar]
- Aquaro S, Balestra E, Cenci A, Francesconi M, Caliò R, Perno CF. HIV infection in macrophage: role of long-lived cells and related therapeutical strategies. J Biol Regul Homeost Agents. 1997;11:69–73. [PubMed] [Google Scholar]
- Aquaro S, Svicher V, Schols D, Pollicita M, Antinori A, Balzarini J, Perno CF. Mechanisms underlying activity of antiretroviral drugs in HIV-1-infected macrophages: new therapeutic strategies. J Leukoc Biol. 2006;80:1103–1110. doi: 10.1189/jlb.0606376. [DOI] [PubMed] [Google Scholar]
- Bautista AP. Free radicals, chemokines, and cell injury in HIV-1 and SIV infections and alcoholic hepatitis. Free Radic Biol Med. 2001;31:1527–1532. doi: 10.1016/s0891-5849(01)00745-6. [DOI] [PubMed] [Google Scholar]
- Cole SP, Deeley RG. Transport of glutathione and glutathione conjugates by MRP1. Trends Pharmacol Sci. 2010;27:438–446. doi: 10.1016/j.tips.2006.06.008. [DOI] [PubMed] [Google Scholar]
- Deeley RG, Westlake C, Cole SP. Transmembrane transport of endo- and xenobiotics by mammalian ATP-binding cassette multidrug resistance proteins. Physiol Rev. 2006;86:849–899. doi: 10.1152/physrev.00035.2005. [DOI] [PubMed] [Google Scholar]
- Flexner CW, Cargill VA, Sinclair J, Kresina TF, Cheever L. Alcohol use can result in enhanced drug metabolism in HIV pharmacotherapy. AIDS Patient Care STDS. 2001;15:57–58. doi: 10.1089/108729101300003636. [DOI] [PubMed] [Google Scholar]
- Floreani NA, Rump TJ, Muneer PM, Alikunju S, Morsey BM, Brodie MR, Persidsky Y, Haorah J. Alcohol-Induced Interactive Phosphorylation of Src and Toll-like Receptor Regulates the Secretion of Inflammatory Mediators by Human Astrocytes. J Neuroimmune Pharmacol. 2010 doi: 10.1007/s11481-010-9213-z. E Pub Apr 9. [DOI] [PMC free article] [PubMed] [Google Scholar]
- Fukami T, Katoh M, Yamazaki H, Yokoi T, Nakajima M. Human cytochrome P450 2A13 efficiently metabolizes chemicals in air pollutants: naphthalene, styrene, and toluene. Chem Res Toxicol. 2008;21:720–725. doi: 10.1021/tx700325f. [DOI] [PubMed] [Google Scholar]
- Freeman TL, Chadwick AP, Lennard MS, Martin CM, Turcan RG, Blond D. In: Characterisation of the Induction of Cytochrome p450 Enzymes in Primary Cultures of Human Hepatocytes, in Cell Technology for Cell Products. Rodney Smith., editor. Springer; Netherlands: 2007. pp. 67–70. [Google Scholar]
- Gómez-Lechón MJ, Castell JV, Donato MT. An update on metabolism studies using human hepatocytes in primary culture. Expert Opin Drug Metab Toxicol. 2008;4:837–854. doi: 10.1517/17425255.4.7.837. [DOI] [PubMed] [Google Scholar]
- Guizzetti M, Chen J, Oram JF, Tsuji R, Dao K, Möller T, Costa LG. Ethanol induces cholesterol efflux and up-regulates ATP-binding cassette cholesterol transporters in fetal astrocytes. J Biol Chem. 2007;282:18740–18749. doi: 10.1074/jbc.M702398200. [DOI] [PubMed] [Google Scholar]
- Haorah J, Heilman D, Diekmann C, Osna N, Donohue TM, Jr, Ghorpade A, Persidsky Y. Alcohol and HIV decrease proteasome and immunoproteasome function in macrophages: implications for impaired immune function during disease. Cell Immunol. 2004;229:139–148. doi: 10.1016/j.cellimm.2004.07.005. [DOI] [PubMed] [Google Scholar]
- Haorah J, Ramirez SH, Floreani N, Gorantla S, Morsey B, Persidsky Y. Mechanism of alcohol-induced oxidative stress and neuronal injury. Free Radic Biol Med. 2009;45:1542–1550. doi: 10.1016/j.freeradbiomed.2008.08.030. [DOI] [PMC free article] [PubMed] [Google Scholar]
- Harlow GR, Halpert JR. Alanine-scanning mutagenesis of putative substrate recognition sites in human cytochrome P4503A4. J Biol Chem. 1997;272:5396–5402. doi: 10.1074/jbc.272.9.5396. [DOI] [PubMed] [Google Scholar]
- Hutson JL, Wickramasinghe SN. Expression of CYP2E1 by human monocyte-derived macrophages. J Pathol. 1999;188:197–200. doi: 10.1002/(SICI)1096-9896(199906)188:2<197::AID-PATH295>3.0.CO;2-M. [DOI] [PubMed] [Google Scholar]
- Igarashi T, Brown CR, Endo Y, Buckler-White A, Plishka R, Bischofberger N, Hirsch V, Martin MA. Macrophage are the principal reservoir and sustain high virus loads in rhesus macaques after the depletion of CD4+ T cells by a highly pathogenic simian immunodeficiency virus/HIV type 1 chimera (SHIV): Implications for HIV-1 infections of humans. Proc Natl Acad Sci U S A. 2001;98:658–663. doi: 10.1073/pnas.021551798. [DOI] [PMC free article] [PubMed] [Google Scholar]
- Kalichman SC, Amaral CM, White D, Swetsze C, Pope H, Kalichman MO, Cherry C, Eaton L. Prevalence and clinical implications of interactive toxicity beliefs regarding mixing alcohol and antiretroviral therapies among people living with HIV/AIDS. AIDS Patient Care STDS. 2009;23:449–454. doi: 10.1089/apc.2008.0184. [DOI] [PMC free article] [PubMed] [Google Scholar]
- Kedzierska K, Crowe SM. The role of monocytes and macrophages in the pathogenesis of HIV-1 infection. Curr Med Chem. 2002;9:1893–1903. doi: 10.2174/0929867023368935. [DOI] [PubMed] [Google Scholar]
- Kerb R, Hoffmeyer S, Brinkmann U. ABC drug transporters: hereditary polymorphisms and pharmacological impact in MDR1, MRP1 and MRP2. Pharmacogenomics. 2001;2:51–64. doi: 10.1517/14622416.2.1.51. [DOI] [PubMed] [Google Scholar]
- Kresina TF, Flexner CW, Sinclair J, Correia MA, Stapleton JT, Adeniyi-Jones S, Cargill V, Cheever LW. Alcohol use and HIV pharmacotherapy. AIDS Res Hum Retroviruses. 2002;18:757–770. doi: 10.1089/08892220260139495. [DOI] [PubMed] [Google Scholar]
- Kumar S, Liu H, Halpert JR. Engineering of cytochrome P450 3A4 for enhanced peroxide-mediated substrate oxidation using directed evolution and site-directed mutagenesis. Drug Metab Dispos. 2006;34:1958–1965. doi: 10.1124/dmd.106.012054. [DOI] [PubMed] [Google Scholar]
- Kumar S, Zhao Y, Sun L, Halpert JR, Muralidhara BK. Engineering human cytochrome P450 2B6 for enhanced expression and stability: Importance of Leu264→Phe substitution. Mol Pharmacol. 2007;46:11559–11567. doi: 10.1124/mol.107.039693. [DOI] [PubMed] [Google Scholar]
- Langmann T, Mauerer R, Schmitz G. Human ATP-binding cassette transporter TaqMan low-density array: analysis of macrophage differentiation and foam cell formation. Clin Chem. 2006;52:310–313. doi: 10.1373/clinchem.2005.059774. [DOI] [PubMed] [Google Scholar]
- Lee CG, Gottesman MM, Cardarelli CO, Ramachandra M, Jeang KT, Ambudkar SV, Pastan I, Dey S. HIV-1 protease inhibitors are substrates for the MDR1 multidrug transporter. Biochemistry. 1998;37:3594–3601. doi: 10.1021/bi972709x. [DOI] [PubMed] [Google Scholar]
- Lee WY, Lee SM. Differential regulation of cytochrome P450 isozyme mRNAs and proteins by femur fracture trauma. Arch Pharm Res. 2003;26:1079–1086. doi: 10.1007/BF02994762. [DOI] [PubMed] [Google Scholar]
- Louis CA, Wood SG, Kostrubsky V, Sinclair PR, Sinclair JF. Synergistic increases in rat hepatic cytochrome P450s by ethanol and isopentanol. J Pharmacol Exp Ther. 1994;269:838–845. [PubMed] [Google Scholar]
- Lu Y, Cederbaum AI. CYP2E1 and oxidative liver injury by alcohol. Free Radic Biol Med. 2008;44:723–738. doi: 10.1016/j.freeradbiomed.2007.11.004. [DOI] [PMC free article] [PubMed] [Google Scholar]
- McCartney EM, Semendric L, Helbig KJ, Hinze S, Jones B, Weinman SA, Beard MR. Alcohol metabolism increases the replication of hepatitis C virus and attenuates the antiviral action of interferon. J Infect Dis. 2008;198:1766–1775. doi: 10.1086/593216. [DOI] [PubMed] [Google Scholar]
- Miguez MJ, Shor-Posner G, Morales G, Rodriguez A, Burbano X. HIV treatment in drug abusers: impact of alcohol use, in Addiction Biology. Blackwell Publishing Limited; Hoboken, NJ: 2003. p. 33. [DOI] [PubMed] [Google Scholar]
- Montaner LJ, Crowe SM, Aquaro S, Perno CF, Stevenson M, Collman RG. Advances in macrophage and dendritic cell biology in HIV-1 infection stress key understudied areas in infection, pathogenesis, and analysis of viral reservoirs. J Leukoc Biol. 2006;80:961–964. doi: 10.1189/jlb.0806488. [DOI] [PubMed] [Google Scholar]
- Nagai F, Hiyoshi Y, Sugimachi K, Tamura HO. Cytochrome P450 (CYP) expression in human myeloblastic and lymphoid cell lines. Biol Pharm Bull. 2002;25:383–385. doi: 10.1248/bpb.25.383. [DOI] [PubMed] [Google Scholar]
- Nakajima M, Yamamoto T, Nunoya K, Yokoi T, Nagashima K, Inoue K, Funae Y, Shimada N, Kamataki T, Kuroiwa Y. Role of human cytochrome P4502A6 in C-oxidation of nicotine. Drug Metab Dispos. 1996;24:1212–1217. [PubMed] [Google Scholar]
- Nebert DW, Dalton TP, Okey AB, Gonzalez FJ. Role of aryl hydrocarbon receptor-mediated induction of the CYP1 enzymes in environmental toxicity and cancer. J Biol Chem. 2004;279:23847–23850. doi: 10.1074/jbc.R400004200. [DOI] [PubMed] [Google Scholar]
- Niemela O, Parkkila S, Juvonen R, Viitala K, Gelboin HV, Pasanen M. Cytochromes P450 2A6, 2El, and 3A and production of protein-aldehyde adducts in the liver of patients with alcoholic and non-alcoholic liver diseases. J Hepatol. 2000;33:893–901. doi: 10.1016/s0168-8278(00)80120-8. [DOI] [PubMed] [Google Scholar]
- Pal D, Mitra AK. MDR- and CYP3A4-mediated drug-drug interactions. J Neuroimmune Pharmacol. 2006;1:323–339. doi: 10.1007/s11481-006-9034-2. [DOI] [PubMed] [Google Scholar]
- Perno CF, Newcomb FM, Davis DA, Aquaro S, Humphrey RW, Caliò R, Yarchoan R. Relative potency of protease inhibitors in monocytes/macrophages acutely and chronically infected with human immunodeficiency virus. J Infect Dis. 1998;178:413–422. doi: 10.1086/515642. [DOI] [PubMed] [Google Scholar]
- Raucy JL, Lasker J, Ozaki K, Zoleta V. Regulation of CYP2E1 by ethanol and palmitic acid and CYP4A11 by clofibrate in primary cultures of human hepatocytes. Toxicol Sci. 2004;79:233–241. doi: 10.1093/toxsci/kfh126. [DOI] [PubMed] [Google Scholar]
- Ronaldson PT, Persidsky Y, Bendayan R. Regulation of ABC membrane transporters in glial cells: relevance to the pharmacotherapy of brain HIV-1 infection. Glia. 2008;56:1711–1735. doi: 10.1002/glia.20725. [DOI] [PubMed] [Google Scholar]
- Silverstein PS, Audus KL, Qureshi N, Kumar A. Lipopolysaccharide Increases the Expression of Multidrug Resistance-Associated Protein 1 (MRP1) in RAW 264.7 Macrophages. J Neuroimmune Pharmacol. 2009 doi: 10.1007/s11481-009-9180-4. E Pub Nov 6. [DOI] [PMC free article] [PubMed] [Google Scholar]
- Skazik C, Heise R, Bostanci O, Paul N, Denecke B, Joussen S, Kiehl K, Merk HF, Zwadlo-Klarwasser G, Baron JM. Differential expression of influx and efflux transport proteins in human antigen presenting cells. Exp Dermatol. 2008;17:739–747. doi: 10.1111/j.1600-0625.2008.00745.x. [DOI] [PubMed] [Google Scholar]
- Walubo A. The role of cytochrome P450 in anti-retroviral drug interactions. Expert Opin Drug Toxicol. 2007;3:583–598. doi: 10.1517/17425225.3.4.583. [DOI] [PubMed] [Google Scholar]
- Zanger UM, Turpeinen M, Klein K, Schwab M. Functional pharmacogenetics/genomics of human cytochromes P450 involved in drug biotransformation. Anal Bioanal Chem. 2008;392:1093–1108. doi: 10.1007/s00216-008-2291-6. [DOI] [PubMed] [Google Scholar]


