Abstract
Purpose
This article explores the feasibility of using coupled electromagnetic and thermodynamic simulations to improve planning and control of hyperthermia treatments for cancer. The study investigates the usefulness of preplanning to improve heat localization in tumor targets in treatments monitored with PRFS-based Magnetic Resonance Thermal Imaging (MRTI). .
Methods
Heating capabilities of a cylindrical radiofrequency (RF) mini-annular phased array (MAPA) applicator were investigated with electromagnetic and thermal simulations of SAR in homogeneous phantom models and two human leg sarcomas. HFSS (Ansoft Corp) was used for electromagnetic simulations and SAR patterns were coupled into EPhysics (Ansoft Corp) for thermal modeling with temperature dependent variable perfusion. Simulations were accelerated by integrating tumor specific anatomy into a pre-gridded whole body tissue model. To validate this treatment planning approach, simulations were compared with MR thermal images in both homogenous phantoms and heterogeneous tumors.
Results
SAR simulations demonstrated excellent agreement with temperature rise distributions obtained with MR thermal imaging in homogeneous phantoms, and clinical treatments of large soft-tissue sarcomas. The results demonstrate feasibility of preplanning appropriate relative phases of antennas for localizing heat in tumor.
Conclusions
Advances in the accuracy of computer simulation and non-invasive thermometry via MR thermal imaging have provided powerful new tools for optimization of clinical hyperthermia treatments. Simulations agree well with MR thermal images in both homogeneous tissue models and patients with lower leg tumors. This work demonstrates that better quality hyperthermia treatments should be possible when simplified hybrid model simulations are performed routinely as part of the clinical pretreatment plan.
Keywords: Electromagnetic simulation, thermodynamic simulation, Proton Resonance Frequency Shift, PRFS, MRI, RF phased array heat applicator, treatment planning, non-invasive temperature measurement
Introduction
Several recent developments have reinvigorated clinical application of hyperthermia as a viable adjuvant treatment in the fight against cancer (1, 2). Advancements such as the emergence of accurate computer simulation tools for hyperthermia treatment planning (3–6) and non-invasive thermometry via magnetic resonance imaging (7–10) have aided this resurgence.
Computational models of power deposition patterns and temperature distributions in human bodies have helped researchers to understand and improve hyperthermia treatments (11–16). Optimization is well-suited to computational models in a low cost manner since the time, effort and expense of laboratory experiments can be reduced significantly. Moreover, due to variations of tumor size, shape, dielectric and thermal (i.e. blood flow) properties and location relative to other dielectric interfaces of the body, the treatment outcome varies dramatically from patient to patient. Computational modeling can provide a method to predict the possibility of a successful treatment for each patient or compare the effectiveness of various applicators on a particular tumor site in advance of treatment in advance of treatment. The role of modeling becomes increasingly important when localized heat delivery to the tumor region is complicated due to multiple independently controllable antennas heating complex heterogeneous tissue with properties that vary spatially and temporally during treatment. In general, there are two significantly different levels of complexity in simulation studies used for hyperthermia research: 1) initial analysis based on simplified models such as homogeneous tissue, layered tissue, or simple heterogeneous tissue models, and 2) simulations on complex tissue models that include detailed information about the patient normal and tumor tissue geometry. The homogenous models allow us to compare theory directly with simple phantom models that can be constructed and tested in the laboratory. Homogenous model studies allow fine tuning of the simulation approach and thus provide confidence in the accuracy of results for more complex simulations. For effective clinical hyperthermia treatment planning, complex tissue models are required that contain realistic tumor and normal tissue geometry and tissue properties. In this effort, a patient with a tumor in the lower leg was segmented to construct an accurate tissue model for simulation of heating from a radiofrequency annular phased array applicator.
The mini-annular phased array (MAPA) applicator we used for heat treatments is based on the design described previously.(17, 18) It consists of eight copper foil strip dipole antennas which are connected in parallel pairs and printed on the inner surface of a cylindrical plastic shell. Extensive clinical experience reported in the literature using similar but larger diameter 4 antenna phased arrays (19, 20) suggests that the best approach is to change the location of focus within the array by shifting relative phase and not by adjusting amplitude. The current theoretical investigation of a smaller MAPA array configuration confirms this empirical result.
In clinical hyperthermia treatment, knowledge of temperatures obtained both in tumor and surrounding normal tissue is crucial. The invasive thermometry approaches used during most clinical treatments today are insufficient to make three dimensional detailed temperature measurements throughout the treatment region, especially for deep-seated tumors. In recent years, there is increased effort on developing noninvasive temperature monitoring approaches(21, 22), for example ultrasound (US) (23–25), applied potential tomography (APT) (26), microwave tomography (27), microwave radiometry (28–30) and magnetic resonance thermal imaging (MRTI). In recent years, several groups have begun monitoring temperatures during clinical hyperthermia treatments with the PRFS MRTI method. (7, 8, 31–34) This method allows us to monitor temperature in real time in order to compare the temperature distribution with simulation results; those comparison results can then be used to determine appropriate shifts in power and phase of the phased array applicator to steer heating away from critical normal tissues and into the tumor. At Duke University, our implementation of this method corrects for B0 field changes by fitting a smoothly changing field model to signals from external silicone oil references that surround the extremity and do not change signal with varying temperature. This correction removes systematic errors in ΔT measurements of tissue due to static field drift over the duration of the experiment.(35)
Advancements of computer simulation programs and non-invasive thermometry via magnetic resonance imaging have significantly enhanced our ability to perform clinical pre-treatment planning as well as realtime monitoring and control. Prospective simulations emphasizing optimization of SAR and resulting temperature distributions have been used for pre-treatment planning of regional hyperthermia treatments in patients (6, 10, 36, 37). The goal is to use real time monitoring with MRI to make minor adjustments to the pre-planned heat distribution obtained by detailed simulation in advance of treatment. By using electromagnetic simulations of power deposition coupled directly to thermal simulations of subsequent heat transfer within the body, both E field/SAR distributions and resulting temperature distributions can be optimized for individual patient geometries. Multiple targets can be assigned heating priorities individually, and sensitive regions can be specified to avoid heating. In this study, a pretreatment plan is given for a typical extremity sarcoma, which shows that optimized simulation results can be used to improve the probability of a successful treatment by starting off with a focus that is better centered in the tumor volume.
Methods and Procedures
Electromagnetic Model and Power Deposition in a Homogeneous Medium
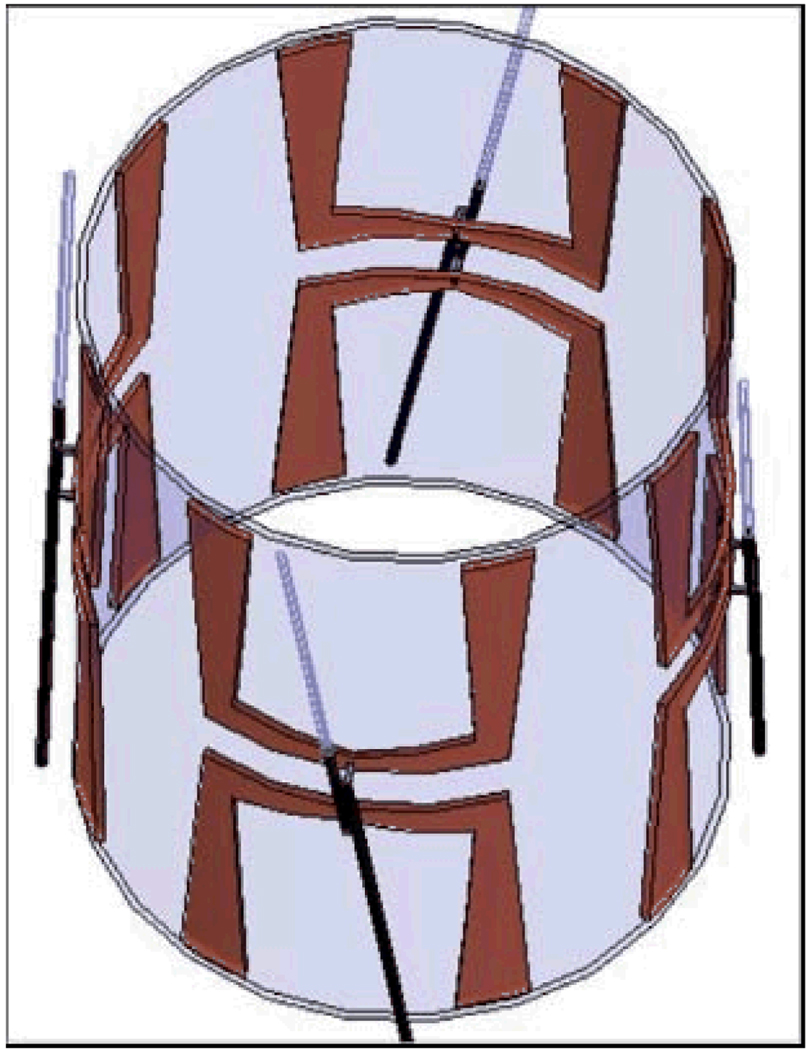
The MAPA applicator consists of eight copper foil strip dipole antennas which are connected in parallel pairs and printed on the inner surface of a 25cm diameter cylindrical plastic shell. The tapered antennas are made of 0.03 mm thick copper foil. Each antenna pair is fed by a coaxial cable (RG-233/U) at the center of the U-shaped dipole pair elements and each cable has a coaxial stub tuner for impedance matching. Each antenna pair acts as one separate antenna fed by a separate amplifier and phase shifter. A water bolus (closed silicone membrane containing deionized water) is attached to the internal side of the cylindrical plastic shell. Deionized water fills the space between the phantom load and inner wall of the plastic cylinder. The water produces cooling of the patient's skin as well as impedance matching of antennas to the 12 cm diameter muscle tissue-equivalent phantom. The antennas are separated from the deionized water by an insulating dielectric 0.5 mm thick (17, 18).
A suite of 3D electromagnetic and thermodynamic simulation programs is chosen for our hyperthermia research purposes. The simulation package from Ansoft Corporation (now ANSYS Inc. Canonsburg, PA) includes High Frequency Structure Simulator (HFSS) for EM simulation, Ephysics for thermodynamic simulation, and a human body model for detailed dielectric and thermal properties of an anatomically accurate generic “patient”. HFSS is a powerful FEM (Finite Electromagnetic) solver for electromagnetic problems including antenna design. The companion software program Ephysics, designed for coupled thermal and stress analysis applications, is used to simulate the resulting temperature distribution. In our simulations, a 3D human body model was used to obtain accurate tissue properties for typical patient anatomy. The body model was constructed from MR images with frequency-dependent material parameters stored in the matrix for more than three hundred distinct tissue regions including bones, muscles, organs, etc. To make the simulations more realistic, our model includes a tumor that mimics the size, shape, and position of a human sarcoma in the lower leg, with estimates of tumor and surrounding healthy tissue blood perfusion.
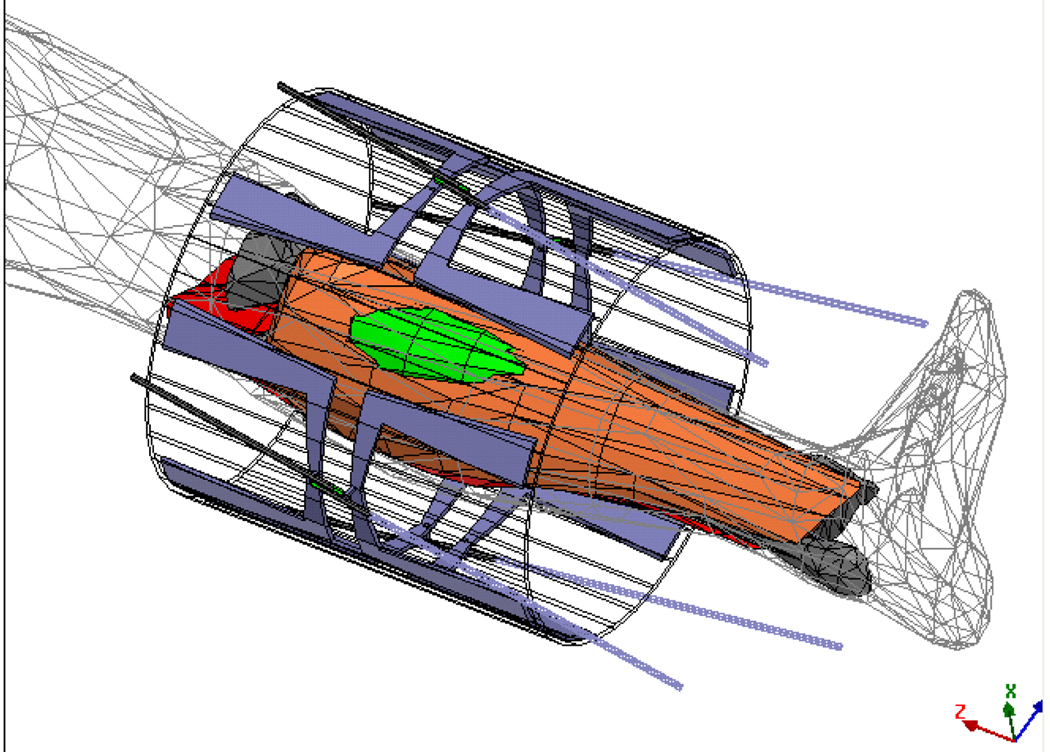
To build the complete electromagnetic model, the applicator with folded dipoles and feed network was first drawn in a mechanical CAD program. Then the drawing file was translated and imported into the electromagnetic simulator HFSS. The four MAPA antennas are driven coherently at 140 MHz (17). The amplitude and phase inputs to each dipole were adjusted to move the SAR focus inside the MAPA. An HFSS schematic diagram of an annular phased array limb applicator is shown in Figure 1. In the simulation, 40 W power at 140 MHz was applied to each of the four antennas. Then the relative phases (0°–180°) of the antennas were adjusted to move the focal spot along two straight lines on the central cross-section of the MAPA.
Figure 1.
A schematic diagram of the mini-annular phased array (MAPA) applicator. Each antenna pair is fed by a coaxial cable (RG-233/U) at the center of the U-shaped elements and each cable has a coaxial stub tuner for impedance matching.
MR Image Based Thermometry: Proton Resonance Frequency Shift Methods
A number of techniques for examining specific absorption rate (SAR) patterns within a phantom have been reported (38–41). In the current study, we explore the control of electric field distribution for our limb applicator when it is used in conjunction with non-invasive Proton Resonance Frequency Shift (PRFS) Magnetic Resonance Thermal Imaging (MRTI). This approach provides clinicians with the capability of monitoring and adjusting heating parameters in real time so that temperature distributions may be optimized during the course of the treatment.
PRFS is linear with temperature in high water content tissues but requires corrections for fat tissue (35). The PRFS method also provides high temperature sensitivity. When combined with parallel echo imaging techniques, rapid and high spatial resolution (~ 2mm) temperature scans are possible. With this technique, changes in the local magnetic field cause a change in the Larmor frequency resulting in a phase change in the acquired MR image. When measuring tissue temperature, the Larmor resonance frequency of hydrogen atoms that are abundant in water, is used. As temperature rises, the electron clouds surrounding the bound hydrogen nuclei (protons) are excited thereby increasing the shielding effect of the cloud. As the shielding increases, the Larmor frequency of the proton decreases. These effects are captured in the following relation:
| (1) |
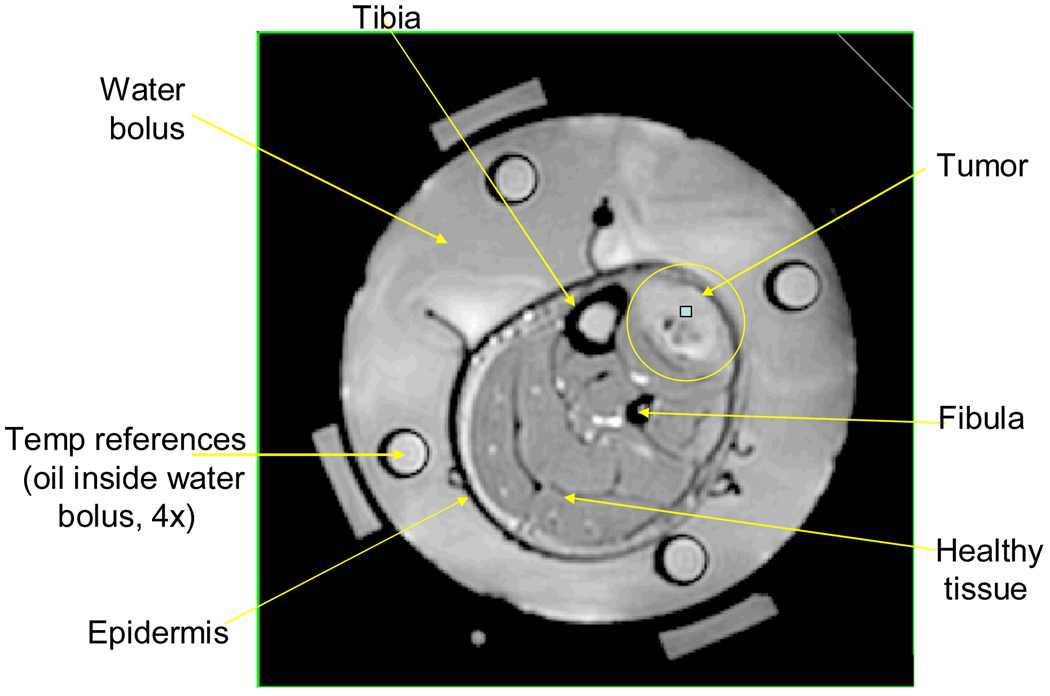
where ΔΦ is the measured phase change, γ is the gyromagnetic ratio, α is the temperature dependent shielding coefficient, B0 is the applied magnetic field, ΔT is the desired temperature change, and TE is the echo time. As shown in equation (1), this method provides relative temperature changes, not absolute temperatures. Oil references inserted inside the water bolus, as shown in Figure 2, are used to correct for field drift of the magnet since the signal from the silicone oil region does not change with temperature as discussed in the literature (9, 19, 35, 42, 43). The technique’s principal technological weakness is that it is susceptible to errors induced by patient movement. Motion-stabilization techniques and correction algorithms are currently under development.
Figure 2.
MRI cross-section of patient’s lower leg inside 4 antenna MAPA applicator.
In addition to noninvasive thermal imaging with MRI, a #15 gauge catheter was inserted interstitially deep into the tumor with four fiberoptic sensors along the catheter to correlate the MRI temperature rise images with absolute temperatures at up to four points across the tumor. A clinical investigation of this approach to monitoring temperature with PRFS technique has been reported previously demonstrating that the temperature rise determined from MR thermal imaging agrees with interstitially measured temperatures with an “accuracy” of about 1° C for 1 cm3 of tissue (7, 35, 44).
Experiments of Heating a Gel Filled Phantom
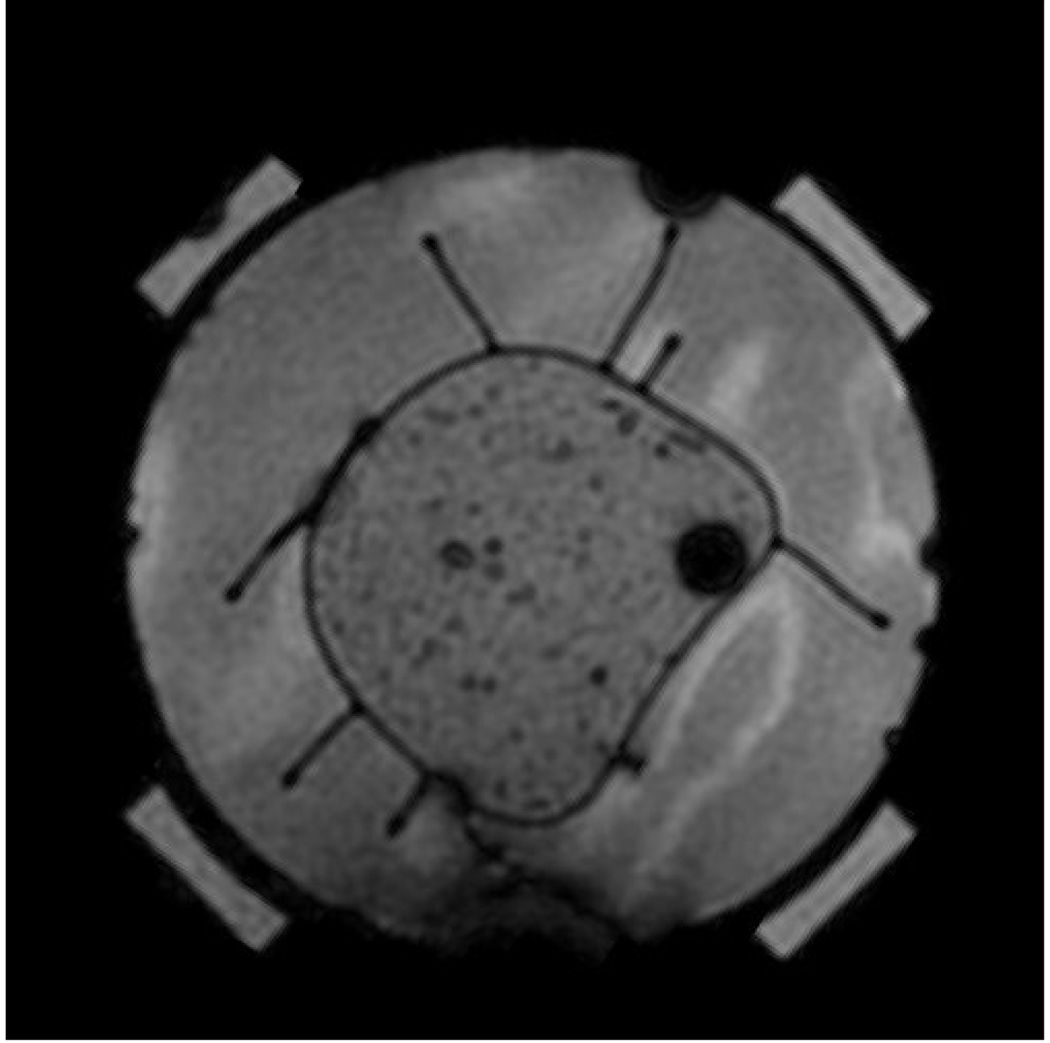
A phantom constructed from gel (45) with approximate dielectric properties of muscle (8.39% Tx-150, 15.79% Polyethylene powder, 74.92% H2O, and 0.9% NaCl) was placed concentrically in the MAPA applicator and placed within the General Electric 1.5T MRI system. For effective matching, the space within the 23 cm diameter cylindrical applicator was filled with deionized water held within an expandable thin plastic membrane all around the 12 cm diameter phantom. An example MRI of the gel phantom is shown in Figure 3.
Figure 3.
A muscle tissue phantom in the MAPA phased array applicator surrounded by water. Dark spots inside the room temperature gel phantom are caused by small air inclusions.
During the experiments, 40 W of power was applied for 2 minutes at 140 MHz to each of the four antennas at top, bottom, left and right of cylinder. To move the hot spot either horizontally to the right (or diagonally towards lower left), the relative phases were adjusted from 0°–180° for the right antenna, (or both bottom and left antennas), and the resulting iso-SAR patterns were compared with simulation results. Heat experiments were separated by a time sufficient to cool back to baseline temperature (+/−1°C). PRFS gradient echo images with repetition time (TR) = 117 ms, echo time (TE) = 20 ms, 1 2 8×1 2 8 matrix and 4 NEX (number of excitations), were acquired by the MRI system before and after each power on period to determine temperature rise due to RF power deposition.
Tissue Model for Simulating Power Deposition and Temperature in a Tumor
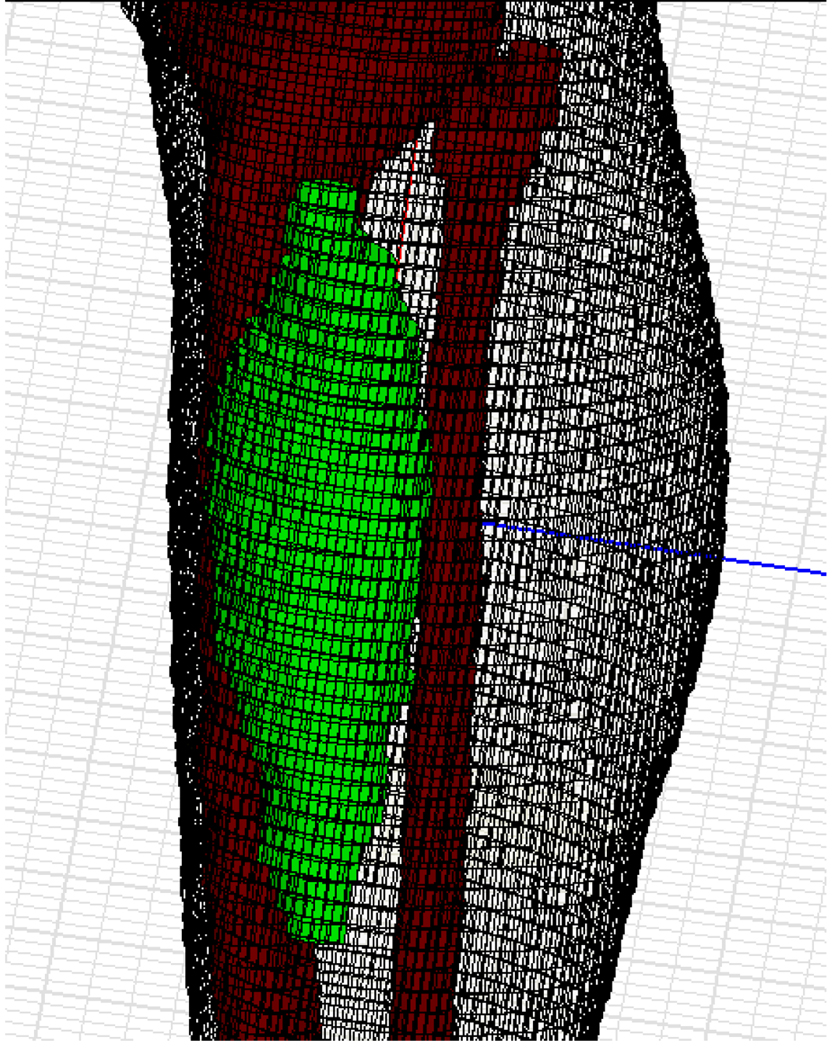
To provide realistic modeling of a clinical hyperthermia treatment, a detailed 3-D model of the patient including the target tumor was generated. Typically, such a model is made by utilizing computed tomography (CT) or other imaging modality so that the model includes all the information about each tissue within the target volume (46). With CT scan data, the patient anatomy is shown as pixel densities (47). For electromagnetic simulation purposes, the anatomical structure is usually constructed via segmentation, which involves generating a closed contour that defines the spatial extent of each different tissue (48). The patient tumor model shown in Figure 4 was reconstructed from CT data where the voxel size is of the order of 1 mm3.
Figure 4.
An anatomical reconstruction of a patient's leg with patient specific sarcoma inserted inside generic patient lower leg.
Working with a new high resolution complete leg model such as Figure 4 for the electromagnetic simulation process of each patient would require significant memory and simulation time. To simplify this model would require additional effort to re-generate mesh points at a lower density and test that new model against the original model for accuracy, which would also be time-consuming. We took another approach in our study. Since the anatomy of the human lower leg is relatively simple, including primarily muscle, bone (tibia and fibula), fat and epidermis, the actual patient specific segmented leg can be replaced by a recently released, pre-meshed human body model (Ansoft Corp, Pittsburg PA). Then a simplified hybrid simulation model can be constructed by inserting a patient specific sarcoma into the pre-meshed lower leg from the human body model dataset at the appropriate location determined from the patient CT scan. This hybrid model approach is shown in the lower resolution model of Figure 5. In this model, tetrahedra sizes ranged from 1 mm to several cm, as necessary to completely describe local details and curvatures. Tissue surfaces are reproduced within 2 mm accuracy.
Figure 5.
The patient specific tumor has been inserted in the correct location in the generic patient leg model, and the leg is placed inside the MAPA heat applicator.
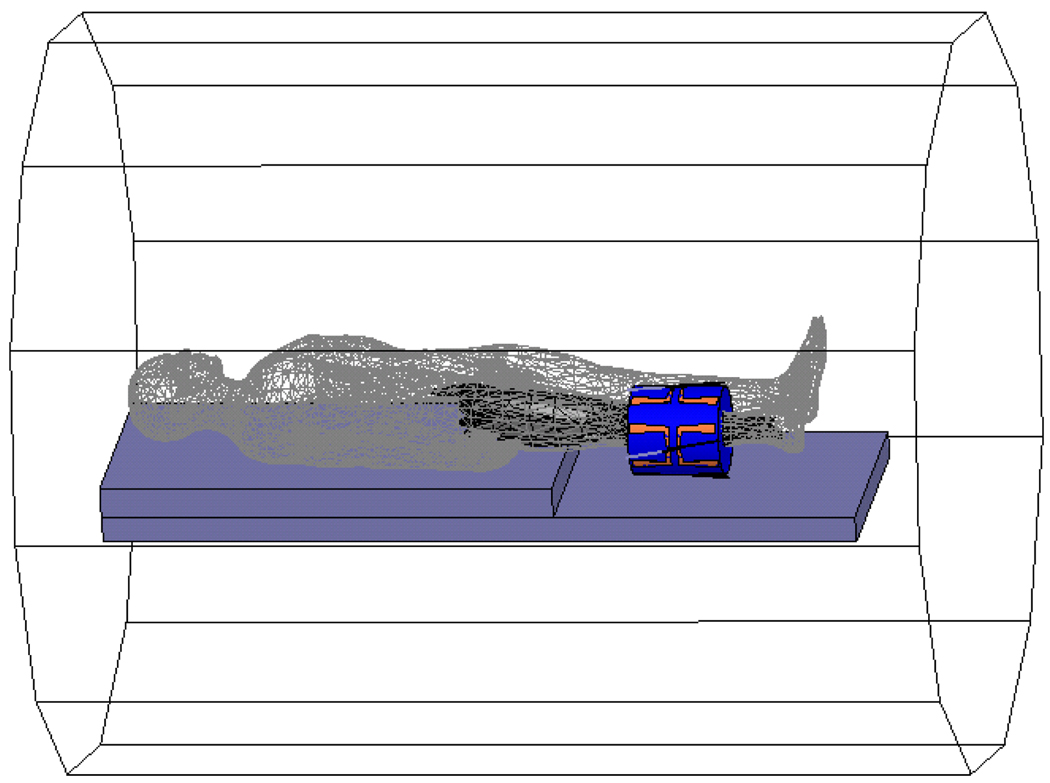
To accurately simulate the limb case, the leg tumor was placed inside the human body model which was placed inside the annular phased array limb applicator on a plastic table. Initially, this model was solved for the realistic case of the MAPA applicator inside a metal cylinder of 65 cm diameter since hyperthermia treatments are performed inside an MRI magnet with 60 cm diameter plastic casing inside the 65cm dia metal structure of the magnet bore. The cables which feed the antennas and their tuning stubs are also present in the complete model of Figure 6. In these first simulations, we found it was unnecessary to include the entire body and surrounding metal cylinder of the MRI magnet. Since fields are concentrated inside the MAPA, tissue heating simulated in the smaller model of Figure 5 was not significantly different than the more complete model of Figure 6 and subsequent simulations used only the smaller Figure 5 model.
Figure 6.
A schematic diagram in HFSS of a human body being placed inside the MR with leg tumor inside an annular phased array limb applicator. All cables which feed the antennas and their tuning stubs are included in the complete model for the initial simulation to verify accuracy of the smaller model for subsequent studies.
In this study, an electromagnetic and thermodynamic co-simulation approach using accurate electric and thermal tissue properties and anatomy from a complete human body model was validated against direct MRTI measurements. The effective energy exchange between the power delivery system and the tumor is determined in two steps. First, a 3D finite element electromagnetic simulator (HFSS) is used to predict the electric field in the tissue region of interest (e.g. leg). The solved electric field data are converted to SAR inputs according to the following equation:
| (2) |
where σ is tissue electrical conductivity, ρ is tissue density, and E is the electric field intensity. In the second step, the SAR data from the electromagnetic simulator is then “linked” to a thermodynamic simulator and the bio-heat transfer equation (49) is solved for changes in temperature (ΔT):
| (3) |
where T is temperature (°C), t is time (s), ρ is tissue density (kg/m3), κ is thermal conductivity (W/(m*K)), c is the tissue specific heat (J/(kg*K)), F is the blood flow rate or perfusion (kg/m3/s), and the subscript “b” refers to blood. This energy balance Equation 3 relates the rise in temperature over time at a given region of interest to the heat inputs (power deposition or SAR) and heat losses from thermal conduction and convection (blood perfusion). To complete the thermodynamic model, material properties, including mass density, thermal conductivity, and specific heat, for each component were entered. These data were derived from a literature search and are summarized in Table 1 (50, 51). When a range of values appeared in the literature, the average value from that range was used. In addition, temperature dependent blood perfusion is assumed as investigated previously (52). The results shown in this article are based on the perfusion data listed in Table 1, but all multiplied by a temperature-dependent factor that varies from 1.0 at 37°C to 1.52 for 41.7°C and above, from CRC Handbook of Thermal Engineering. The water bolus surrounding the leg was assumed to form a constant temperature thermal sink. Based on bolus dimensions and the volumetric flow rate of water within the bolus, an interface (forced convection boundary) temperature of 24°C was assumed.
Table 1.
| Mass Density [kg/m3] |
Thermal Conductivity [W/(m·°C)] |
Specific Heat [J/(kg·°C)] |
Perfusion [kg/m3/s] |
|
|---|---|---|---|---|
| Muscle | 1047 | 0.45 | 3550 | 0. 88 |
| Bone | 1990 | 0.29 | 970 | 0.8 |
| Marrow | 1040 | 0.45 | 3550 | 0.88 (not found, assumed same as muscle) |
| Skin | 1125 | 0.31 | 3000 | 0.78 |
| Tumor | 1047 | 0.55 | 3560 | 0. 6 (not found, assumed a little less than other organs) |
| Rest (high water content but includes some fat) |
1020 | 0.4 | 3200 | Assumed same as muscle |
Simulations were performed for two clinical hyperthermia patients; both had advanced soft tissue sarcomas in the lower leg. Then temperature distributions were simulated and compared to the MR thermal images of temperature distributions obtained during the hyperthermia treatments. In the first clinical case, simulated temperature distributions were compared with PRFS based thermal images and used as a baseline to determine the correlation between measurement and simulation. In the second case, it was shown that the simulations could be optimized to improve the probability of a successful treatment for that patient, by starting off the treatment with the hot spot centered in the tumor rather than in normal tissue away from the tumor. During these clinical treatments, the goal was to maximize temperature rise in the tumor relative to temperature rise of tissue around tumor by adjusting input power and phase of the dipole pair antennas. The optimized phase and amplitude excitation schemes were achieved empirically during treatment, and compared with the phase and amplitude settings optimized with simulations after the patient treatments. Once we are confident of our simulation results, the practical application of this approach will involve treatment planning in advance of each heat treatment to improve the quality of heating from the beginning to end of treatment.
Results and Discussion
Phantom Measurements
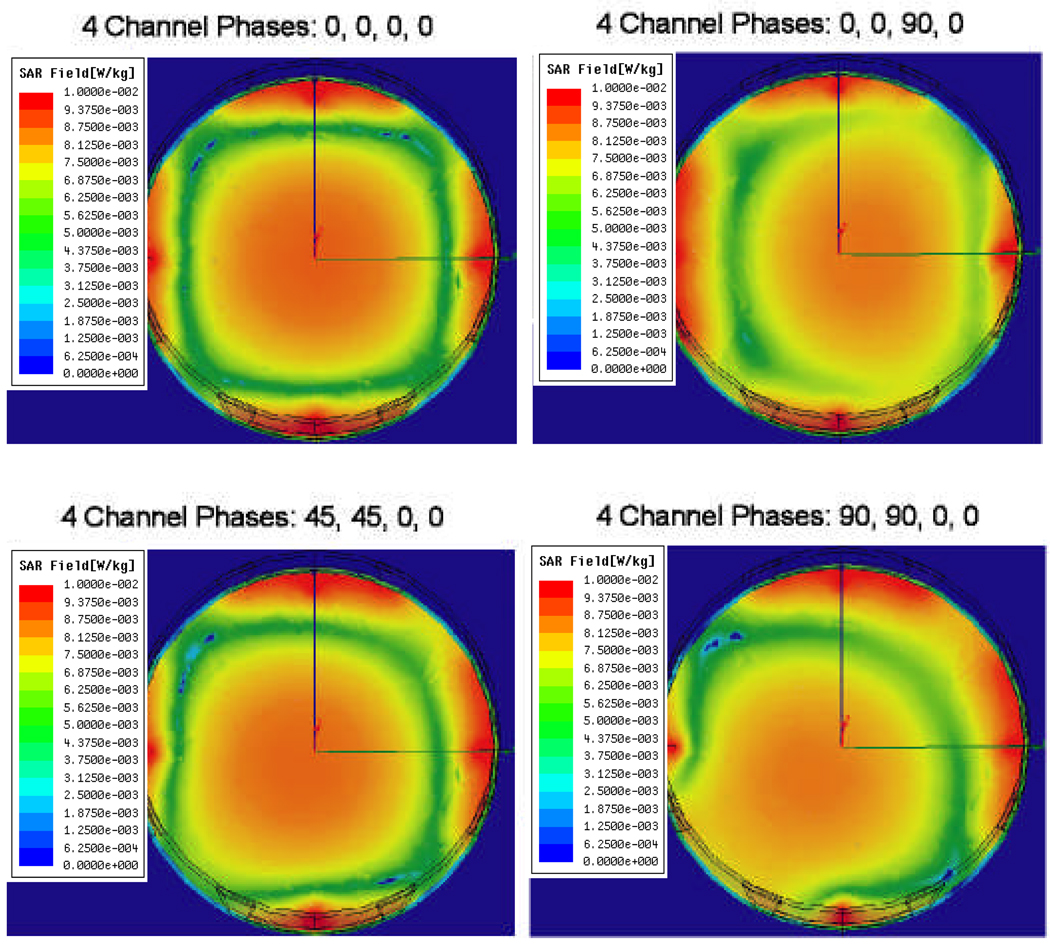
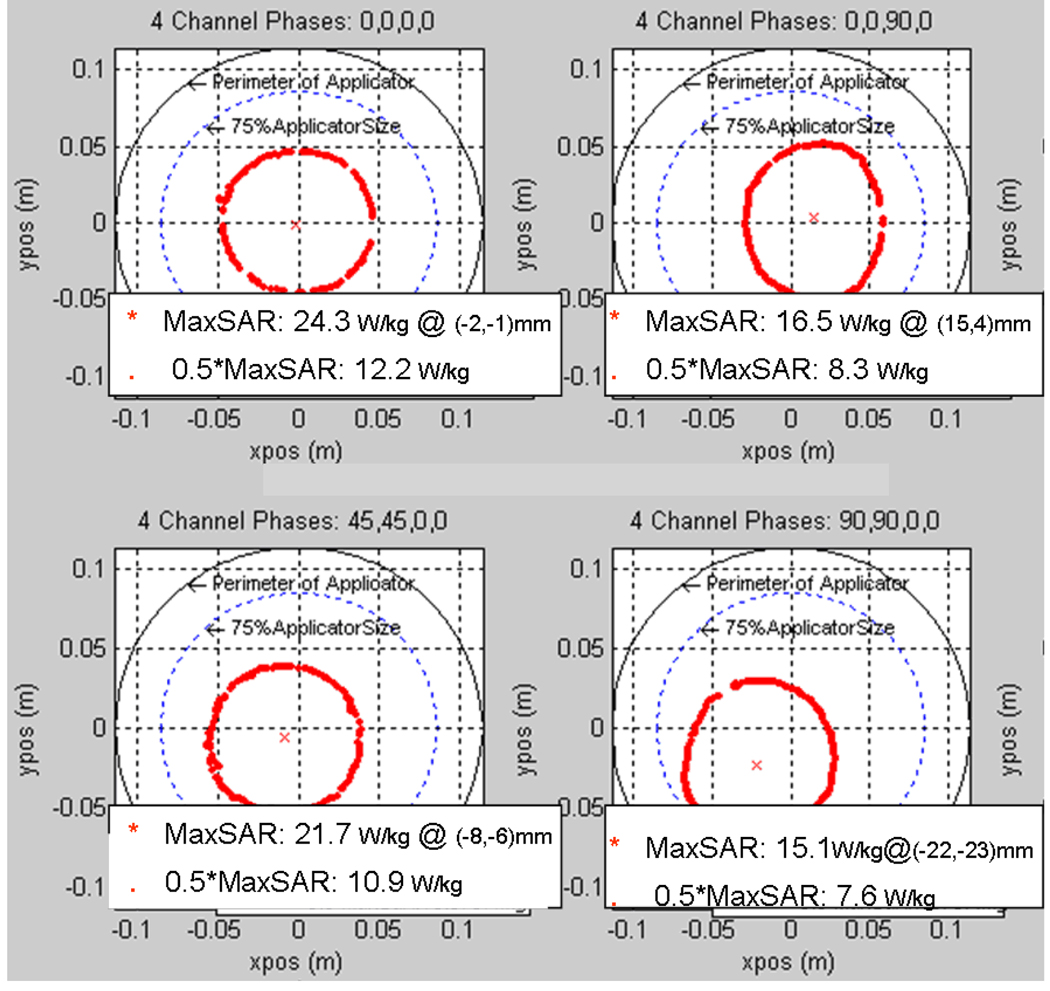
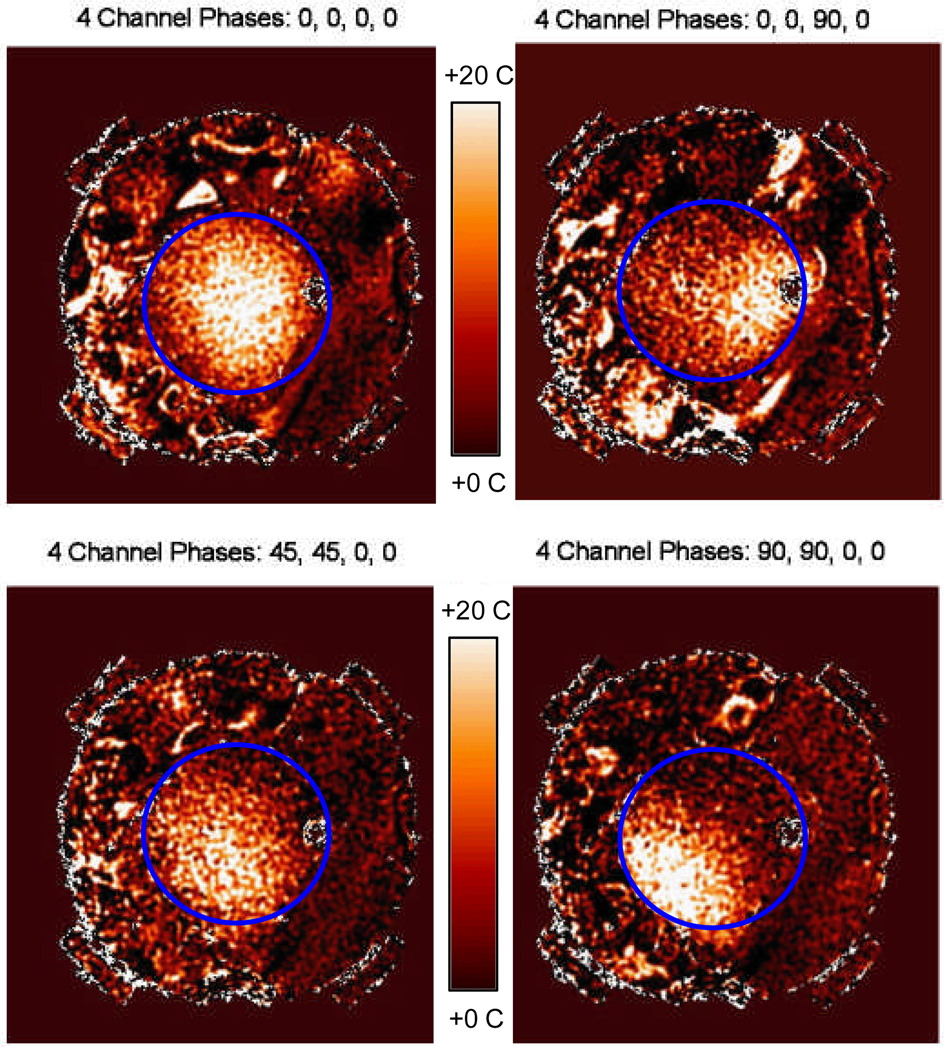
Figure 7 shows HFSS simulations of iso-SAR patterns in the x–y cross-sectional plane through the axial center of the MAPA with phantom inside for six different combinations of relative phase of the four MAPA antenna pairs. Different combinations of phase are seen to move the maximum SAR peak either horizontally to the right or diagonally towards lower left; where higher RF power deposition (i.e. which will produce increased temperature rise) is shown in orange. The SARmax around the outer edge of the phantom is caused by the high near field adjacent to each dipole, which has little effect on the heating process of the phantom inside the MAPA. The temperature rise from these superficial high SAR spots under each antenna is reduced by the surrounding water, with minimal effect on the focal heating of the phantom interior. To show more details of the heating inside the phantom, we exported the useful solution data into a Matlab program. Figure 8 shows contour plots of where the RF power deposition is at least 50 percent of the maximum value and the position (*) and magnitude of the local SAR maximum (SARmax). Figure 9 shows the actual relative temperature changes in the gel phantom due to various settings of the MAPA. The greatest temperature changes are shown in yellow in Figure 9.
Figure 7.
HFSS simulation results in the x–y plane (X: horizontal; Y: vertical) for four different combinations of relative phase of the four MAPA antennas which produce movement of the SAR peak either horizontally to the right or diagonally towards lower left. Higher SAR is shown in orange. Relative phases are labeled at top.
Figure 8.
Peak SAR region in the x–y plane for four different combinations of relative phase of the four MAPA antenna pairs which moves the peak SAR either horizontally to the right or diagonally towards lower left. Relative phases are labeled at top.
Figure 9.
Shifting of temperature rise within the phantom as measured by MRTI for 4 different antenna phase setups. Note the visual correlation of MR measured shift of focal heating with the theoretical simulations of Figures 7 and 8. 12 cm dia phantom outline shown in blue.
From the simulated and measured data, we find that: 1) at 140 MHz, SAR can be adjusted to move a 9 cm diameter focal hot spot around within 75 percent of the array diameter by adjusting relative phase of the four antennas, 2) local SAR is maximized when all 4 antennas are in phase, producing a maximum SAR (SARmax) of 24.3 W/kg at the center and a full width at half maximum (FWWM) of approximately 9 cm diameter, 3) the SAR peak and the 50% iso-SAR contour shift away from the antenna(s) with higher phase angle, 4) increasing phase beyond the value that shifts the 50% contour past the 75% of applicator diameter region will cause the single focus to split into two separate regions, and 5) due to imperfect phantom with large air bubble inclusions, non-cylindrical geometry and asymmetric location in the applicator, simulation and experimental results differ slightly. Visual inspection of Figures 7–9 shows that simulations match experimental measurements quite well in terms of location and extent of SAR focus inside the phantom. After investigating how to control the location of the focus in a homogeneous medium, our next step was to simulate a realistic heterogeneous human body model inside the phased array applicator.
Correlation of Simulations with Measurements in Clinical Cases
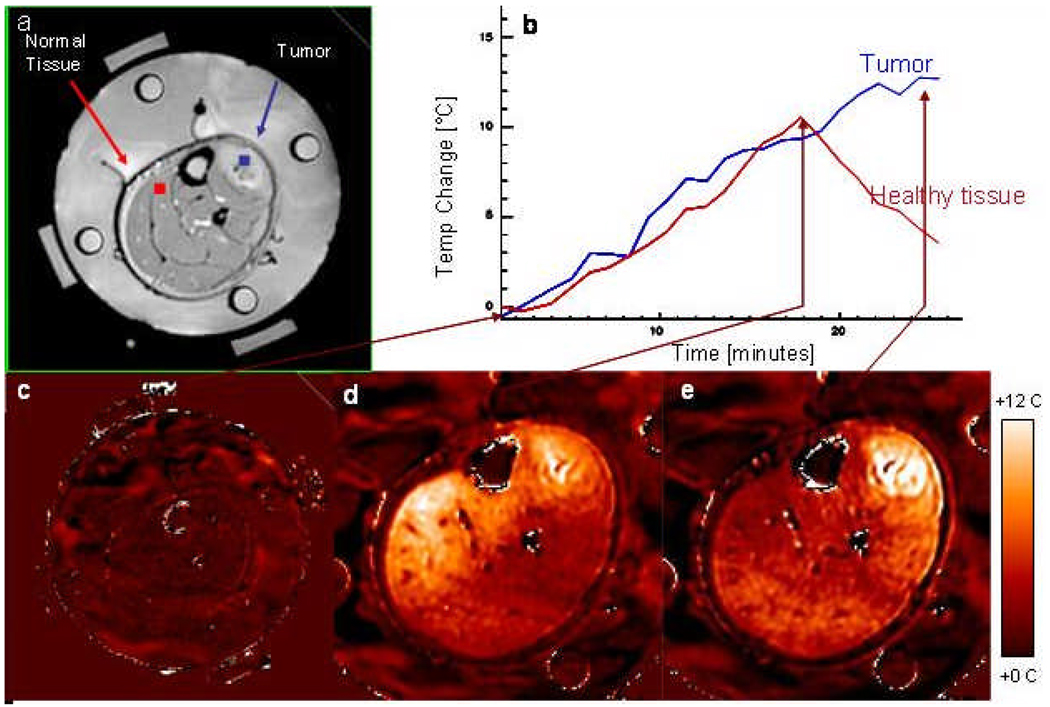
When hyperthermia is used in conjunction with PRFS MRI methods, heating within the tumor and surrounding normal tissues can be visualized in near realtime during hyperthermia treatments in multiple 2-D cross section MR images of the target region. Temperature rise distributions during a clinical hyperthermia treatment of an advanced fibrous histiocytoma (soft-tissue sarcoma) tumor in the lower leg are shown in Figure 10. Four fiberoptic sensors spaced 1.5 cm apart were inserted into tumor via a #15ga catheter from the upper right of image, to correlate interstitial temperature measurements with temperature rise data from the MR images (7). Absolute tissue temperatures were recorded in the four locations and MRTI displayed the relative temperature changes everywhere else in tumor and surrounding normal tissues. For the first 18 minutes of treatment, RF signals of equal amplitude and phase were applied to the four antenna pairs. As expected, this excitation scheme resulted in a beam that is focused in the center of the roughly cylindrical volume of interest (leg). Temperature rise was maximum near the center of the leg and decreased radially outward, though there were relatively hotter regions in the low perfusion tumor core and in a region of normal tissue in the left side of leg. After 18 minutes, the phases were adjusted to steer RF energy away from normal tissue and towards the center of the tumor. After 25 minutes the highest temperature (hot spot) is shifted into the tumor region at upper right and much lower temperature rise is seen distributed rather uniformly across the normal muscle.
Figure 10.
Dosimetry of a clinical hyperthermia treatment of an advanced fibrous histiocytoma (soft-tissue sarcoma) tumor in the lower leg. a) Anatomic MRI of patient’s lower leg inside MAPA applicator with 4 dipole antenna pairs and 4 silicon oil reference tubes. b) Temperature as a function of time. c) Baseline temperature change map after 4 minutes of imaging without heat - temperatures in the leg are stable; d) Temperature change map at approximately 18 minutes into treatment - although tumor is heating, excessive heat is seen in normal tissue on the opposite side of leg; e) 25 minutes into treatment after adjusting antenna phases to focus heat primarily in the tumor region at upper right.
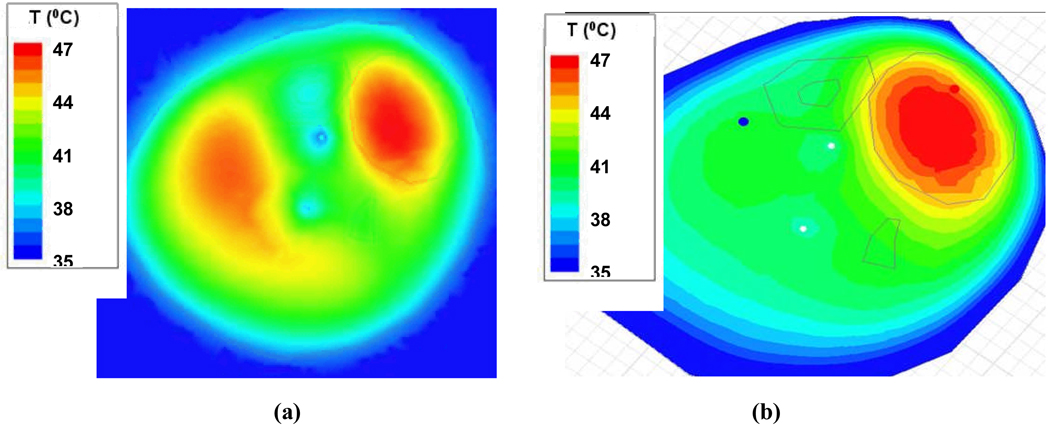
The ability to image tissue temperature rise as an aide for steering heat into the tumor is clearly shown in the MRI time sequence in Figure 10. The temperature rise above baseline temperature is quantified by the MR thermal imaging program and displayed in Figure 10b for two operator selected regions of interest – one in the center of the normal tissue region at upper left of leg and one in the center of the tumor target (upper right) immediately adjacent to one of the invasive fiberoptic temperature sensors. The accuracy of MR thermal imaging at this institution has been evaluated relative to invasive sensor measurements and published previously (7, 44). The ability to simulate this result with Ephysics is shown in Figure 11, where higher relative temperature changes are shown in red as indicated by the color scale. Encouraged by this ability to replicate actual treatment results with coupled SAR/thermal simulations, we decided to proceed to investigate a more complex clinical case.
Figure 11.
Simulated temperature distributions for a hyperthermia treatment of the human sarcoma shown in Figure 10. a) Predicted temperature distribution for the leg at approximately 18 minutes into treatment using equal phase and amplitude excitation, heat is focused in the low perfusion tumor region but also heats normal tissue on the left side of leg; b) temperature distribution for the leg predicted for 25 minutes into treatment after adjusting antenna phase to the simulated optimal values, heat is focused primarily in the tumor region in upper right of leg.
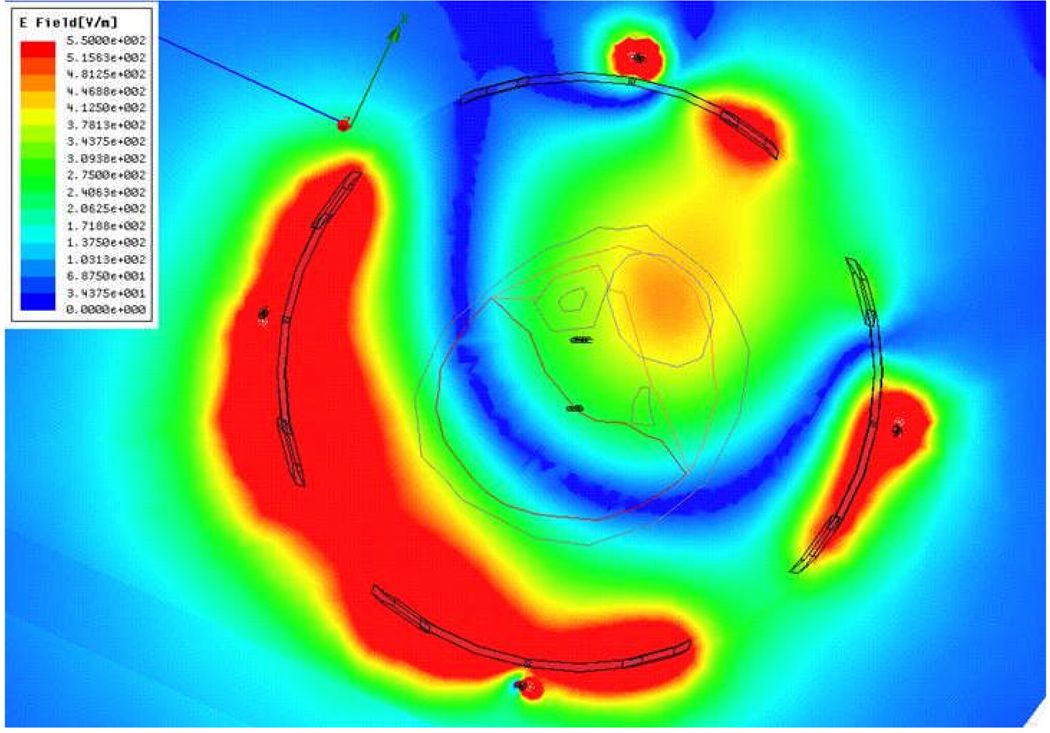
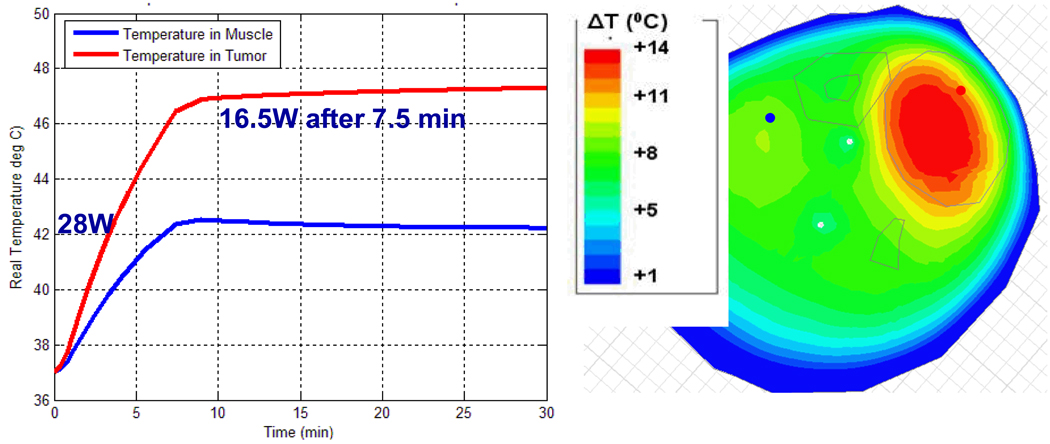
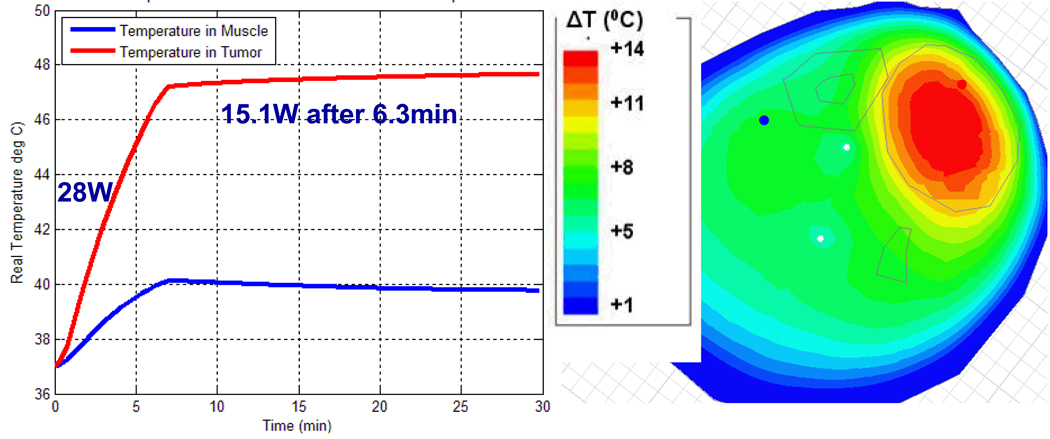
For the next step of using simulations to assist treatment planning by specifying the applied antenna signals prior to starting the treatment, we implemented the following procedure. Starting with just two antennas at equal power, we found the phase delay of the second antenna that maximized field in the tumor. We repeated this process for antenna 3 and then 4, maintaining equal power for each antenna. The combination of phases obtained with this approach is the one where the fields from each antenna add constructively in the tumor, resulting in the highest SAR as shown in Figure 12. In the second clinical case, the phase configuration: 0-30-60-0 is the optimized setup obtained experimentally during clinical hyperthermia treatment by monitoring the slowly responding temperatures with MRTI and iteratively adjusting phase angles to obtain better focus in tumor. The phase settings obtained manually during treatment are good but not necessarily optimal, and they took over 20 min to achieve. To evaluate the quality of this manual optimization, we entered the experimental optimum result into the simulation software to determine how much time would be needed to bring the tumor to 47°C, how much power would be required to maintain those temperatures, and what the temperature of surrounding healthy tissue would be. As shown in Figure 13, to keep 47°C in the tumor, we could reduce the power from 28 W to 16.5 W after 7.5 minutes. During treatment, the temperature in normal tissue was 42°C. Using simulations to optimize phase settings prior to treatment, we found the optimized settings to be 0-70-95-5 and the corresponding simulated temperature distribution is shown in Figure 14. Using simulations, we found that the 0-70-95-5 phase settings produced a better result than the one obtained with empirical adjustments during treatment. Figure 14 shows that after 6.3 minutes (a shorter time than before) we could reduce the power from 28 W to 15.1 W (a lower power than before). We were able to maintain 47.5°C in the tumor with less than 40°C in normal tissue (which increased to 42°C in the experimentally adjusted case). Less power was required overall, and less energy was absorbed in the normal tissue.
Figure 12.
E-field distribution when phases of each antenna are optimized: Antenna 1: 0°, Antenna 2: 70°, Antenna 3: 95°, and Antenna 4: 5°.
Figure 13.
Simulated temperature in tumor and muscle with phase adjusted experimentally for focused heat in leg tumor: Antenna 1: 0°, Antenna 2: 30°, Antenna 3: 60°, and Antenna 4: 0°.
Figure 14.
Simulated temperature in tumor and muscle with phase optimized with HFSS: Antenna 1: 0°, Antenna 2: 70°, Antenna 3: 95°, and Antenna 4: 5°.
The optimization procedure used above involves coupled electromagnetic and thermal simulations that require many assumptions on the electrical and thermal properties of tissue. Electrical properties of normal and even some tumor tissues are well-characterized in the literature and representative values for all body tissues are contained in the complex body model available from Ansoft Corp., which is pre-meshed and ready for use in FEM simulations. After assigning expected tissue properties to the tumor and inserting that tumor into the standard pregridded body model, the electromagnetic field was calculated while iterating antenna excitation settings to optimize SAR pattern. For thermal simulations, much work has been done to characterize thermal properties of tissue, especially blood perfusion. The literature provides a broad range of values for perfusion, which varies widely for different tissue types as well as spatially and temporally during treatment within each tissue region, and in response to heating. Thus, perfusion (and tissue cooling) can only be estimated for each tissue and some provision must be made for variation of perfusion during treatment. In this work, we included a time varying temperature dependent perfusion in the simulations to replicate the effect of variable tissue cooling which occurs as a function of increasing temperature during treatment. This realistic modeling of time and temperature dependent cooling added after the initial calculation of power deposition, goes beyond previous studies of SAR optimization in annular array heating systems. The coupled SAR and temperature dependent perfusion thermal modeling approach to treatment planning is a novel feature of this study. Our data in Figure 11 show that inclusion of temperature dependent perfusion in the coupled SAR/thermal simulations can facilitate accurate simulation of complex heating patterns in heterogeneous tissue. Although these simulations can never be exact due to errors in the assumptions of tissue properties (especially perfusion), this work also shows that when performed prior to treatment the optimized simulation results should be useful for improving the probability of a successful treatment for an individual patient by starting from a better focus. Based on the success of this coupled SAR/thermal modeling, our aim is to select optimum phase and amplitude settings for the applicator for each patient with this fast and approximate generic patient treatment planning simulation and thereby improve the quality of heat treatment by starting from a near optimal heating configuration right from the beginning of therapy. With this preplanning, we can rely on temperature monitoring during treatment to make minor adjustments that will account for patient specific heating characteristics that are different than the simulations of the simplified hybrid generic patient with patient specific tumor model. Future efforts are expected to extend the use of MRTI volumetric temperature measurements into a feedback loop to iteratively correct the precalculated excitation parameters and thereby improve realtime guidance of heating based on a continuously updated treatment plan during treatment.
Conclusions
This study investigates the feasibility of using a novel coupled 3-D FEM electromagnetic and thermodynamic simulation approach to improve the planning and realtime control of hyperthermia treatments when combined with PRFS Magnetic Resonance Thermal Imaging. Phantom experiments in non-perfused homogeneous tissue models validated the treatment planning approach by matching simulated iso-SAR and temperature rise distributions with experimental temperature rise measured with MRTI. For more realistic modeling of temperature distributions in tissue regions with spatially and temporally variable perfusion, the thermodynamic simulator was used with temperature dependent perfusion. To speed up calculations for routine treatment planning with complex heterogeneous temperature dependent tissue properties, the model was constructed with patient specific tumor geometry and properties inserted into a commercially available human body model with preconfigured tissue properties for each tissue region. This novel hybrid model planning approach was validated with measurements and corresponding simulations from two clinical hyperthermia treatments of advanced soft tissue sarcomas of the leg. This study demonstrates a close correlation of temperature distributions simulated with readily available coupled SAR and thermal modeling software with temperatures measured during clinical hyperthermia treatments, and thus demonstrates the feasibility of starting each treatment with a fast and sufficiently accurate pretreatment plan that produces improved localization of heat in the tumor earlier in treatment than is possible with MR thermal image feedback alone.
Acknowledgments
This project is supported by NIH grant 5PO1-CA042745. The authors thank a large number of co-workers at Duke University Medical Center who helped carry out experiments leading to the research results that are reported here. The first author also gratefully acknowledges the software and technical support from Dane Thompson and the development group at Ansys/Ansoft Corporation during her summer internship, and generous support of measurement equipment from Michael Hoffman at Agilent.
References
- 1.Dewhirst MW, Vujaskovic Z, Jones E, Thrall D. Re-setting the biologic rationale for thermal therapy. International Journal of Hyperthermia. 2005 Dec;21(8):779–790. doi: 10.1080/02656730500271668. [see comment] [DOI] [PubMed] [Google Scholar]
- 2.Stauffer PR. Evolving technology for thermal therapy of cancer. Int J Hyperthermia. 2005 Dec;21(8):731–744. doi: 10.1080/02656730500331868. [DOI] [PubMed] [Google Scholar]
- 3.Paulides MM, Bakker JF, van Rhoon GC. Electromagnetic head-and-neck hyperthermia applicator: experimental phantom verification and FDTD model. Int J Radiat Oncol Biol Phys. 2007 Jun 1;68(2):612–620. doi: 10.1016/j.ijrobp.2007.01.035. [DOI] [PubMed] [Google Scholar]
- 4.Cheng KS, Stakhursky V, Stauffer P, Dewhirst M, Das SK. Online feedback focusing algorithm for hyperthermia cancer treatment. International Journal of Hyperthermia. 2007 Nov;23(7):539–554. doi: 10.1080/02656730701678877. PMCID: PMC2699762. [DOI] [PMC free article] [PubMed] [Google Scholar]
- 5.Gellermann J, Wust P, Stalling D, Seebass M, Nadobny J, Beck R, et al. Clinical evaluation and verification of the hyperthermia treatment planning system hyperplan. Int J Radiat Oncol Biol Phys. 2000 Jul 1;47(4):1145–1156. doi: 10.1016/s0360-3016(00)00425-9. [DOI] [PubMed] [Google Scholar]
- 6.Sreenivasa G, Gellermann J, Rau B, Nadobny J, Schlag P, Deuflhard P, et al. Clinical use of the hyperthermia treatment planning system HyperPlan to predict effectiveness and toxicity. Int J Radiat Oncol Biol Phys. 2003 Feb 1;55(2):407–419. doi: 10.1016/s0360-3016(02)04144-5. [DOI] [PubMed] [Google Scholar]
- 7.Craciunescu O, Stauffer P, Soher B, Maccarini P, Das S, Cheng K, et al. Accuracy of real time noninvasive temperature measurements using magnetic resonance thermal imaging in patients treated for high grade extremity soft tissue sarcomas. Medical Physics. 2009;36(11):4848–4858. doi: 10.1118/1.3227506. PMCID2773239. [DOI] [PMC free article] [PubMed] [Google Scholar]
- 8.Gellermann J, Wlodarczyk W, Feussner A, Fähling H, Nadobny J, Hildebrandt B, et al. Methods and potentials of magnetic resonance imaging for monitoring radiofrequency hyperthermia in a hybrid system. Int J Hyperthermia. 2005;21:497–513. doi: 10.1080/02656730500070102. [DOI] [PubMed] [Google Scholar]
- 9.Stakhursky VL, Arabe O, Cheng KS, Macfall J, Maccarini P, Craciunescu O, et al. Real-time MRI-guided hyperthermia treatment using a fast adaptive algorithm. Physics in Medicine and Biology. 2009 Apr 7;54(7):2131–2145. doi: 10.1088/0031-9155/54/7/019. [DOI] [PMC free article] [PubMed] [Google Scholar]
- 10.Weihrauch M, Wust P, Weiser M, Nadobny J, Eisenhardt S, Budach V, et al. Adaptation of antenna profiles for control of MR guided hyperthermia (HT) in a hybrid MR-HT system. Med Phys. 2007 Dec;34(12):4717–4725. doi: 10.1118/1.2804617. [DOI] [PubMed] [Google Scholar]
- 11.Field SB, Hand JW. An Introduction to the Practical Aspects of Clinical Hyperthermia. 1990 [Google Scholar]
- 12.Wust P, Nadobny J, Felix R, Deulhard P, Louis A, John4 W. Strategies for optimized application of annular-phased-array systems in clinical hyperthermia. International Journal of Hyperthermia. 1991;7(1):157–173. doi: 10.3109/02656739109004986. [DOI] [PubMed] [Google Scholar]
- 13.Wust P, Beck R, Berger J, Fähling H, Seebass M, Wlodarczyk W, et al. Electric field distributions in a phased-array applicator with 12 channels: measurements and numerical simulations. Med Phys. 2000;27:2565–2579. doi: 10.1118/1.1319521. [DOI] [PubMed] [Google Scholar]
- 14.Das S, Clegg S, Samulski T. Computational techniques for fast hyperthermia temperature optimization. Medical Physics. 1999;26(2):319–328. doi: 10.1118/1.598519. [DOI] [PubMed] [Google Scholar]
- 15.Lin JC, Wang Z. SAR and Temperature Distributions in Canonical Head Models Exposed to Near- and Far-Field Electromagnetic Radiation at Different Frequencies. Electromagnetic Biology and Medicine. 2005;24(3):405–421. [Google Scholar]
- 16.Plewako J, Krawczyk A, Grochowicz B. Computer Engineering in Applied Electromagnetism. Netherlands: Springer; 2005. pp. 337–342. [Google Scholar]
- 17.Zhang Y, Joines WT, Jirtle RL, Samulski TV. Theoretical and measured electric field distributions within an annular phased array: consideration of source antennas. IEEE Trans Biomed Eng. 1993;40:780–787. doi: 10.1109/10.238462. [DOI] [PubMed] [Google Scholar]
- 18.Turner PF. Mini-Annular Phased Array for Limb Hyperthermia. Microwave Theory and Techniques, IEEE Transactions on. 1986;34(5):508–513. [Google Scholar]
- 19.Gellermann J, Hildebrandt B, Issels R, Ganter H, Wlodarczyk W, Budach V, et al. Noninvasive magnetic resonance thermography of soft tissue sarcomas during regional hyperthermia: correlation with response and direct thermometry. Cancer. 2006 Sep 15;107(6):1373–1382. doi: 10.1002/cncr.22114. [DOI] [PubMed] [Google Scholar]
- 20.Ludemann L, Wlodarczyk W, Nadobny J, Weihrauch M, Gellermann J, Wust P. Noninvasive magnetic resonance thermography during regional hyperthermia. Int J Hyperthermia. 2010;26(3):273–282. doi: 10.3109/02656731003596242. [DOI] [PubMed] [Google Scholar]
- 21.van Rhoon GC, Wust P. Introduction: non-invasive thermometry for thermotherapy. Int J Hyperthermia. 2005 Sep;21(6):489–495. doi: 10.1080/02656730500272963. [DOI] [PubMed] [Google Scholar]
- 22.Brady WL, Heilmann HP, Altschuler MD, Bova PBaFJ, Buchsbaum ABaDJ, Fessenden GTYCaP, et al. Radiation Therapy Physics (Medical Radiology / Radiation Oncology) Springer; 1996. [Google Scholar]
- 23.Seip R, Ebbini ES. Noninvasive estimation of tissue temperature response to heating field using diagnostic ultrasound. IEEE Trans Biomed Eng 42. 1995;42:828–839. doi: 10.1109/10.398644. [DOI] [PubMed] [Google Scholar]
- 24.Zuna I, Novak P. Noninvasive monitoring of temperature distribution in the target field of hyperthermia by ultrasonic tissue characterization. Ultrasound Med Biol. 2000;26:4. [Google Scholar]
- 25.Arthur RM, Straube WL, Trobaugh JW, Moros EG. Non-invasive estimation of hyperthermia temperatures with ultrasound. International Journal of Hyperthermia. 2005;21(6):589–600. doi: 10.1080/02656730500159103. [DOI] [PubMed] [Google Scholar]
- 26.Griffiths H. Applied potential tomography for non-invasive temperature mapping in hyperthermia. Clin Phys Physiol Meas. 1987;8:147–153. doi: 10.1088/0143-0815/8/4a/019. [DOI] [PubMed] [Google Scholar]
- 27.Meaney PM, Paulsen KD, Fanning MW, Li D, Fang Q. Image accuracy improvements in microwave tomographic thermometry: phantom experience. International Journal of Hyperthermia. 2003 Sep–Oct;19(5):534–550. doi: 10.1080/0265673031000082386. [DOI] [PubMed] [Google Scholar]
- 28.Hand JW, Van Leeuwen GMJ, Mizushina S, Van De Kamer JB, Maruyama K, Sugiura T, et al. Monitoring of deep brain temperature in infants using multi-frequency microwave radiometry and thermal modelling. Physics in Medicine and Biology. 2001;46(7):1885–1903. doi: 10.1088/0031-9155/46/7/311. [DOI] [PubMed] [Google Scholar]
- 29.Jacobsen S, Stauffer P. Non-invasive temperature profile estimation in a lossy medium based on multi-band radiometric signals sensed by a microwave dual-purpose body-contacting antenna. International Journal of Hyperthermia. 2002;18(2):86–103. doi: 10.1080/02656730110092341. [DOI] [PubMed] [Google Scholar]
- 30.Jacobsen S, Stauffer PR. Can we settle with single-band radiometric temperature monitoring during hyperthermia treatment of chestwall recurrence of breast cancer using a dual-mode transceiving applicator? Phys Med Biol. 2007 Feb 21;52(4):911–928. doi: 10.1088/0031-9155/52/4/004. [DOI] [PubMed] [Google Scholar]
- 31.Peters RD, Hinks RS, Henkelman RM. Ex vivo tissue-type independence in proton-resonance frequency shift MR thermometry. Magn Reson Med. 1998;40:454–459. doi: 10.1002/mrm.1910400316. [DOI] [PubMed] [Google Scholar]
- 32.Denis dSB, Quesson B, Moonen CT. Magnetic resonance temperature imaging. Int J Hyperthermia. 2005;21:515–531. doi: 10.1080/02656730500133785. [DOI] [PubMed] [Google Scholar]
- 33.Vigen KK, Daniel BL, Pauly JM, Butts K. Triggered, navigated, multi-baseline method for proton resonance frequency temperature mapping with respiratory motion. Magn Reson Med. 2003;50:1003–1010. doi: 10.1002/mrm.10608. [DOI] [PubMed] [Google Scholar]
- 34.Bolan PJ, Henry PG, Baker EH, Meisamy S, Garwood M. Measurement and correction of respiration-induced B0 variations in breast 1H MRS at 4 Tesla. Magn Reson Med. 2004;52:1239–1245. doi: 10.1002/mrm.20277. [DOI] [PubMed] [Google Scholar]
- 35.Wyatt C, Soher B, Maccarini P, Charles HC, Stauffer PR, MacFall J. Hyperthermia MRI Temperature Measurement: Evaluation of Measurement Stabilization Strategies for Extremity and Breast Tumors. Int J Hyperthermia. 2009;25(6):422–433. doi: 10.1080/02656730903133762. [DOI] [PMC free article] [PubMed] [Google Scholar]
- 36.Lagendijk JJW. Hyperthermia treatment planning. Phys Med Biol. 2000;45:R61–R76. doi: 10.1088/0031-9155/45/5/201. [DOI] [PubMed] [Google Scholar]
- 37.Bardati F, Borrani A, Gerardino A, Lovisolo G. SAR optimization in a phased array radiofrequency hyperthermia system. IEEE Trans Biomed Eng. 1995;42(12):1201–1207. doi: 10.1109/10.476127. [DOI] [PubMed] [Google Scholar]
- 38.Bruijne MD, Samaras T, Chavannes N, Rhoon GCv. Quantitative validation of the 3D SAR profile of hyperthermia applicators using the gamma method. Phys Med Biol. 2007;52:3075–3088. doi: 10.1088/0031-9155/52/11/010. [DOI] [PubMed] [Google Scholar]
- 39.Chou CK. Use of heating rate and specific absorption rate in the hyperthermia clinic. International Journal of Hyperthermia. 1990;6(2):367–370. doi: 10.3109/02656739009141144. [DOI] [PubMed] [Google Scholar]
- 40.Paulides MM, Wielheesen DHM, Zee JVD, Rhoon GCV. Assessment of the local SAR distortion by major anatomical structures in a cylindrical neck phantom. International Journal of Hyperthermia. 2005;21:125–140. doi: 10.1080/02656730400013855. [DOI] [PubMed] [Google Scholar]
- 41.Sherar MD, Gladman AS, Davidson SRH, Easty AC, Joy ML. Infrared thermographic SAR measurements of interstitial hyperthermia applicators: errors due to thermal conduction and convection. Int J Hyperthermia. 2004;20:539–555. doi: 10.1080/02656730410001668366. [DOI] [PubMed] [Google Scholar]
- 42.El-Sharkawy AM, Schar M, Bottomley PA, Atalar E. Monitoring and correcting spatiotemporal variations of the MR scanner's static magnetic field. MAGMA. 2006 Nov;19(5):223–236. doi: 10.1007/s10334-006-0050-2. [DOI] [PMC free article] [PubMed] [Google Scholar]
- 43.Kuroda K. Non-invasive MR thermography using the water proton chemical shift. International Journal of Hyperthermia. 2005 Sep;21(6):547–560. doi: 10.1080/02656730500204495. [DOI] [PubMed] [Google Scholar]
- 44.Stauffer PR, Craciunescu O, Maccarini P, Arunachalam K, Arabe O, Stakhursky V, et al. Clinical Utility of Magnetic Resonance Thermal Imaging (MRTI) For Realtime Guidance of Deep Hyperthermia. In: Ryan TP, editor. Proc of SPIE. Vol. 7181. Bellingham WA: SPIE Press; 2009. 7181OI-1-12. [DOI] [PMC free article] [PubMed] [Google Scholar]
- 45.Chou CK, Chen G, Guy AW, Luk KH. Formulas for Preparing Phantom Muscle Tissue at Various Radiofrequencies. Bioelectromagnetics. 1984;5:435–441. doi: 10.1002/bem.2250050408. [DOI] [PubMed] [Google Scholar]
- 46.Fraass BA, McShan DL. Overview of a clinical planning system. Amsterdam: Elsevier Science; 1987. 3D treatment planning: I. [Google Scholar]
- 47.James BJ, Sullivan DM. Direct use of CT scans for hyperthermia treatment planning. Biomedical Engineering, IEEE Transactions on. 1992;39:845–851. doi: 10.1109/10.148392. [DOI] [PubMed] [Google Scholar]
- 48.Werghi N. Segmentation and Modeling of Full Human Body Shape From 3-D Scan Data: A Survey. Systems, Man, and Cybernetics, Part C: Applications and Reviews, IEEE Transactions on. 2007;37(6):1122–1136. [Google Scholar]
- 49.Pennes HH. Analysis of tissue and arterial blood temperatures in the resting human forearm. Journal of Applied Physiology. 1948;1:93–122. doi: 10.1152/jappl.1948.1.2.93. [DOI] [PubMed] [Google Scholar]
- 50.Hatfield HS, Pugh LGC. Thermal Conductivity of Human Fat and Muscle. Nature. 1951;168:918–919. doi: 10.1038/168918a0. [DOI] [PubMed] [Google Scholar]
- 51.Bowman HF. Heat transfer and thermal dosimetry. J Microw Power. 1981;16:121–133. doi: 10.1080/16070658.1981.11689231. [DOI] [PubMed] [Google Scholar]
- 52.Li Z, Vogel M, Maccarini1 PF, Arabe OA, Stakhursky V, Crawford D, et al. Towards the Validation of a Commercial Hyperthermia Treatment Planning System. Microwave Journal. 2008 [PMC free article] [PubMed] [Google Scholar]


