

Abstract
Background
Chronic alcohol consumption is a major factor for several human diseases and alcoholism is associated with a host of societal problems. One of the major alcohol- induced metabolic changes is the increased NADH levels, which reduces glucose synthesis and increases fatty acid (FA) synthesis. Probably more important is the induction of FA synthesizing enzymes under the control of sterol regulatory element binding proteins (SREBP), plus increased malonyl-CoA which blocks FA entry to the mitochondria for oxidation. The changes in FA-related lipids, particularly lysophospholipids (LPLs) and ceramides (Cers), in different tissues in ethanol-fed have not been reported.
Methods
We systematically determined the levels of FA-related lipids, including FAs, phosphatidylcholines (PCs), phosphatidylethanolamines (PEs), lysophosphatidic acid (LPA), lysophosphatidylcholine (LPC), lysophosphatidylethanolamine (LPE), lysophosphatidylinositol (LPI), sphingomyelins (SMs), and ceramides (Cers) in the serum and different tissues by high-performance-liquid-chromatography electrospray ionization tandem mass spectrometry (HPLC-ESI-MS/MS). The study was performed in C57BL/6J mice fed with Lieber DeCarli diet; in which ethanol was added to account for 27.5% of total calories. The serum and tissues were collected at the time of sacrifice in these mice and the results were compared to pair-fed controls.
Results
The important observation was that ethanol induced tissue-specific changes, which were related to different FA chains. Several 22:6 FA, 18:0 FA, 18:0 to 18:3 FA-containing lipids were significantly increased in the serum, liver, and skeletal muscle, respectively. In the kidney, all 22:6 FA-containing lipids detected were increased. In addition, alterations of other lipids in tissues, except adipose tissue, were also observed.
Conclusions
We found tissue-specific alterations in the levels of FA-related lipids after ethanol administration. The implications of these findings pertinent to human physiology/pathology warrant further investigation. More studies are needed to explore the mechanisms on the different effects of ethanol on certain lipids in different tissues.
Keywords: Ethanol, fatty acid-related lipids, phospholipids, HPLC-ESI-MS/MS
Introduction
Alcohol is causally related to several medical conditions and accounts for 4% of the global burden of disease (Room et al., 2005). One of the major consequences of alcohol metabolism is the production of an excess amount of NADH, which reduces glucose synthesis and fatty acid (FA) oxidation (Crabb and Liangpunsakul, 2006; Salaspuro and Lieber, 1979). FAs are part of the building blocks for glycerol phospholipids including lysophospholipids (LPLs). While the effects of alcohol on FA, cholesterol, and triglycerides in the liver have been studied (You et al., 2002), alcohol's effects on other FA-related lipids have not been analyzed in multiple tissues in ethanol-fed animals. Phospholipids (PLs), including sphingolipids and lysophospholipids (LPLs) have been shown to be extracellular signaling molecules, regulating a vast array of biological function, including cell survival and apoptosis (Billich and Baumruker, 2008; Chatterjee et al., 2006; Claus et al., 2009; Moolenaar, 1999). These lipids are intertwined through complex metabolic pathways and FAs are the important building blocks for these lipids (Merrill, 1983; Merrill and Williams, 1984; Salaspuro and Lieber, 1979). Very recently, our laboratory showed that ethanol increases ceramide in cultured cells and liver from ethanol fed mice (Liangpunsakul et al., 2010).
Several LPLs are potential markers for cancers, including ovarian and colorectal cancers (Sutphen et al., 2004; Xiao et al., 2000; Xiao et al., 2001; Xu et al., 1998; Zhao et al., 2007). There are several thousand publications describing the cellular and physiological functions of these FA-related lipids. In this work, we have extensively analyzed FA-related lipids in 10 groups (see Materials and Methods) with a total of 52 lipids in the serum and five tissues (liver, kidney, skeletal muscle, heart, and adipose tissues) in mice fed with ethanol and pair-fed controls. Such knowledge is of importance as it will help understand the process of dysregulation of lipid metabolism induced by alcohol.
Materials and Methods
Materials
Standard Lipids, including fatty acids (FAs), phosphatidylcholines (PCs), phosphatidylethanolamines (PEs), lysophosphatidic acids (LPAs), lysophosphatidylcholines (LPCs), lysophosphatidylethanolamines (LPEs), lysophosphatidylinositol (LPIs), sphingosine-1-phosphate (S1P), ceramides (Cers), and sphingomyelins (SMs) were purchased from Avanti Polar lipids (Birmingham, AL) or sigma (St. Louis, MO). HPLC-grade methanol (MeOH) and ammonium hydroxide (NH4OH) were purchased from sigma (St. Louis, MO) or Fisher Scientific (Pittsburgh, PA).
Animals and Diets
To study the effect of ethanol on organ lipids in vivo, 6- to 8-week-old male C57BL/6J mice (The Jackson Laboratory, Bar Harbor, ME) were fed with Lieber-DeCarli diet as previously described (You et al., 2004). In brief, animals were housed individually in a room with controlled temperature (20-22 °C), humidity (55-65%), and lighting (on at 6 a.m. and off at 6 p.m.). Protein content was constant at 18% of calories, and each diet had identical mineral and vitamin content. The animals were divided into two dietary groups: (a) control diet (fat comprising 10% of total calories, 6% from cocoa butter, and 4% from safflower oil, 72% of calories as carbohydrate, 10 mice) and (b) ethanol-containing diet (identical to the control diet but with ethanol added to account for 27.5% of total calories and the caloric equivalent of carbohydrate (maltose-dextrin) removed, 10 mice). The animals were pair-fed for 4 weeks then sacrificed. The experimental protocols were approved by the Indiana University School of Medicine Animal Care and Use Committee.
Tissue/serum lipid extraction and analysis
At the time of sacrifice, blood was withdrawn by cardiac puncture. Gastrocnemius muscle, liver, heart, kidneys, and epididymal fat were harvested, as rapidly as possible, immediately freeze-clamped with Wollenberger tongs at the temperature of liquid nitrogen, powdered under liquid nitrogen with a mortar and pestle, and stored at -85°C for analysis.
All extractions were performed either in siliconized tubes (PGC Scientifics, Frederick, Maryland) or in glass tubes. We have developed a simple phospholipid extraction method and call it “the MeOH method” (Zhao and Xu, 2010). In brief, tissue powders in water were further homogenized using a Brinkmann POLYTRON PT 10/35 Homogenizer. 50 μL (∼5.0 mg of the tissue) from each tissue sample or 10 μL of serum were added into 1 mL of MeOH with 500 pmol of 12:0 LPC, 100 pmol of 14:0 LPA and 100 pmol of 17:0 Cer as the internal standard (IS). After vortex and incubation on ice for 10 min, the mixture was centrifuged (10,000g, 5min, room temperature), and 120 μL of supernatant were directly used for mass spectrometry (MS) analysis.
MS analyses were performed using API-4000 (Applied Biosystems/MDS SCIEX) with the Analyst data acquisition system. Multiple reaction monitoring (MRM) mode was used for measurement of lipids. Standard curves were established for quantitative analyses of all lipids. Typical operating parameters are as follows: nebulizing gas (NEB) 15, curtain gas (CUR) 8, collision-activated dissociation (CAD) gas 35, electrospray voltage 5000 with positive ion MRM mode or -4200 with negative ion MRM mode, and a temperature of heater at 500°C. Negative ion MRM mode was used for the quantitative analysis of FAs, S1P, LPAs, LPEs, LPIs, and PEs. HPLC conditions were totally same as we described previously (Zhao and Xu, 2010). Samples (10 μL) were loaded through a LC system (Agilent 1100) with an auto sampler. The mobile phase was MeOH/water/NH4OH (90:10:0.1, v/v/v) and the HPLC separations were 15 min/sample. Cers were also detected by negative ion MRM mode, and LPCs, SMs and PCs were determined by positive ion MRM mode for the quantitative analysis. While HPLC separation was not necessary for these lipids, samples (10 μL) were directly injected into the MS ion source, and the mobile phase was MeOH/water/NH4OH (90:10:0.1, v/v/v) and the flow rate was 0.2 mL/min, with a duration time 1.5 min/sample.
Statistical analysis
Different values among groups were compared using Student's t test. Correlation analyses of lipids among several tissues were performed using Pearson's correlation coefficient. In order to study whether there are across organ differences in lipids levels between control and ethanol groups, a hierarchical cluster analysis was performed using the R package ‘pvclust’. All statistical tests were two-sided, and P values less than .05 were considered to be statistically significant. The package provides two types of p-values: AU (Approximately Unbiased) p-value and BP (Bootstrap Probability) value. AU p-value is a better approximation to unbiased p-value than BP value. We thus used AU p-values to determine clustering.
Results
Ethanol intake had no apparent effect on the health status of the animals. A steady average 2 to 3 g increase in the body weight was observed in both groups during the entire 4-week study; however, body weight did not vary between these two groups at the end of experiment. There was significant hepatic steatosis at the end of 4-week experiment in ethanol-fed mice when compared to pair-fed controls.
Major lipid changes in the serum and different tissues
The significant lipid changes in the serum and other tissues are shown in Tables 1 to 5. In the serum, the total FAs and SMs were significantly increased in the alcohol-fed group. While the total lipids in other groups did not significantly change, some individual lipids containing a 22:6 fatty acid chain were significantly increased by 34-137%. All SMs tested were also significantly increased by 18-48% (Table 1). On the contrary, lipids containing a 16:0 and/or a 18:0 FA chain were significantly decreased by 23-39%.
Table 1. FA-related lipids significantly altered by alcohol in the serum (n = 10 in each group).
| Serum | Ethanol-fed mice | Pair-fed control | |||
|---|---|---|---|---|---|
| μM | mean | SD | mean | SD | P |
| 22:6 FA | 15.5 | 8.6 | 6.5 | 2.8 | 0.0061 |
| 22:6 LPA | 0.044 | 0.012 | 0.033 | 0.008 | 0.0308 |
| 22:6 LPE | 0.7 | 0.2 | 0.4 | 0.1 | 0.0025 |
| 16:0 SM | 57.0 | 10.6 | 48.1 | 7.5 | 0.0488 |
| 18:1 SM | 3.2 | 0.7 | 2.4 | 0.5 | 0.0101 |
| 18:0 SM | 10.7 | 2.7 | 7.3 | 1.4 | 0.0021 |
| 18:2 LPA | 0.128 | 0.032 | 0.097 | 0.019 | 0.0186 |
| 16:0 LPA | 0.039 | 0.011 | 0.050 | 0.011 | 0.0362 |
| 16:0/20:4 PC | 225.9 | 57.0 | 336.8 | 90.7 | 0.0059 |
| 18:0 LPA | 0.032 | 0.016 | 0.052 | 0.014 | 0.0084 |
| 18:0/20:4 PC | 121.3 | 33.4 | 165.6 | 42.8 | 0.0232 |
FA: fatty acid, LPE: lysophosphatidylethanolamine, SM: sphingomyelin, LPA: lysophosphatidic acid, PC: phosphatidylcholine
Table 5. FA-related lipids significantly altered by alcohol in the heart (n = 10 in each group).
| Heart | Ethanol-fed mice | Pair-fed control | |||
|---|---|---|---|---|---|
| pmol/mg | mean | SD | mean | SD | P |
| 16:0/18:1 PE | 67.1 | 23.1 | 44.3 | 16.7 | 0.0239 |
| 16:0/18:2 PE | 69.9 | 35.8 | 30.1 | 5.9 | 0.0029 |
| 16:0/20:4 PE | 282.4 | 90.2 | 188.2 | 48.7 | 0.0105 |
| 16:0/22:6 PE | 863.0 | 222.4 | 590.4 | 154.5 | 0.0061 |
| 18:0/18:2 PE | 198.4 | 105.4 | 88.2 | 28.5 | 0.0054 |
| 18:0/22:6 PE | 1031.5 | 297.8 | 765.0 | 203.7 | 0.0346 |
| 22:6 LPE | 34.6 | 6.3 | 26.6 | 5.5 | 0.0092 |
| 16:0/20:4 PC | 1152.8 | 82.0 | 1053.5 | 113.7 | 0.0454 |
| 18:0/18:3 PC | 143.7 | 29.9 | 105.2 | 17.8 | 0.0030 |
| 18:0/18:2 PC | 230.4 | 67.0 | 166.5 | 21.7 | 0.0108 |
| 18:0/20:4 PC | 1145.1 | 108.9 | 1017.5 | 148.0 | 0.0491 |
| 16:0/18:0 PC | 130.8 | 4.2 | 142.3 | 13.7 | 0.0276 |
| 16:0 SM | 216.1 | 44.7 | 264.7 | 53.7 | 0.0481 |
| 18:1 SM | 19.7 | 3.6 | 25.9 | 6.3 | 0.0196 |
| 18:0 SM | 179.6 | 16.2 | 210.2 | 36.8 | 0.0343 |
| 16:0 LPI | 11.1 | 2.0 | 21.7 | 5.5 | 4.7×10E-05 |
| 18:0 LPI | 119.8 | 23.4 | 167.8 | 41.6 | 0.0073 |
| 22:5 FA | 79.3 | 26.4 | 170.0 | 52.3 | 0.0002 |
| S1P | 0.6 | 0.1 | 0.9 | 0.3 | 0.0198 |
| 20:0 Cer | 21.3 | 4.7 | 29.6 | 5.0 | 0.0017 |
PE: phosphatidylethanolamine, LPE: lysophosphatidylethanolamine, PC: phosphatidylcholine, SM: sphingomyelin, LPI: lysophosphatidylinositol, FA: fatty acid, S1P: sphingosine-1-phosphate, Cer: ceramide
In hepatic tissues, lipids containing 18:0 fatty acid chain were significantly increased by 31-36% and 22:6 LPE increased ∼100% in ethanol-fed mice (P<0.05) (Table 2). On the contrary, several lipids were reduced in the alcohol group, including 22:5 FA and 18:1 LPA (decreased ∼50%), as well as lipids containing 20:4 fatty acid chain decreased by 23-31%.
Table 2. FA-related lipids significantly altered by alcohol in the liver (n = 10 in each group).
| Liver | Ethanol-fed mice | Pair-fed control | |||
|---|---|---|---|---|---|
| pmol/mg | mean | SD | mean | SD | P |
| 18:0 Cer | 8.1 | 1.1 | 6.0 | 1.1 | 0.0118 |
| 18:0/18:2 PC | 186.0 | 36.5 | 141.6 | 16.2 | 0.0375 |
| 18:0/18:1 PC | 128.4 | 18.8 | 97.2 | 8.6 | 0.0097 |
| 22:6 LPE | 3.7 | 1.1 | 1.9 | 0.5 | 0.0122 |
| 16:0 Cer | 27.3 | 3.7 | 21.6 | 3.2 | 0.0302 |
| 22:5 FA | 25.9 | 11.4 | 53.9 | 10.0 | 0.0033 |
| 20:4 LPA | 2.41 | 0.52 | 3.17 | 0.45 | 0.0378 |
| 20:4 LPC | 13.8 | 3.6 | 20.3 | 4.2 | 0.0311 |
| 16:0/20:4 PC | 683.3 | 50.8 | 889.6 | 79.7 | 0.0012 |
| 18:1 LPA | 0.29 | 0.10 | 0.44 | 0.09 | 0.0383 |
Cer: ceramide, PC: phosphatidylcholine, LPE: lysophosphatidylethanolamine, FA: fatty acid, LPA: lysophosphatidic acid, LPC: lysophosphatidylcholine
In the kidney, total FA and total PC were significantly increased in ethanol fed mice compared to controls Administration of alcohol also significantly increased all 22:6 FA-containing lipids by 30-160% (Table 3, P<0.05). Several 16:0 FA-containing lipids were also increased by 13-70% in ethanol-fed mice, but 16:0 LPI and 16:0 Cer were decreased (Table 3). In fact, most Cers profoundly decreased by 29-44%, and only two (24:1 and 24:0 Cer) increased (by 16-46%) in ethanol-fed mice compared to pair-fed controls (Table 3).
Table 3. FA-related lipids significantly altered by alcohol in the kidney (n = 10 in each group).
| Kidney | Ethanol-fed mice | Pair-fed control | |||
|---|---|---|---|---|---|
| pmol/mg | mean | SD | mean | SD | P |
| 22:6 FA | 903.8 | 384.7 | 346.8 | 75.0 | 0.0003 |
| 22:6 LPA | 1.02 | 0.31 | 0.71 | 0.12 | 0.0095 |
| 22:6 LPC | 84.1 | 39.8 | 39.9 | 13.5 | 0.0041 |
| 22:6 LPE | 4.3 | 0.7 | 3.2 | 0.6 | 0.0044 |
| 16:0/22:6 PC | 2334.1 | 364.7 | 1366.8 | 271.5 | 4.5×10E-06 |
| 16:0/22:6 PE | 47.2 | 9.3 | 27.5 | 6.9 | 0.0001 |
| 18:0/22:6 PE | 25.0 | 7.3 | 17.5 | 3.6 | 0.0103 |
| 16:0 LPC | 147.9 | 52.6 | 99.8 | 22.6 | 0.0171 |
| 16:0 LPE | 47.4 | 15.0 | 33.2 | 7.4 | 0.0159 |
| 16:0/18:1 PC | 1830.0 | 238.2 | 1605.8 | 135.3 | 0.0204 |
| 16:0/20:4 PE | 165.9 | 34.0 | 135.3 | 15.4 | 0.0198 |
| 20:4 FA | 578.4 | 104.0 | 468.2 | 87.4 | 0.0226 |
| 20:4 LPI | 27.6 | 7.2 | 20.8 | 5.8 | 0.0345 |
| 18:2 LPA | 0.25 | 0.12 | 0.15 | 0.02 | 0.0205 |
| 18:0 LPE | 147.7 | 35.0 | 119.3 | 20.8 | 0.0438 |
| 24:1 Cer | 70.8 | 6.2 | 61.0 | 11.4 | 0.0349 |
| 24:0 Cer | 95.9 | 11.5 | 65.6 | 15.3 | 0.0002 |
| 16:0 LPI | 9.4 | 1.9 | 12.6 | 1.3 | 0.0004 |
| 18:1 SM | 20.8 | 3.9 | 25.5 | 2.3 | 0.0049 |
| 16:0 Cer | 244.0 | 35.0 | 320.4 | 67.8 | 0.0075 |
| 18:1 Cer | 1.2 | 0.1 | 1.7 | 0.4 | 0.0012 |
| 18:0 Cer | 6.2 | 0.7 | 9.2 | 1.5 | 4.1×10E-05 |
| 20:0 Cer | 8.3 | 1.6 | 15.1 | 1.9 | 2.5×10E-07 |
| 22:0 Cer | 36.7 | 5.9 | 52.4 | 8.2 | 0.0002 |
FA: fatty acid, LPA: lysophosphatidic acid, LPC: lysophosphatidylcholine, LPE: lysophosphatidylethanolamine, PC: phosphatidylcholine, PE: phosphatidylethanolamine, LPI: lysophosphatidylinositol, SM: sphingomyelin, Cer: ceramide
Total lipids in skeletal muscle were not changed significantly. However, when we considered each lipid individually, many lipids containing 18:3, 18:2, 18:1, and/or 18:0 FA were significantly increased by 41-152%. We, however, observed significant decreased in the levels of 16:0/20:4 PC and 16:0/22:6 PC by 29-35% in muscles (Table 4).
Table 4. FA-related lipids significantly altered by alcohol in the skeletal muscle (n = 10 in each group).
| Skeletal muscles | Ethanol-fed mice | Pair-fed control | |||
|---|---|---|---|---|---|
| pmol/mg | mean | SD | mean | SD | P |
| 16:0/18:3 PC | 161.4 | 58.0 | 69.0 | 14.9 | 0.0001 |
| 18:0/18:3 PC | 188.6 | 31.3 | 124.0 | 23.0 | 0.0001 |
| 18:2 LPA | 0.13 | 0.04 | 0.06 | 0.03 | 0.0003 |
| 18:2 LPC | 111.4 | 44.5 | 44.3 | 14.4 | 0.0003 |
| 16:0/18:2 PC | 1710.7 | 437.0 | 830.0 | 178.7 | 1.9×10E-05 |
| 16:0/18:2 PE | 11.7 | 5.2 | 3.8 | 1.1 | 0.0002 |
| 18:0/18:2 PC | 166.0 | 55.2 | 73.2 | 23.5 | 0.0001 |
| 18:0/18:2 PE | 29.8 | 10.2 | 10.6 | 3.5 | 2.9×10E-05 |
| 18:1 LPC | 77.7 | 22.2 | 54.9 | 17.5 | 0.0235 |
| 18:1 LPE | 28.3 | 11.9 | 14.6 | 6.4 | 0.0058 |
| 18:0/18:1 PC | 72.2 | 22.3 | 46.5 | 16.9 | 0.0108 |
| 16:0/18:1 PE | 10.0 | 2.6 | 6.3 | 3.8 | 0.0262 |
| 18:0 LPC | 50.9 | 21.3 | 33.9 | 13.4 | 0.0500 |
| 24:0 Cer | 3.5 | 1.3 | 2.3 | 0.6 | 0.0170 |
| 16:0/20:4 PC | 1466.6 | 224.6 | 1811.5 | 273.4 | 0.0083 |
| 16:0/22:6 PC | 832.8 | 320.8 | 1284.5 | 420.0 | 0.0183 |
| 22:5 FA | 5.9 | 2.4 | 9.6 | 4.0 | 0.0292 |
PC: phosphatidylcholine, LPA: lysophosphatidic acid, LPC: lysophosphatidylcholine, PE: phosphatidylethanolamine, LPE: lysophosphatidylethanolamine, Cer: ceramide, FA: fatty acid
Among the nine groups of lipids analyzed in the cardiac muscle, the PE and SM were significantly increased and reduced, respectively, in the alcohol group. Among the 8 PEs analyzed, 6 were significantly increased in the alcohol group (by 17-132%), while 3 of 3 of SMs tested were decreased in this group. Other decreased lipids are shown in Table 5.
Of all the lipids being analyzed in adipose tissue, total PC (∼2,700 pmol/mg), SM (∼1,400 pmol/mg), LPC (∼240 pmol/mg) and Cer (∼140 pmol/mg) were the most abundant. There were no significant changes in adipose tissue lipids after alcohol administration (data not shown).
Cross tissue comparisons
While our data suggest that alcohol's effects on FA-related lipid are highly tissue specific, we also conducted cross tissue comparison and correlation studies. We found that the total PEs were significantly higher in the cardiac tissues compared to those from the skeletal muscle, kidney, and adipose tissues. In control mice, the levels of cardiac PEs were 4- and 12- fold higher than those in the kidney and skeletal muscle. We also found that ethanol increased PEs in the heart (3567 ± 1039 pmol/mg vs. 2596 ± 648 pmol/mg, P= 0.02). Consistent with PC being the main cell membrane component, we found that PC is the most abundant phospholipids in all tissues. The levels of other major lipids varied depending on the tissue being analyzed. For example, SM and PE are the second most abundant lipids in kidney and heart, respectively (data not shown).
Among the lipids we determined, there was a trend of increase of 22:6 FA in the serum and all tissues collected after administration of alcohol. In particular, significant increases in 22:6 FA in the serum and kidney were observed. A correlation coefficient of 0.82 (P<0.0001) suggests that the increases of this FA in the serum and kidney are well correlated (Figure 1).
Figure 1.

The correlation of 22:6 FA between the serum and the renal tissue.
In addition, we found a correlation of 16:0/20:4 PC between the hepatic tissues and serum (r = 0.89, P=0.006), a correlation of 22:5 FA between the hepatic and renal tissues (r = 0.84, P=0.002), and between the hepatic and cardiac tissues (r = 0.83, P=0.003) as well as a correlation of 16:0 LPI between the serum and hepatic tissues (r = 0.81, P=0.004). In cluster analyses based on p-values between the control and ethanol groups, we found that significant clustering in the levels of phospholipids in kidney, serum, and liver by using .90 as the cut-off for the approximated unbiased (AU) p-values. This indicates that lipids among these three organs tend to behave similarly in contrast with those in muscle, heart, or adipose.
Discussion
This study provides initial data for lipid alterations in the serum and different tissues. In contrast to heavily studied cholesterol and triglycerides (You et al., 2002), we focus on a group of extracellular and intracellular signaling lipid molecules. The most striking finding is that the lipid alterations induced by alcohol are highly tissue specific, suggesting that the pathological effects of alcohol in different tissues may have different molecular mechanisms and may be related to many factors including the accumulation/generation rate of alcohol and its metabolites in different tissues, the different enzymes involved, and the different basal lipid compositions in different tissues. The importance of omega-3 (such as 20:4, 22:5, 22:6) FAs have been extensively studied. (de Deckere, et al., 1998; Harris, 2007; Harris, 2010). Interestingly, we have found that 22:6 FA, an omega-3 FA and several 22:6-FA containing lipids were increased in the serum and kidney, but not in other tissues, including heart, where 22:6 FA has been shown to have protective effects. On the other hand, 22:5 FA, an omega-3 and omega-6 FA, was not changed in the serum and kidney, but decreased in the liver, skeletal muscle, and heart. The levels of different FA-containing lipids in different tissues are regulated by a complex array of many enzymes including phospholipase A1s and A2s, phospholipiase Ds, acyl-transferase, sphingomyelinases, and ceramidases. As a note, it is possible that the lipid changes observed in the heart, as well as in other tissues, may not directly be contributed from changes in cardiomyocytes or the cells in the particular organ, but rather from infiltrated adipocytes and/or other cells. Whether alcohol induces differential infiltrations in different organs is highly interesting, which warrants further investigation. The results of our study should be viewed as the starting points for future studies on the mechanisms of these alterations and their potential pathological functions.
Figure 2.
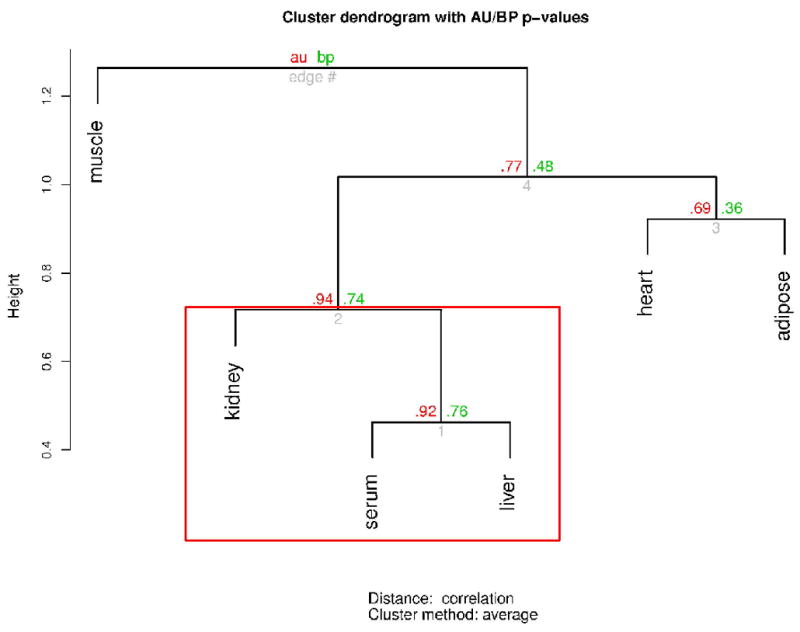
Cluster dendrogram based on the cluster analyses to determine the cross-organ differences of tissue phospholipids
Acknowledgments
This study is supported by in part by Veterans Administration Young Investigator Award/Indiana Institute for Medical Research (S.L.), K08 AA016570 (S.L.) from the NIH/NIAAA, Central Society for Clinical Research Career Development Award (S.L), Research Support Fund Grant from the Indiana University (S.L), and the Mary Fendrich Hulman Charitable Trust Fund (Y.X.)
References
- Billich A, Baumruker T. Sphingolipid metabolizing enzymes as novel therapeutic targets. Subcell Biochem. 2008;49:487–522. doi: 10.1007/978-1-4020-8831-5_19. [DOI] [PubMed] [Google Scholar]
- Chatterjee S, Kolmakova A, Miller M. The role of the phospholipid sphingomyelin in heart disease. Curr Opin Investig Drugs. 2006;7:219–228. [PubMed] [Google Scholar]
- Claus RA, Dorer MJ, Bunck AC, Deigner HP. Inhibition of sphingomyelin hydrolysis: targeting the lipid mediator ceramide as a key regulator of cellular fate. Curr Med Chem. 2009;16:1978–2000. doi: 10.2174/092986709788682182. [DOI] [PubMed] [Google Scholar]
- Crabb DW, Liangpunsakul S. Alcohol and lipid metabolism. 2006;21:S56–60. doi: 10.1111/j.1440-1746.2006.04582.x. [DOI] [PubMed] [Google Scholar]
- de Deckere EAM, Korver O, Verschuren PM, Katan MB. Health aspects of fish and n-3 polyunsaturated fatty acids from plant and marine origin. Eur J Clin Nutr. 1998;52:749–753. doi: 10.1038/sj.ejcn.1600641. [DOI] [PubMed] [Google Scholar]
- Harris W. Omega-3 fatty acids and cardiovascular disease: a case for omega-3 index as a new risk factor. Pharmacological Research. 2007;55:217–223. doi: 10.1016/j.phrs.2007.01.013. [DOI] [PMC free article] [PubMed] [Google Scholar]
- Harris W. Omega-6 and omega-3 fatty acids: partners in prevention. Curr Opin Clin Nutr Metab Care. 2010;13:125–129. doi: 10.1097/MCO.0b013e3283357242. [DOI] [PubMed] [Google Scholar]
- liangpunsakul s, qi r, crabb dw, witzmann f. Relationship between alcohol drinking and aspartate aminotransferase:alanine aminotransferase (AST:ALT) ratio, mean corpuscular volume (MCV), gamma-glutamyl transpeptidase (GGT), and apolipoprotein A1 and B in the U.S. population. J Stud Alcohol Drugs. 2010;71:249–252. doi: 10.15288/jsad.2010.71.249. [DOI] [PMC free article] [PubMed] [Google Scholar]
- Merrill AH. Characterization of serine palmitoyltransferase activity in Chinese hamster ovary cells. Biochim Biophys Acta. 1983;754:284–291. doi: 10.1016/0005-2760(83)90144-3. [DOI] [PubMed] [Google Scholar]
- Merrill AH, Williams RD. Utilization of different fatty acyl-CoA thioesters by serine palmitoyltransferase from rat brain. J Lipid Res. 1984;25:185–188. [PubMed] [Google Scholar]
- Moolenaar WH. Bioactive lysophospholipids and their G protein-coupled receptors. Exp Cell Res. 1999;253:230–238. doi: 10.1006/excr.1999.4702. [DOI] [PubMed] [Google Scholar]
- Room R, Babor T, Rehm J. Alcohol and public health. Lancet. 2005;365:519–530. doi: 10.1016/S0140-6736(05)17870-2. [DOI] [PubMed] [Google Scholar]
- Salaspuro MP, Lieber CS. Metabolic consequences of chronic alcohol consumption: attenuation of hepatic redox changes despite enhanced capacity to eliminate ethanol. Curr Alcohol. 1979;5:109–118. [PubMed] [Google Scholar]
- Sutphen R, Xu Y, Wilbanks GD, Fiorica J, Grendys EC, Lapolla JP, Arango H, Hoffman MS, Martino M, Wakeley K, Griffin D, Blanco RW, Cantor AB, Xiao YJ, Krischer JP. Lysophospholipids are potential biomarkers of ovarian cancer. Cancer Epidemiol Biomarkers Prev. 2004;13:1185–1191. [PubMed] [Google Scholar]
- Xiao Y, Chen Y, Kennedy AW, Belinson J, Xu Y. Evaluation of plasma lysophospholipids for diagnostic significance using electrospray ionization mass spectrometry (ESI-MS) analyses. Ann N Y Acad Sci. 2000;905:242–259. doi: 10.1111/j.1749-6632.2000.tb06554.x. [DOI] [PubMed] [Google Scholar]
- Xiao YJ, Schwartz B, Washington M, Kennedy A, Webster K, Belinson J, Xu Y. Electrospray ionization mass spectrometry analysis of lysophospholipids in human ascitic fluids: comparison of the lysophospholipid contents in malignant vs nonmalignant ascitic fluids. Anal Biochem. 2001;290:302–313. doi: 10.1006/abio.2001.5000. [DOI] [PubMed] [Google Scholar]
- Xu Y, Shen Z, Wiper DW, Wu M, Morton RE, Elson P, Kennedy AW, Belinson J, Markman M, Casey G. Lysophosphatidic acid as a potential biomarker for ovarian and other gynecologic cancers. JAMA. 1998;280:719–723. doi: 10.1001/jama.280.8.719. [DOI] [PubMed] [Google Scholar]
- You M, Fischer M, Deeg MA, Crabb DW. Ethanol induces fatty acid synthesis pathways by activation of sterol regulatory element-binding protein (SREBP) J Biol Chem. 2002;277:29342–29347. doi: 10.1074/jbc.M202411200. [DOI] [PubMed] [Google Scholar]
- You M, Matsumoto M, Pacold CM, Cho WK, Crabb DW. The role of AMP-activated protein kinase in the action of ethanol in the liver. Gastroenterology. 2004;127:1798–1808. doi: 10.1053/j.gastro.2004.09.049. [DOI] [PubMed] [Google Scholar]
- Zhao Z, Xu Y. An extremely simple method for extraction of lysophospholipids and phospholipids from blood samples. J Lipid Res. 2010;51:652–659. doi: 10.1194/jlr.D001503. [DOI] [PMC free article] [PubMed] [Google Scholar]
- Zhao Z, Xiao Y, Elson P, Tan H, Plummer SJ, Berk M, Aung PP, Lavery IC, Achkar JP, Li, Casey G, Xu Y. Plasma lysophosphatidylcholine levels: potential biomarkers for colorectal cancer. J Clin Oncol. 2007;25:2696–2701. doi: 10.1200/JCO.2006.08.5571. [DOI] [PubMed] [Google Scholar]