Abstract
OBJECTIVE
To investigate whether image analysis of routine hematoxylin-eosin (H-E) skin sections usingfast Fourier transformation (FFT) could detect structural alterations in patients with Sjögren-Larsson syndrome (SLS) diagnosed by molecular biology.
STUDY DESIGN
Skin punch biopsies of 9 patients with SLS and 17 healthy volunteers were obtained. Digital images of routine histologic sections were taken, and their gray scale luminance was analyzed by FFT. The inertia values were determined for different ranges of the spatial frequencies in the vertical and horizontal direction. To get an estimation of anisotropy, we calculated the resultant vector of the designated frequency ranges.
RESULTS
In the prickle cell layer, SLS patients showed more intense amplitudes in spatial structures with periods between 1.2 and 3.6 µm in the vertical direction, which correlated in part with accentuated nuclei and nucleoli and perinucleolar halos in the H-E sections. In a linear discriminant analysis, the variables derived from the FFT images correctly discriminated 84.6% of the patients. Texture features derived from the gray level co-occurrence matrix were not able to separate the groups.
CONCLUSION
Exploratory texture analysis by FFT was able to detect discrete alterations in the prickle cell layer in routine light microscopy slides of SLS patients. The structural changes identified by FFT may be related to abnormal cellular components associated with aberrant lipid metabolism.
Keywords: epidermis, ichthyosis, karyometry, morphometry, nucleus, nucleolus, pathology, quantitative
Sjögren-Larsson syndrome (SLS; OMIM#270200) is a rare autosomal recessively inherited form of ichthyosis associated with mental retardation, spastic diplegia, speech defects and ophthalmologic abnormalities.1 The ichthyosis usually has a congenital onset and precedes the appearance of the neurologic symptoms. Patients typically exhibit generalized hyperkeratosis, which is accentuated on the flexures, neck and the lower abdomen. SLS is an inborn error of lipid metabolism caused by mutations in the ALDH3A2 gene that codes for the microsomal enzyme fatty aldehyde dehydrogenase (FALDH).2,3 This enzyme catalyzes the oxidation of medium- and long-chain aliphatic aldehydes to fatty acids.4 Patients with SLS have FALDH deficiency in a variety of tissues, including cultured skin fibroblasts, cultured keratinocytes, leukocytes, intestinal mucosa and skin biopsies.2,4–7 The pathogenesis of the ichthyosis in SLS is not yet understood, but it is thought to be due to the accumulation of fatty aldehydes and their precursor lipids, including fatty alcohol.1 Histologic examination of the epidermis in SLS shows hyperkeratosis, papillomatosis and acanthosis. The stratum corneum may have a basket-weave appearance, and the granular layer may be slightly thickened.8–10 On light microscopy examination, clearly visible epidermal abnormalities are seen in the stratum corneum and to a much lesser extent in the stratum granulosum. Cytologic abnormalities in the prickle cell layer have been seen only by electron microscopy, but not by light microscopy.
Modern methods for texture analysis of tissues can reveal discrete alterations not visible to the human eye.11–21 One of these texture analysis techniques uses the fast Fourier transformation (FFT). The French scientist J. B. Fourier mathematically described the harmonic nature of waves and demonstrated that any “irregular” continuous function could be interpreted as a sum of sine and cosine waves.22 Fourier transformation has been widely used for the analysis and treatment of communication signals, but can also be applied to the description of images, because regularly organized relationships between picture elements may be interpreted as cyclic, harmonic events. This method can calculate orientation, periodicity and spacing based on architecture of collagen bundles and has been successfully applied in dermatopathology as an objective and reproducible method.11,13–16,19,21
The aim of this study was to analyze whether FFT could be used in an exploratory way to detect alterations in the prickle cell layer of routine light microscopic tissue sections.
Materials and Methods
Patients
For this prospective study, 5-mm skin punch biopsies were collected from 9 patients diagnosed with SLS (6 biopsies from the abdomen and 3 from the forearm). As a control group, biopsies were obtained from the same topographic sites from 17 volunteers of similar age during routine surgery for skin tumors. Skin biopsies were also obtained for establishing fibroblast cultures using standard methods. The study was approved by the institution’s ethics committee, and all subjects or their legal representatives gave their written informed consent.
SLS was confirmed by molecular biologic analysis. Total genomic DNA was extracted from 10 mL of peripheral blood using standard phenol-chloroform methods. ALDH3A2 exons and their flanking DNA sequences were amplified by PCR using primers as described.3 The DNA sequences were determined by automated sequencing and compared to that of the reference DNA sequence of the ALDH3A2 gene (GenBank accession number NM_000382). The mutation was described using cDNA nomenclature. FALDH enzyme activity was measured in cultured skin fibroblasts.4
Fragments of the skin biopsy samples were routinely formaldehyde-fixed and paraffin-embedded, and 5-µm sections were stained with hematoxylineosin (H-E).
Image Acquisition
From each subject, 10 horizontally orientated bitmap images (size 48 × 48 µm, equivalent to 480 ×480 pixels) were randomly taken of the stratum spinosum using the Kontron Zeiss KS300 system (Zeiss Kontron, Munich, Germany) (0.1 µm/pixel spatial resolution; 1.25 numerical aperture; 100×oil immersion objective). Only the prickle cell layer of suprapapillary epidermis was captured with the best focus, that is, when the nuclear outlines of the keratinocytes are clearly distinguishable. The analysis was done by one examiner (MPA) blinded to the diagnosis. The images were converted to grayscale format with levels of luminance ranging between 0 (absence of light) and 255 (very bright), using a human-perceptually homogeneous scale of luminance.20 To compensate for variations of the staining procedure, the histograms of all images were submitted to a normalization process, reaching a mean luminance of 127 and SD of 30 gray values.
Fast Fourier Transformation
We created a pseudo-three-dimensional “land-scape-like” representation using the gray level (luminance) of each pixel (picture element) as the height of a z-axis (Figure 1A and B), which is now interpreted as the result of many different overlapping harmonic functions. Applying the FFT algorithm, we transformed each “hidden” wave of the original picture into a pair of picture elements in the transformed (FFT) image, point-symmetric to the center of the FFT image. The direction of the harmonic function represented by the two picture elements is the line between the points, their distance to the center of the transformed image is the spatial frequency and their luminance is proportional to the amplitude of the harmonic wave, that is, the difference between maximal and minimal gray values of the harmonic function. Thus, each point-symmetric pair of pixels in the transformed image represents a harmonic function in the original image. The set of all pixel pairs of the FFT image represents the sum of the corresponding harmonic functions in the original picture. A mean filter smoothing was applied to avoid artifacts (aliasing effects) in the FFT image caused by the edge borders of the original image.23,24 This allowed deriving from the FFT image precise information about these harmonic components (Figure 1C).
Figure 1.
Original image of normal prickle cell layer (A), in the pseudo-3-dimensional representation (B) and as spectral representation after FFT (C), which shows a huge number of pairs of points, representing all of the harmonic waves composing the original image (A).
In order to obtain useful information we calculated the inertia values, which are equivalent to the amplitudes of the harmonic waves building up the microscopic image. Higher amplitudes are equivalent to a more contrasted, repetitive pattern in the microscopic image of the epidermis.
Because the epidermal architecture contains predominantly horizontally and vertically arranged cells, we analyzed the amplitude values in horizontal and vertical sectors in 30-degree angles. Each sector was subdivided into 6 frequency ranges, from zero to 5 µm−1 (or spatial periods between infinity and 0.2 µm, respectively), which were compared between control patients and patients with SLS by the nonpaired Student's t test (α = 0.05). Correlations were evaluated by the Pearson test.
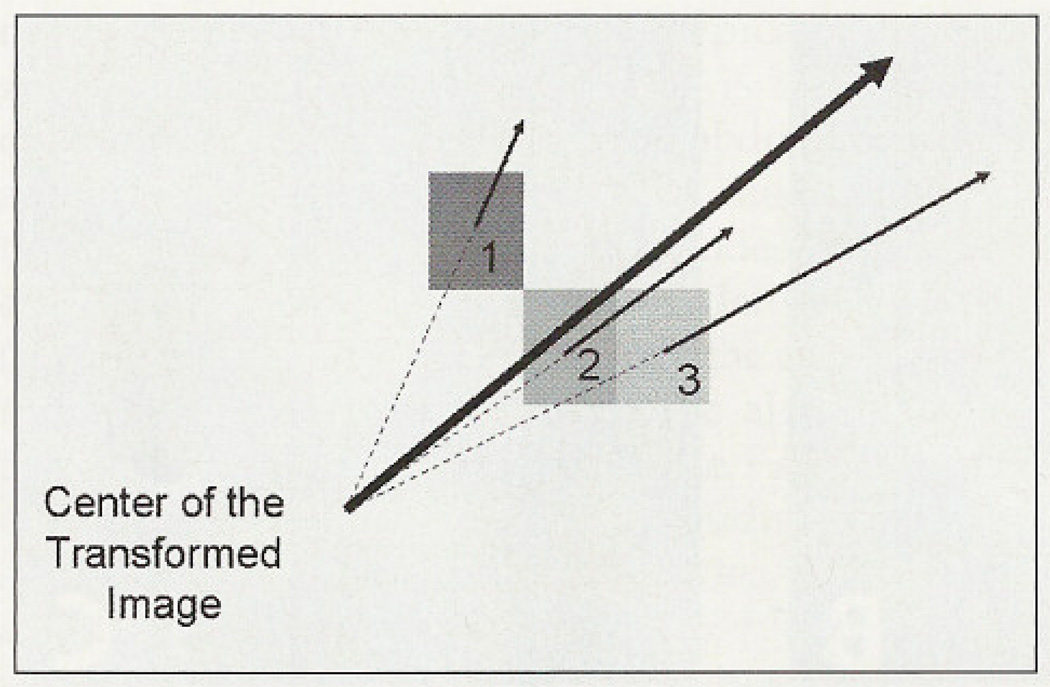
To get an estimation of anisotropy, that is, an estimate of the variation of the amplitude of waves along axes in different directions, we calculated the resultant vector of the designated frequency ranges (Figure 2).
Figure 2.
Resultant vector calculated in a certain frequency range (1, 2 and 3 represent gray values of three pixels of the FFT image). The bold arrow is the resultant vector of these vectors.
The length of resultant vector is given by:
where i indicates the i-th vector, which represents a pixel in the right half of FFT image; the angle αi is the direction of each vector defined by the line between the center of the FFT image and the pixel (ui,υi)(Figure 2), equivalent to arctan (υi/ui); gi is the gray value of the pixel in the FFT, defined by:
which indicates the amplitude (in gray values) of the harmonic function at (ui,υi)in the FFT image; R(ui,υi) and I(ui,υ i) represent, respectively, the real and imaginary parts of the complex value at pixel (ui,υi)in the Fourier-transformed representation; d is the distance between the pixel (ui,υi) and the center of the FFT image.
The size of the resultant vector of a certain frequency range (ring) in the FFT image is a measure of the anisotropy. This value is low if harmonic waves of equal amplitude would be represented in each direction of the original image, and high when there is predominance of a certain direction, for example several vectors in parallel. Furthermore, we tested the discriminative power of the different texture variables by a linear discriminant analysis, where we determined the importance of each variable to “predict” the correct diagnosis. To obtain a more realistic classification matrix, the leave-one-out method (also referred to as the “jack-knife” procedure) was applied, whereby each subject is classified according to the remaining (n-1) cases. This procedure was regarded as the method of choice considering our relatively small sample sizes. When necessary, the logarithmic functions were performed on the variables to obtain normal distributions for the discriminant analysis.25–27 SPSS 8.0 (SPSS, Inc., Chicago, Illinois, U.S.A.) and WINSTAT 3.1 (Kalmia Co., Inc., Cambridge, Massachussetts, U.S.A.) software programs were used. Finally, in order to investigate whether the elements of the image could influence the FFT-derived variables, the number of nuclei per image was counted. Furthermore the texture features of the gray values were analyzed. For this purpose the following variables derived from the gray value co-occurrence matrix were calculated according to Haralick et al28: angular second moment, inertia, local homogeneity, entropy, contrast, inverse difference moment, diagonal moment, second diagonal moment, mean, standard deviation, coefficient of variation, sum average, cluster shade, cluster prominence and product moment.
Results
The 9 patients with SLS (4 male and 5 female) were from 3 families. Their mean age was 14 years (range, 4–30). The control group comprised 17 healthy subjects (7 males and 10 females), with a mean age of 16 years (range, 9–40) (Table I).
Table I.
Patient Data
| Age | Sex | Biopsy site | Resultant vector (region 6) | Predicted diagnosis | |
|---|---|---|---|---|---|
| Patients with SLS | |||||
| 1 | 6 | F | T | 62.0 | SLS |
| 2 | 8 | F | T | 35.0 | Normal |
| 3 | 14 | F | T | 199.7 | SLS |
| 4 | 25 | F | T | 50.8 | SLS |
| 5 | 27 | M | F | 45.2 | SLS |
| 6 | 29 | F | F | 59.3 | SLS |
| 7 | 10 | F | T | 46.8 | SLS |
| 8 | 4 | M | T | 48.2 | SLS |
| 9 | 4 | M | F | 30.3 | Normal |
| Controls | |||||
| 10 | 10 | F | T | 30.8 | Normal |
| 11 | 21 | F | F | 18.4 | Normal |
| 12 | 10 | F | T | 45.0 | SLS |
| 13 | 25 | F | T | 30.7 | Normal |
| 14 | 12 | F | T | 36.3 | Normal |
| 15 | 13 | F | T | 21.6 | Normal |
| 16 | 17 | M | T | 25.6 | Normal |
| 17 | 40 | F | T | 33.9 | Normal |
| 18 | 36 | M | F | 38.4 | Normal |
| 19 | 17 | M | T | 34.1 | Normal |
| 20 | 11 | M | T | 26.2 | Normal |
| 21 | 12 | F | T | 31.5 | Normal |
| 22 | 9 | F | T | 26.8 | Normal |
| 23 | 10 | F | T | 38.60 | Normal |
| 24 | 25 | M | T | 34.2 | Normal |
| 25 | 9 | M | F | 54.3 | SLS |
| 26 | 11 | M | F | 29.7 | Normal |
SLS group: patients 1–9; control group: patients 10–26; age in years; anatomical site of biopsy: T, trunk; F, forearm. The length of the resultant vector of region 6 (0.6–0.72 µm) in arbitrary units. The last column with the result of the discriminant analysis after jackknife procedure based on the resultant vector f region 6.
Diagnosis of SLS was confirmed by enzymatic and genetic means. All patients with SLS had < 10% of normal FALDH enzyme activity in cultured skin fibroblasts. Sequencing of the ALDH3A2 gene revealed a homozygous c.1108-1G>C mutation in intron 7 of all of the affected individuals.
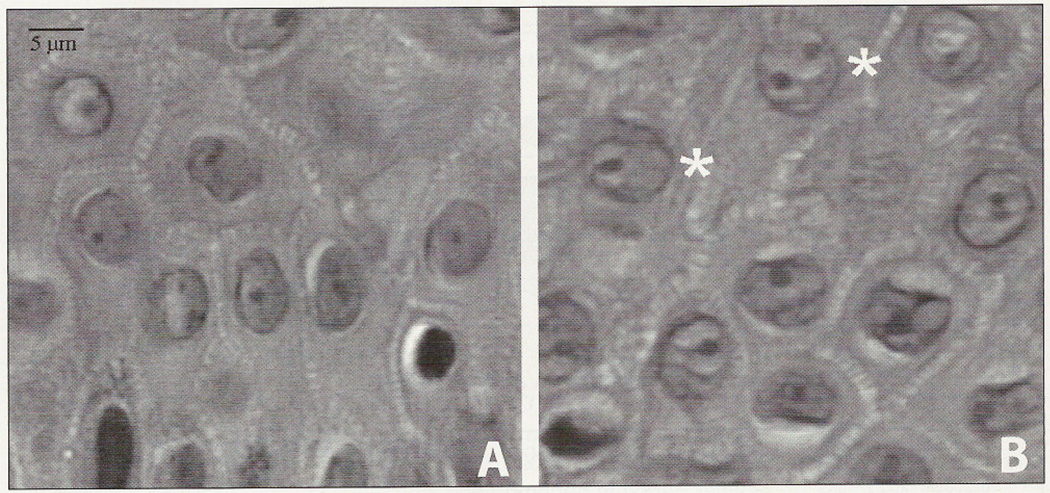
All patients with SLS showed generalized ichthyosis with marked yellow-brown lichenified hyperkeratosis around the neck and the joints. Histologic examination of the skin showed hyperkeratosis, papillomatosis and acanthosis of the epidermis. The prickle cell layer varied from 1.5–4 cell layers. Only 3 patients exhibited a basket-wave pattern in the stratum corneum; Nuclei and nucleoli appeared smaller in the spinous layer of normal skin compared to SLS skin, which exhibited frequent perinucleolar halos (Figure 3). The nuclear membranes in the SLS cells appeared thickened. Striking differences in the architecture of the lower epidermal layers were not evident, but some smoothing of the rete ridges was found in SLS skin.
Figure 3.
Light microscopic examination of the prickle cell layer of a control person (A) and a patient with SLS (B). Note the clear halos around the nucleoli (*), contrasting sharply with the dark nucleoli in (B).
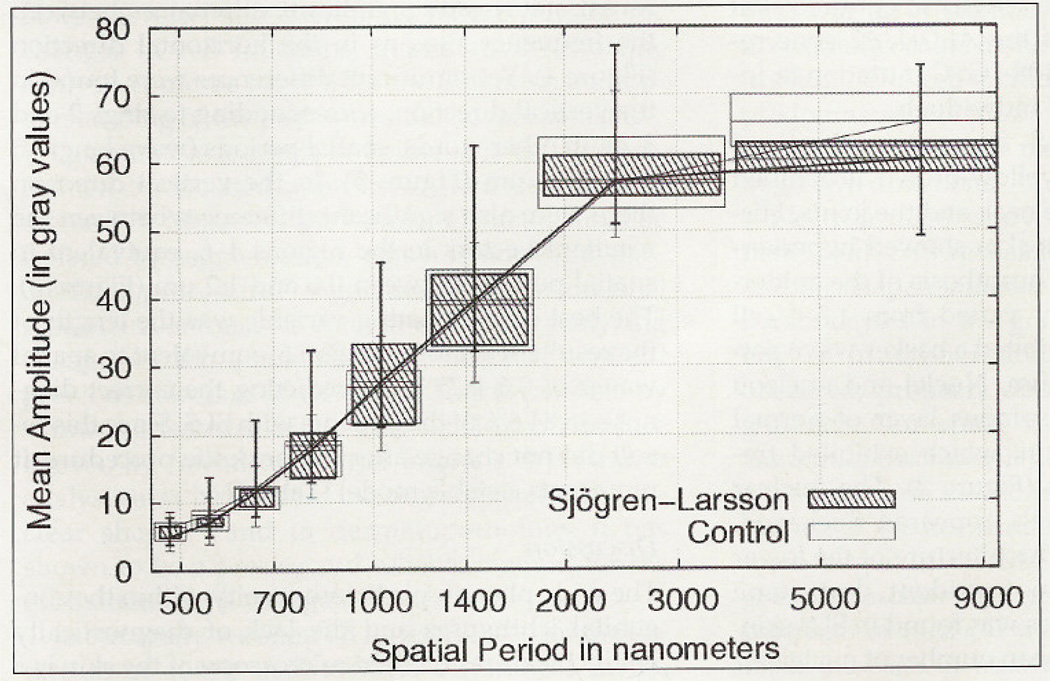
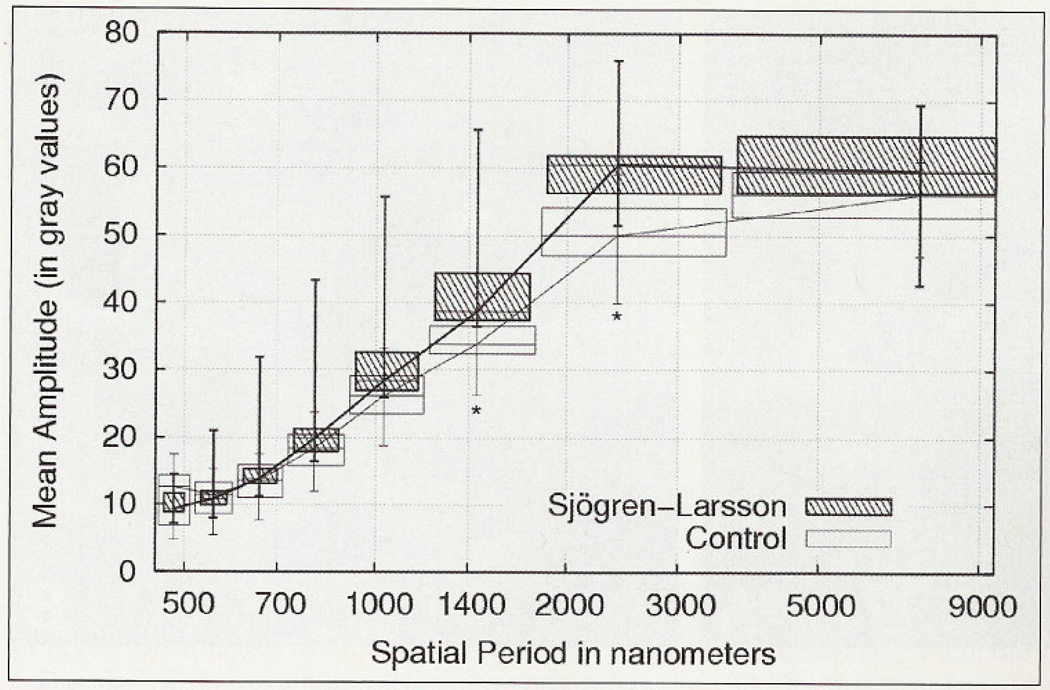
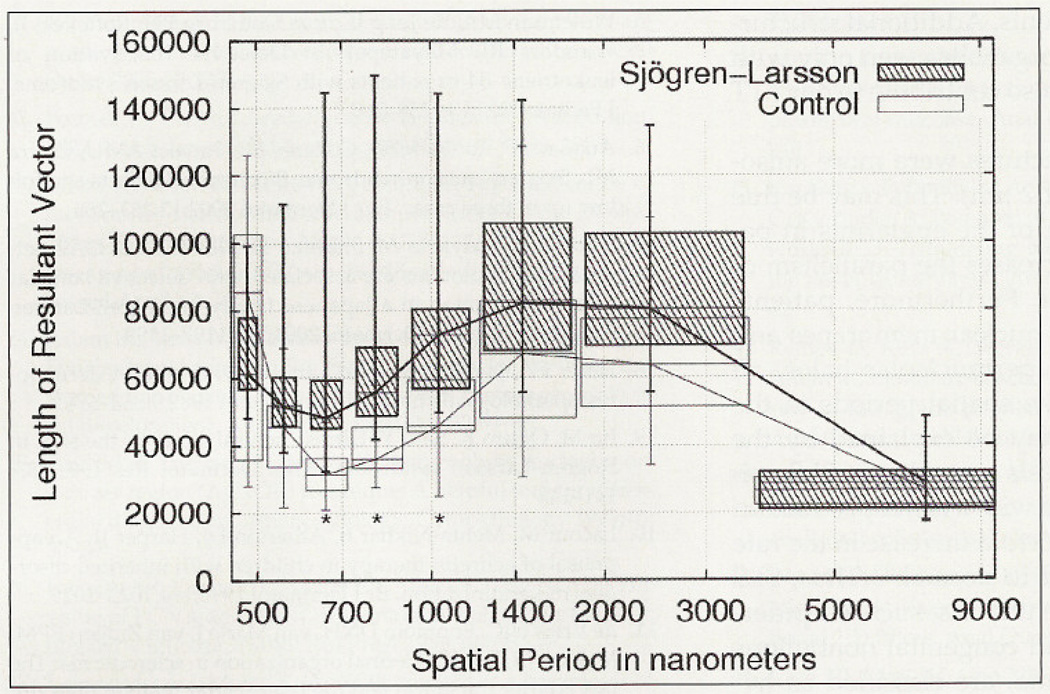
In control patients the mean number of nuclei per image was 18.7 (range, 14.5–23) and in patients with SLS it was 21.1 (range, 16.2–30.6), but the difference was not statistically significant. There was no correlation between the number of nuclei per picture and the age of the patients. Analyses based on the gray-level co-occurrence matrix did not discriminate between groups, because none of the Haralick texture features revealed significant differences. When examining the Fourier-derived variables the direction showed to be important. Texture analysis did not reveal statistically significant differences between the frequency regions in the horizontal direction (Figure 4). Yet significant differences were found in the vertical direction, corresponding to rings 2 and 3, or, in other words, spatial periods (wave lengths) of 1.2–3.6 µm (Figure 5). In the vertical direction there were also significant differences between the resultant vectors in the regions 4–6, equivalent to spatial periods between 0.6 and 1.2 µm (Figure 6). The best discriminating variable was the length of the resultant vector of region 6, equivalent to spatial waves of 0.6–0.72 µm, predicting the correct diagnosis in 84.6% of the patients with SLS. Since this result did not change after the jackknife procedure, it represents a stable model (Table I).
Figure 4.
Harmonic waves in the horizontal direction. No significant differences between controls and patients with SLS.
Figure 5.
Harmonic waves in the vertical direction. Higher amplitudes in patients with SLS in frequency ranges of 1.3–3.6 µm.*Significant differences, p < 0.05.
Figure 6.
Resultant vectors of SLS vectors are larger at spatial periods between 0.6 and 1.2 µm. *Significant differences, p < 0.05.
Discussion
The wide phenotypic heterogeneity within the congenital ichthyoses and the lack of diagnostically distinct features on light microscopy of the skin is a difficult problem for the surgical pathologist. In SLS, the epidermis shows acanthosis, papillomatosis and hyperkeratosis, sometimes with a basket-weave appearance to the stratum corneum and slight thickening of the granular layer.8–10 Therefore, the histologic features of SLS are not pathognomonic and other diagnostic approaches such as biochemical or molecular genetic studies are usually necessary. In this context, quantitative assessment of routine histologic slides may be useful. Since morphologic alterations reflect physiologic changes in cell functions, quantitative histologic analysis could be helpful for the diagnosis and understanding of the pathophysiologic mechanisms.
Quantitative analysis of epithelia is usually performed by isolated analysis of their cellular elements.29–36 Moreover the cellular elements must be isolated by segmentation, which is not yet a standardized procedure37–42 and thus modifies the final results. In contrast, we were interested in analyzing changes of the whole tissue architecture without previous selection of elements. This is possible by extracting features of the gray-level co-occurrence matrix, by fractal or Fourier analysis.13,43 Fourier analysis may be used for the characterization of nuclear shape,44 and in dermatopathology it has shown to be a precise and reliable method for the evaluation of the collagen texture.11,14
In our study we showed its usefulness for the detection of subtle architectural differences in the prickle cell layer of patients with SLS compared with normal skin. None of the Haralick texture features was able to separate the two entities, but with only one Fourier-derived variable we could discriminate in 84.6% between patients and controls. A major question to address is the morphologic equivalent of the differences detected by the FFT. The normal epidermis has an anisotropic, highly organized structure of horizontal layers parallel to the basal membrane, thus permitting an analysis by FFT. During epidermal differentiation, cell migration mainly occurs in the vertical direction in the epithelium. The cell architecture is highly organized, predominantly in the vertical and horizontal layers, which was the main reason for our FFT study in these two directions.
Electron microscopy studies of the skin in patients with SLS revealed the presence of enlarged and misshapen lamellar bodies in the cytoplasm of keratinocytes in the granular and prickle cell layers.7,9,45 In addition, abnormal lipid inclusions were observed, probably derived from intracellular organelles. Our study revealed more accentuated rhythmic structures in patients with SLS of a spatial wavelength of 1.2–3.6 µm in the vertical direction but not in the horizontal direction. The amplitudes were larger in the SLS group, corresponding to greater nuclear and nucleolar volumes, higher numbers of nucleoli with perinucleolar halos and focal increase in nuclear membrane thickness of keratinocytes in these patients. Additional structural changes in subcellular organelles seen only with electron microscopy may also contribute to our FTT results.
Concomitantly, the structures were more anisotropic (spatial range, 0.6–1.2 µm). This may be due to the observed flattening of the epidermis in patients with SLS, which increases the parallelism of the cells and their nuclei. Furthermore, patients with SLS show thickened nuclear membranes and prominent nucleoli, with perinucleolar halos, all structures that enhance the spatial periods in the 1.2–3.6 µm range. This may be explained by the higher rate of DNA synthesis occurring in SLS epidermis, which is associated with a faster production of the horny layer and a 3.5-fold increase in the rate of cell turnover compared to norma1.45 Thus, SLS and some other forms of ichthyosis, such as epidermolytic hyperkeratosis and congenital nonbullous ichthyosiform erythroderma, are classified as hyperproliferative forms of ichthyosis. The finding that the differences were detected only in the vertical, but not in the horizontal direction, may be explained by the fact that many nuclei reveal a flattened ellipsoid form and the nuclear alignment was more pronounced in the horizontal than in the vertical direction. In other words, keratinocyte nuclei are positioned more parallel to the basement membrane and do not grow as distinct columns in the epidermis.
In summary, texture analysis by FFT of the whole epidermis is an objective explorative method that detects discrete alterations in the prickle cell layer in routine light microscopy slides of patients with SLS.
Footnotes
Financial Disclosure: The authors have no connection to any companies or products mentioned in this article.
References
- 1.Rizzo WB. Sjögren-Larsson syndrome: Fatty aldehyde dehydrogenase deficiency. In: Scriver CR, Beaudet AL, Sly WS, Valle MD, editors. The Molecular & Metabolic Bases of Inherited Disease. Eighth edition. New York: McGraw-Hill; 2001. p. 2239. [Google Scholar]
- 2.Rizzo WB, Dammann AL, Craft DA. Sjögren-Larsson syndrome: Impaired fatty alcohol oxidation in cultured fibroblasts due to deficient fatty alcohol:nicotinamide adenine dinucleotide oxidoreductase activity. J Clin Invest. 1988;81:738–744. doi: 10.1172/JCI113379. [DOI] [PMC free article] [PubMed] [Google Scholar]
- 3.Rizzo WB, Carney G, Lin Z. The molecular basis of Sjögren-Larsson syndrome: Mutation analysis of the fatty aldehyde dehydrogenase gene. Am J Hum Genet. 1999;65:1547–1560. doi: 10.1086/302681. [DOI] [PMC free article] [PubMed] [Google Scholar]
- 4.Rizzo WB, Craft DA. Sjögren-Larsson syndrome: Deficient activity of the fatty aldehyde dehydrogenase component of fatty alcohol:NAD+ oxidoreductase in cultured fibroblasts. J Clin Invest. 1991;88:1643–1648. doi: 10.1172/JCI115478. [DOI] [PMC free article] [PubMed] [Google Scholar]
- 5.Willemsen MA, de Jong JG, van Domburg PH, Rotteveel JJ, Wanders RJ, Mayatepek E. Defective inactivation of leukotriene B4 in patients with Sjögren-Larsson syndrome. J Pediatr. 2000;136:258–260. doi: 10.1016/s0022-3476(00)70113-2. [DOI] [PubMed] [Google Scholar]
- 6.Auada MP, Taube MBP, Collares EF, Tanaka AMU, Cintra ML. Sjögren-Larsson syndrome: Biochemical defects and follow up in three cases. Eur J Dermatol. 2002;12:263–266. [PubMed] [Google Scholar]
- 7.Shibaki A, Akiyama M, Shimizu H. Novel ALDH3A2 heterozygous mutations are associated with defective lamellar granule formation in a Japanese family of Sjögren-Larsson syndrome. J Invest Dermatol. 2004;123:1197–1199. doi: 10.1111/j.0022-202X.2004.23505.x. [DOI] [PubMed] [Google Scholar]
- 8.Hofer PA, Jagell S. Sjögren-Larsson syndrome: A dermatohistopathological study. J Cutan Pathol. 1982;9:360–376. doi: 10.1111/j.1600-0560.1982.tb01075.x. [DOI] [PubMed] [Google Scholar]
- 9.Ito M, Oguro K, Sato Y. Ultrastructural study of the skin in Sjögren-Larsson syndrome. Arch Dermatol Res. 1991;283:141–148. doi: 10.1007/BF00372053. [DOI] [PubMed] [Google Scholar]
- 10.Lacour M, Mehta-Nikhar B, Atherton DJ, Harper JI. An appraisal of acitretin therapy in children with inherited disorders of keratinization. Br J Dermatol. 1996;134:1023–1029. [PubMed] [Google Scholar]
- 11.de Vries HJC, Enomoto DNH, van Marle J, van Zuijlen PPM, Mekkes JR, Bos JD. Dermal organization in scleroderma: The fast Fourier transform and the laser scatter method objectify fibrosis in nonlesional as well as lesional skin. Lab Invest. 2000;80:1281–1289. doi: 10.1038/labinvest.3780136. [DOI] [PubMed] [Google Scholar]
- 12.Metze K, Souza Filho W, Adam RL, Lorand-Metze I. Analysis of the component “tree” as a new tool for analytical cellular pathology. Anal Cell Pathol. 2001;22:64. [Google Scholar]
- 13.Metze K, Silva PVVT, Adam RL, Cintra ML, Leite NJ. Differentiation of keloid and hypertrophic scar by texture analysis. Anal Cell Pathol. 2002;24:196. [Google Scholar]
- 14.van Zuijlen PPM, de Vries HJ, Lamme EN, Coppens JE, van Marie I, Kreis RW, Middelkoop E. Morphometry of dermal collagen orientation by Fourier analysis is superior to multi-observer assessment. J Pathol. 2002;198:284–291. doi: 10.1002/path.1219. [DOI] [PubMed] [Google Scholar]
- 15.Metze K, Adam RL, Silva PVVT, Gomes Neto A, Gomes AA, de Ssouza EM, Cintra ML, Leite NJ. Application of the new fast Fourier transform derived variables in dermatopathology. Pathol Res Pract. 2003;199:242. [Google Scholar]
- 16.van Zuijlen PPM, Ruurdaa JJB, van Veend HA, van Marie J, van Trier AJ, Groenevelt F, Kreis RW, Middelkoop E. Collagen morphology in human skin and scar tissue: no adaptations in response to mechanical loading at joints. Burns. 2003;29:423–431. doi: 10.1016/s0305-4179(03)00052-4. [DOI] [PubMed] [Google Scholar]
- 17.Adam RL, Leite NJ, De Carvalho RB, Silva PV, Metze K. Granulometric residues as a diagnostic tool in cytology. Cytometry. 2004;59A:63. [Google Scholar]
- 18.Metze K, Adam RL, Silva PV, De Carvalho RB, Leite NJ. Analysis of chromatin texture by Pinkus’ approximate entropy. Cytometry. 2004;59A:63. [Google Scholar]
- 19.Metze K, Piaza ACS, Piaza AA, Adam RL, Leite NJ. Texture analysis of AgNOR stained nuclei in lung cancer. Cell Oncol. 2005;27:137–138. [Google Scholar]
- 20.Van De Wouwer G, Weyn B, Scheunders P, Jacob W, Van Marck E, Van Dyck D. Wavelets as chromatin texture descriptors for the automated identification of neoplastic nuclei. J Microscopy. 2000;197:25–35. doi: 10.1046/j.1365-2818.2000.00594.x. [DOI] [PubMed] [Google Scholar]
- 21.Metze K, Bedin V, Adam RL, Cintra ML, de Souza EM, Leite NJ. Parameters derived from the fast Fourier transform are predictive for the recurrence of basal cell carcinoma. Cell Oncol. 2005;27:137. [Google Scholar]
- 22.Fourier J. Théorie Analytique de la Chaleur. First edition. Paris: Rééedition aux Éditions Jacques Gabay; 1822. 1988. [Google Scholar]
- 23.Metze K, Adam RL, Leite NJ. Cell music. The sonification of fast-Fourier-transformed microscopic images. [accessed April 17, 2006];Proc IX Brazilian Symp Computer Music. 2003 9:114–119. http://gsd.ime.usp.br/sbcm/20O3/papers/dKonradin_Metze.pdf. [Google Scholar]
- 24.Adam RL, Leite NJ, Metze K. Spectral analysis using discrete Fourier transformation for the study of nuclei: Software design and application on cardiomyocytes during physiological development. Anal Cell Pathol. 2001;22:64–65. [Google Scholar]
- 25.Cia EMM, Trevisan M, Metze K. Argyrophilic nucleolar organizer region (AgNOR) technique: A helpful tool for differential diagnosis in urinary cytology. Cytopathology. 1999;10:30–39. doi: 10.1046/j.1365-2303.1999.00145.x. [DOI] [PubMed] [Google Scholar]
- 26.Irazusta SP, Vassallo J, Magna LA, Metze K, Trevisan M. The value of PCNA and AgNOR staining in endoscopic biopsies of gastric mucosa. Pathol Res Pract. 1998;194:33–39. doi: 10.1016/s0344-0338(98)80009-5. [DOI] [PubMed] [Google Scholar]
- 27.LorandMetze I, Metze K. AgNOR clusters as a parameter of cell kinetics in chronic lymphocytic leukaemia. J Clin Pathol Clin Mol Pathol. 1996;49:M357–M360. doi: 10.1136/mp.49.6.m357. [DOI] [PMC free article] [PubMed] [Google Scholar]
- 28.Haralick RM, Shanmuga K, Dinstein I. Textural features for image classification. IEEE Trans Systems Man Cybernetics. 1973;SMC3:610–621. [Google Scholar]
- 29.Garcia FAR, Ranger-Moore J, Barker B, Davis J, Brewer M, Lozevski J, Vinyak S, Liu Y, Yemane J, Hatch KD, Alberts DS, Bartels HG, Bartels PH. Karyometric image analysis for intraepithelial and invasive cervical lesions. Anal Quant Cytol Histol. 2004;26:141–150. [PubMed] [Google Scholar]
- 30.Ranger-Moore J, Bartels PH, Bozzo P, Einspahr J, Liu Y, Saboda K, Alberts DS. Karyometric analysis of actinic damage in unexposed and sun-exposed skin and in actinic keratoses in untreated individuals. Anal Quant Cytol Histol. 2004;26:155–165. [PubMed] [Google Scholar]
- 31.Choi HJ, Choi IH, Kim TY, Cho NH, Choi HK. Three-dimensional visualization and quantitative analysis of cervical cell nuclei with confocal laser scanning microscopy. Anal Quant Cytol Histol. 2005;27:174–180. [PubMed] [Google Scholar]
- 32.Ranger-Moore J, Frank D, Lance P, Alberts D, Yozwiak M, Bartels HG, Einspahr I, Bartels PH. Karyometry in rectal mucosa of patients with previous colorectal adenomas. Anal Quant Cytol Histol. 2005;27:134–142. [PubMed] [Google Scholar]
- 33.Us-Krasovec M, Erzen J, Zganec M, Strojan-Flezar M, Lavrencak J, Garner D, Doudkine A, Palcic B. Malignancy associated changes in epithelial cells of buccal mucosa: A potential cancer detection test. Anal Quant Cytol Histol. 2005;27:254–262. [PubMed] [Google Scholar]
- 34.Abu Eid R, Landini G. Morphometry of pseudoepitheliomatous hyperplasia: Objective comparison to normal and dysplastic oral mucosae. Anal Quant Cytol Histol. 2005;27:232–240. [PubMed] [Google Scholar]
- 35.Karakitsos P, Pouliakis A, Kordalis G, Georgoulakis J, Kittas C, Kyroudes A. Potential of radial basis function neural networks in discriminating benign from malignant lesions of the lower urinary tract. Anal Quant Cytol Histol. 2005;27:35–42. [PubMed] [Google Scholar]
- 36.Ramos D, Ruiz A, Morell L, Navarro S, Villamon R, Gil-Salom M, Llombart-Bosch A. Prognostic value of morphometry in low grade papillary urothelial bladder neoplasms. Anal Quant Cytol Histol. 2004;26:285–294. [PubMed] [Google Scholar]
- 37.Metze K, Souza Filho W, Adam RL, Lorand-Metze IGH, Leite NJ. Analysis of the component “tree” as a new tool for analytical cellular pathology. Anal Cell Pathol. 2001;22:64. [Google Scholar]
- 38.Wu HS, Xu R, Harpaz N, Burstein D, Gil J. Segmentation of microscopic images of small intestinal glands with directional 2-D filters. Anal Quant Cytol Histol. 2005;27:291–300. [PubMed] [Google Scholar]
- 39.Choi HJ, Choi IH, Cho NH, Choi HK. Color image analysis for quantifying renal tumor angiogenesis. Anal Quant Cytol Histol. 2005;27:43–51. [PubMed] [Google Scholar]
- 40.Glotsos D, Spyridonos P, Cavouras D, Ravazoula P, Dadioti PA, Nikiforidis G. Automated segmentation of routinely hematoxylin-eosin-stained microscopic images by combining support vector machine clustering and active contour models. Anal Quant Cytol Histol. 2005;26:331–340. [PubMed] [Google Scholar]
- 41.Tarta C, da Silva VD, Teixeira CR, Prolla JC, Meurer L, Neto CC, Tanaka S. Digital image analysis and stereology of angiogenesis in polypoid and nonpolypoid colorectal adenomas. Anal Quant Cytol Histol. 2005;26:201–206. [PubMed] [Google Scholar]
- 42.Meschino GJ, Moler E. Semiautomated image segmentation of bone marrow biopsies by texture features and mathematical morphology. Anal Quant Cytol Histol. 2005;26:31–38. [PubMed] [Google Scholar]
- 43.Metze K, Gomes Neto A, Adam RL, Gomes AA, Leite NJ, Souza EM, Cintra ML. Texture of dermal elastotic tissue in patients with different phenotypes. Analyt Cell Pathol. 2002;24:196. [Google Scholar]
- 44.Nafe R, Glienke W, Burgemeister R, Gangnus R, Haar B, Pries A, Schlote W. Regional heterogeneity of EGFR gene amplification and nuclear morphology in glioblastomas: An investigation using laser microdissection and pressure catapulting. Anal Quant Cytol Histol. 2004;26:65–76. [PubMed] [Google Scholar]
- 45.Matsuoka LY, Kousseff BG, Hashimoto K. Studies of the skin in Sjögren-Larsson syndrome by electron microscopy. Am J Dermatopathol. 1982;4:295–301. doi: 10.1097/00000372-198208000-00002. [DOI] [PubMed] [Google Scholar]


