Abstract
The continued progression of chronic lung disease despite current treatment options has led to the increasing evaluation of molecular imaging tools for diagnosis, treatment planning, drug discovery, and therapy monitoring. Concurrently the development of multimodality PET/CT, SPECT/CT, and MRI/PET scanners has opened up the potential for more sophisticated imaging biomarker probes. Here we review the potential uses of multimodality imaging tools, the established uses of molecular imaging in non-oncologic lung pathophysiology and drug discovery, and some of the technical challenges in multimodality molecular imaging of the lung.
Keywords: molecular imaging, multimodality imaging, PET/CT, SPECT/CT, MR/PET, lung imaging
1. INTRODUCTION
Molecular imaging1 is receiving increasing attention for diagnosis, treatment planning, drug discovery, and therapy monitoring of chronic lung diseases (2). During the last decade there has been a concurrent development of multimodality PET/CT and SPECT/CT scanners, and more recently MRI/PET2 scanners. These technological advancements have opened up the potential for more sophisticated imaging methods. Here we review the established uses of molecular imaging in non-oncologic lung pathophysiology imaging, the potential uses of multimodality imaging tools and some of the remaining technical challenges in multimodality molecular imaging of the lung.
1.1 Imaging biomarkers for lung disease
The molecular processes that contribute to the development of lung disease are complex. Clinically useful physiologic measurements of lung function have been used to assess the severity of any particular lung disease on pulmonary function. Other measurements, such as bronchoalveolar lavage and exhaled nitric oxide measurements, can offer more quantitative measurements of inflammation or related processes. Molecular imaging approaches, on the other hand, can noninvasively measure both global and regional differences in relevant molecular processes throughout the lungs. These tools have the potential to contribute significantly our understanding of the molecular basis of lung disease in patients.
Molecular imaging approaches may also facilitate the translation of effective targeted therapies for lung disease. The identification and validation of lung-specific biomarkers that can assess the response of a particular targeted pathway to a therapeutic intervention could dramatically increase the efficiency of drug development. Such imaging biomarkers could be used in all phases of drug development, from identifying the most effective compounds at phase 0 to serving as potential surrogate endpoints (if validated as such) in phase 3 clinical trials.
Currently available biomarkers for lung function, while clinically very useful, have certain limitations in the setting of clinical trials that may be overcome by molecular imaging techniques. Pulmonary function tests (PFTs) have been used as an endpoint in a number of clinical trials; however, these measurements can be quite variable even in the absence of treatment (3), and to use PFT measurements as an endpoint requires months to years of follow-up to detect clinically significant changes. Pulmonary function tests are also often not a specific measurement for the process being targeted by the therapeutic agent. Serum parameters, such as the levels of systemic inflammatory markers, do not necessarily reflect the activity of the same process in the lungs as these processes can be highly compartmentalized. Bronchoalveolar lavage provides a way to sample the alveolar space and thus to obtain lung-specific information; however, the invasiveness of the procedure limits its repeatability over the course of a clinical trial. Additionally, it does not capture the level of activity occurring in the entire lung as only a few segments are sampled, and the lung parenchyma and intravascular compartments remain inaccessible expect by biopsy. Induced sputum, while clearly a less invasive method for obtaining information about the lung inflammatory process, is dependent on patient effort and may thus lead to variable measurements in patients with lung disease.
Positron emission tomography (PET) and single-photon emission computed tomography (SPECT) are both clinically applicable imaging modalities around which potentially useful biomarkers may be developed. Both can give quantitative data regarding the activity of the process being measured, although PET is more innately quantitative than SPECT. PET in particular is a highly sensitive technique that can potentially be used for evaluating low levels of cellular activity. Given that most lung diseases affect the lungs heterogeneously, tomographic imaging techniques such as PET and SPECT enable investigators to make regional measurements of the parameter in question. Both PET and SPECT have been used to study regional ventilation and perfusion (4–6). PET has also been used to assess various aspects of lung physiology in patients, including measurements of extravascular lung water (7–11), blood flow, blood volume, regional ventilation and perfusion, vascular permeability, (12, 13), beta-adrenoceptor density (14), and inflammation (15–17). Tracer development for both PET and SPECT, targeting a multitude of cellular and molecular processes, will expand the potential applications of both modalities as biomarkers of lung disease. Combined with the information that can now be obtained by CT and MR, noninvasive characterization of the full pathophysiology of non-oncologic lung disease is now a potential reality more than ever. With these tools, investigators can now study the relevant lung biology that leads to progression of these diseases in patients, with the potential of identifying novel therapeutic targets for drug development.
2. COMPARING AND COMBINING MOLECULAR IMAGING MODALITIES
2.1 Modality-specific considerations: Imaging physics
PET: The fundamental role of a PET scanner is to form an image of the spatially varying concentration of positron-emitters, typically 18F with a half-life of 110 minutes (18). A positron emitter is attached to a biological substrate of interest, e.g., the glucose analogue 2-deoxyglucose, to become a radiolabeled tracer, in this case 18F-fluorodeoxyglucose (FDG), which is used for ~90% of all PET imaging studies. With corrections for physical effects, most notably attenuation, accurate estimates of the spatially-varying concentration of positron-emitters (e.g. FDG) in kBq/ml can be obtained. To account for variations in the injected dose and patient size, generally preferred units are standardized uptake values (SUVs) defined as SUV = R (d' / Ṽ) (19, 20), where R (kBq/ml) is the activity concentration within a region of interest, d' (kBq) is the decay-corrected injected dose, and Ṽ is a surrogate for the volume of distribution of tracer inside the body. Typically patient weight (kg) is used as a surrogate for the volume of distribution, in which case SUV units are g/ml. Since adipose tissue, with the exception of brown fat, does not normally take up significant amounts of FDG, the estimated lean-body-mass or body surface area is sometimes used instead of weight. Unique advantages of PET include very high sensitivity (typically detecting ~5% of all radioactive decays), and quantitative accuracy with proper calibration (21, 22).
SPECT: Similar to PET, SPECT also provides tomographic images of radiolabeled tracers using photon counting (18). In contrast to PET, however, the use of single-photon emitting radioisotopes leads to a relative disadvantage of 3 orders of magnitude in the resolution/sensitivity trade-off. As practiced in clinical imaging, SPECT typically has lower resolution and significantly lower sensitivity than PET, although higher resolution than PET is possible at the expense of even lower sensitivity, e.g. longer imaging times or restricted imaging areas. In terms of the quantitative accuracy of regional tracer measurements, SPECT is more challenging than PET due to depth-dependent attenuation and resolution loss.
Both and PET and SPECT form images of radioisotope concentration but only after significant corrections for several effects, including photon attenuation and scatter. These corrections rely on a separate estimate of photon attenuation, which are typically obtained from a CT scan or a dedicated transmission source.
Imaging the lung with PET, SPECT or CT uses high energy photons; thus, these images not only have related imaging properties as described above, but also deliver radiation dose to the patient. MR imaging in the lung, however, has two well known challenges: lack of signal from the relatively low concentration of hydrogen nuclei (from low tissue density), and distortions arising from sharp gradients of the magnetic susceptibility at the tissue/air interfaces. Many of these problems can be overcome by using a rapid, spin echo-based imaging sequence that utilizes respiratory and cardiac gating and minimizes signal for other tissue (23). Other solutions to these problems are being developed (e.g. (24)) but are beyond the scope of this review.
2.2 Modality-specific considerations
2.2.1. Quantification Approaches for PET
One of the primary advantages of PET is the ease with which tracer accumulation in a tissue or region of interest (ROI) can be quantified. Both static and dynamic measurements can be obtained with PET. Static measurements such as the standard uptake value (SUV) are based on the number of counts measured at a particular time point within a given ROI. The SUV, which is the amount of activity in a ROI divided by the injected dose per unit of body weight, is easily calculated and used frequently in clinical practice. In contrast, dynamic measurements allow calculations of the rate of tracer uptake or the amount of tracer binding to a receptor in a tissue of interest. Individual rate constants that define the movement of the tracer between different functional compartments (e.g. transport of a tracer from the intravascular space into the interstitium) within a tissue can also be calculated. While static measurements are easy to obtain, they may not be as sensitive as rate measurements to small changes in tracer activity when overall uptake is low, such as in the lungs (25). Therefore, dynamically acquired imaging data under these conditions may be better suited for quantifying low levels of tracer uptake in the lungs.
Patlak graphical analysis (26, 27) and compartmental modeling techniques (28) have been used successfully to quantify lung FDG uptake in pre-clinical studies as well as in patients and healthy volunteers (15, 16, 25, 29–34). The generally accepted standard for quantifying PET image data is compartmental modeling (35), which can be used to estimate the individual rate constants defining tracer movement between the blood and tissue compartments. However, blood samples must be carefully obtained to generate an accurate input function. Patlak graphical analysis, on the other hand, is a “model-free” technique for determine the influx constant Ki that describes the flux of FDG into a tissue ROI and does not require precise determination of the input function at early time points. The equation that governs the Patlak analysis:
| [1] |
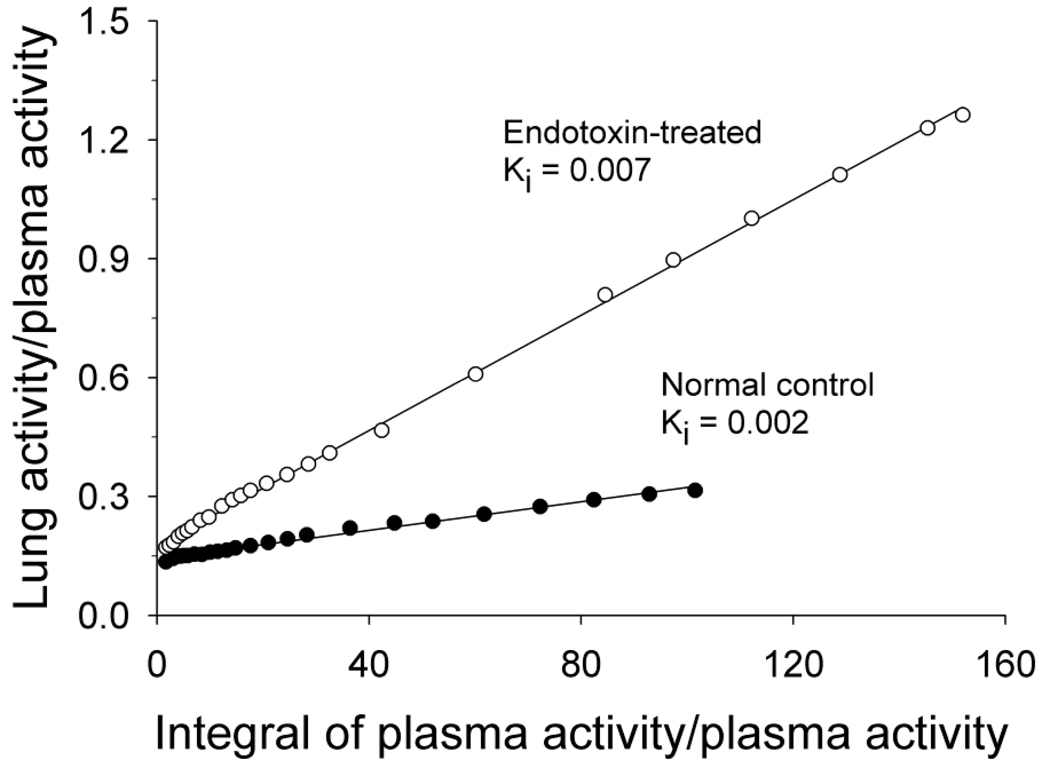
is derived from the equations used for compartment modeling with the assumption that once the tracer enters the tissue compartment, it is trapped irreversibly (26, 27). Under these conditions, the system being imaged eventually reaches steady-state at which time a plot can be generated that is linear over time. Determination of the slope of the linear portion of the plot yields a rate, the influx constant Ki, for the tracer. For the lungs, the units of Ki are ml blood/ml lung/min (25). An example of a Patlak plot is shown in Figure 1. While the Patlak graphical analysis does not require detailed characterization of the early portion of the blood curve, inaccuracies in the blood samples obtained near the end of the scan can heavily influence the results. Therefore, analytical approaches that use image-derived input functions (a full discussion of which is beyond the scope of this review) may perform better for this kind of analysis.
Figure 1.
Sample Patlak plots obtained in 2 dogs, 1 injected with a low dose of endotoxin prior to PET imaging and 1 normal control. Linear regression was performed on all data points after 10 minutes of scanning as the plot was linear in all animals after this time point. Clinical studies have shown that it is possible for the system to reach equilibrium within 5 minutes after injection (see (15)). Reproduced with permission of American Physiological Society, from (32); permission conveyed through Copyright Clearance Center, Inc.
Since PET data is collected in terms of volume of tissue (as opposed to grams of tissue), the amount of tissue within each voxel can vary widely as a result of changing densities. Therefore, the measured influx of FDG, when quantified by Ki, may be either artificially low or high if differences in the amount of tissue per voxel are not normalized. For this reason, Jones et al introduced the concept of normalizing the Ki with the intercept obtained by Patlak graphical analysis (29). The intercept represents the initial volume of distribution of FDG in a given ROI and correlates highly with density. In lung diseases in which the amount of tissue specifically taking up FDG is increased, leading to an increase in tissue density, this adjustment is likely necessary. Data from patients with pneumonia (in which the influx of neutrophils would represent an increase in the amount of tissue taking up FDG) (29), COPD and cystic fibrosis (in which significant parenchymal destruction can occur) (15, 16) suggest that this approach may be useful in these conditions. In contrast, data generated in models of acute lung injury indicate that the density correction may artificially lower the calculated rate of FDG uptake (25) and that modeling the kinetics in lung injury to accommodate the noncellular compartment created by the pulmonary edema observed with acute lung injury may be required (34).
Accommodating respiratory motion to ensure that quantitative measures of lung tracer uptake are accurate is also a challenge, particularly with the development of PET-CT scanners. Because of the greater spatial and temporal resolution possible with CT scans, there is now a higher likelihood of attenuation correction artifacts and potential uncertainty when using the CT images for region of interest (ROI) placement. A variety of breathing protocols have been tested for clinical PET-CT imaging, with quiet free breathing or breath-holds at normal (in contrast to maximal) end-expiration demonstrated to be most useful for minimizing respiratory artifacts (36, 37). There are, however, errors introduced by this approach (38, 39), and so several methods to compensate for respiratory motion have been proposed, as described below.
2.2.2. Quantification Approaches for SPECT
Both static and dynamic SPECT imaging data can be acquired to determine the level of tracer uptake in any given tissue. Attenuation correction is particularly important for SPECT quantification as the attenuation of the lower energy photons emitted by the radioisotopes used for SPECT imaging is significantly higher than that of the higher-energy photons from PET radioisotopes. Accurate scatter correction is also of utmost importance for accurate SPECT quantification due to the lower energy photons emitted for SPECT. Imaging external radiotracer sources can be used to improve the accuracy of these corrections for SPECT imaging and potentially allow absolute measurements of tracer accumulation, as is inherently possible with PET imaging. Once the accuracy of the SPECT data obtained is verified, the same kinetic modeling approaches used for PET can also be used for SPECT data, with similar issues as described above. Because the count density is often an issue for SPECT, this may present challenges with tracers that accumulate only at low levels in the lungs.
2.3 Multimodality Considerations
Before considering multimodality imaging, it is useful to consider the ability of each imaging modality to image different properties or processes. In turn, having an image of a spatially-varying property can be used to evaluate different conditions and/or diseases. For example, CT provides exemplary anatomical information based on photon attenuation, which can be used to evaluate many, if not all, of the pulmonary diseases listed. In addition, however, with the appropriate choice of contrast mechanism and/or method of operation, CT and MRI can also be used to form images of material composition relative to ventilation or perfusion among other properties, as described elsewhere in this issue. Conversely, all four modalities can be used to form images of positional variations in ventilation or perfusion. An alternative viewpoint is to consider a physiology or pathophysiology and determine the optimal combination of modalities for imaging, potentially including secondary conditions. The choice of the most appropriate modality is clearly task dependent and is a complex issue.
An important consideration of multimodality imaging is the complementary nature of the modalities. In other words, what are the advantages of contemporaneous or simultaneous imaging? With PET/CT and SPECT/CT (both of which use contemporaneous imaging) the CT images provide accurate anatomical localization of sites of radiotracer accumulation (40). In particular, the use of high resolution CT in the diagnosis of lung disease is well established. In addition CT images can provide a convenient basis for correction of scatter and attenuation (41, 42).
A potential benefit of combined MR/PET or MR/SPECT lung imaging is reduced radiation dose, in particular for longer acquisitions using respiratory gating. Although clinical benefits of MR/PET or MR/SPECT imaging have not yet been identified, there is clearly a role for such multimodal imaging in research. At a base level such methods can be used for cross validation of new imaging methods. For example, validation of perfusion magnetic resonance imaging has been performed against the gold standard of 15O-water PET (43). At a more sophisticated level, there exists the potential to measure several aspects of a disease at the same time, such as imaging concomitant aspects of inflammation and angiogenesis in cancer. Imaging these three related conditions at the same time has the potential to aid basic research, drug discovery with preclinical imaging, and clinical trials for drug development. Several MR/PET scanners suitable for research studies with small animals have already been developed (44). There are, however, technical challenges in combined MR/PET or MR/SPECT lung imaging for humans, as described below.
3. CLINICAL APPLICATIONS
With the development of combined PET/CT scanners, investigators now have access to image data that can be used to more precisely localize the activity measured by PET imaging. This combined modality information can be used to study the impact of differentially-affected lung segments in contributing to the overall progression of lung disease. Even with dedicated PET images, localization of activity is limited at best to lung zones but cannot be precisely assigned to specific segments or subsegments. PET/CT now provides a method by which this information can be obtained.
3.1 FDG-PET/CT for Lung Inflammation
Neutrophilic inflammation appears to be an important contributor to the pathophysiology of a number of lung diseases. Both acute lung injury (ALI)/acute respiratory distress syndrome (ARDS) and cystic fibrosis are characterized by persistent neutrophilic lung inflammation. The presence of neutrophil-predominant inflammation in asthma and COPD patients is being increasingly recognized as a more severe phenotype for both diseases, COPD. Data from both animal and human studies indicate that FDG is taken up primarily by activated neutrophils. FDG-PET has been used successfully in clinical studies to quantify the presence of activated neutrophils in pneumonia, (29) asthma (45), COPD, (16) cystic fibrosis (15) FDG-PET has also been used to image experimentally-induced lung inflammation in healthy volunteers (31) and the effect of anti-inflammatory treatments in this human model (46). These data suggest that FDG-PET will be a useful biomarker for assessing the lung’s response to anti-inflammatory therapies.
While FDG-PET can be useful for assessing neutrophilic inflammation and possibly the total inflammatory burden in the lungs, quantification of glucose uptake is not specific to inflammatory processes. However, this technique is currently the only approach that is widely available at multiple centers for clinical use; hence, this review will focus on the applications of FDG-PET in clinical trials. [18F]FDG-labeled leukocytes have also been developed to improve the targeting of inflammatory lesions. This approach has been evaluated in several small patient studies (47, 48), demonstrating reasonable sensitivity and high specificity in conjunction with PET-CT imaging (49). However, the labeling efficiency with [18F]FDG tends to be lower on average when compared to In-111-labeled leukocytes, potentially limiting the clinical utility of this approach (50). Other approaches for imaging inflammatory lesions with PET or SPECT which have been evaluated in clinical studies in the past but are being improved upon in pre-clinical development include leukocyte receptor targeting (51) and radiolabeled antibiotics (52).
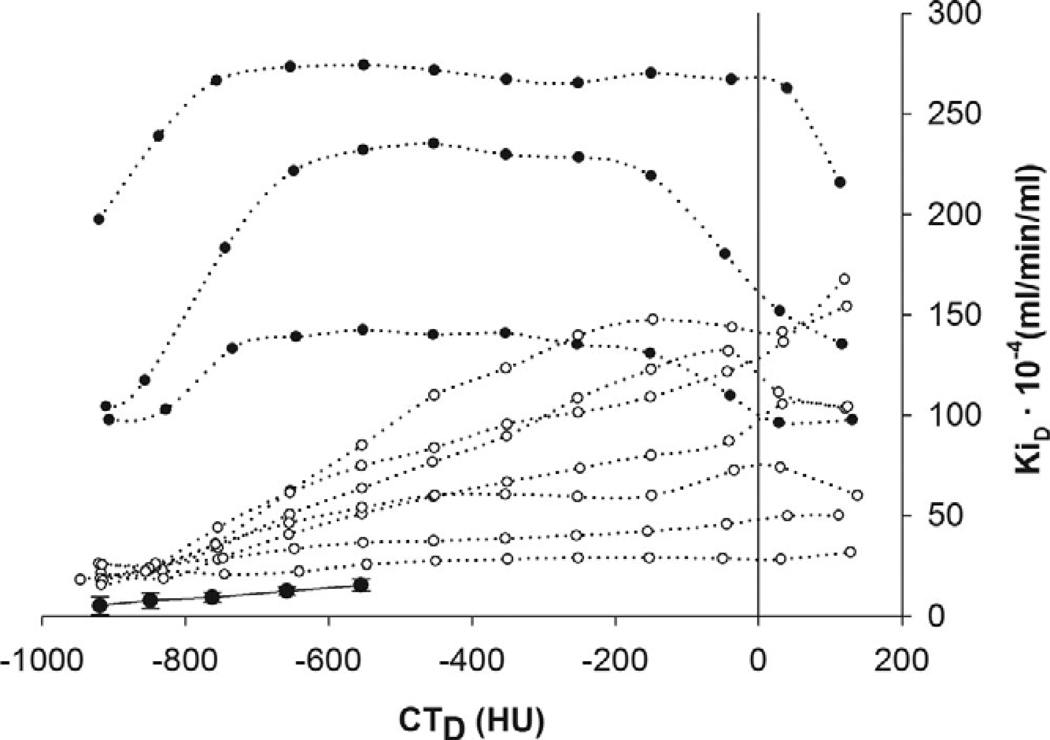
Recent clinical studies in acute lung injury and acute respiratory distress syndrome (ALI/ARDS) (30) and cystic fibrosis (53) illustrate the potential benefits of having and challenges in acquiring the combined PET/CT information. Ten patients with ALI/ARDS were studied using dynamic PET/CT scanning and compared the density-normalized Ki, calculated by Patlak graphical analysis, to two mechanically ventilated patients and four spontaneously breathing volunteers without underlying lung disease as controls. The parameter Ki was elevated in all the ALI/ARDS patients compared with the normal-lung controls. They also found that the most metabolically active areas could be found in both aerated and poorly or non-aerated areas of the lung and that the pattern of uptake varied from patient to patient. However, in plotting the FDG uptake vs. CT density, two overall patterns of uptake emerged in which Ki increased with a density and another pattern in which Ki was elevated regardless of density (Figure 2). The patients in this study were not imaged at the same time points in their disease due to the difficulties in recruiting for such a study, and the small numbers make it difficult to draw any firm conclusions. However, despite the study limitations, the data provide compelling evidence that the regional information combined with anatomic localization provided by PET/CT may be a useful means of stratifying patients with ALI/ARDS, whether for optimizing treatment approaches or for monitoring the progression of the disease.
Figure 2.
Distribution of PET regional metabolic activity (Ki) versus CT measures of lung density (CTD). Mean and std. dev. of normal controls are indicated by the solid line. Data from patients with ALI/ARDS are indicated by dotted lines: Open and solid circles are for patterns 1 and 2. as described in the text. (With kind permission from Springer Science+Business Media: (30)).
For the cystic fibrosis study, 20 patients were studied on a PET/CT scanner, 13 during an acute exacerbation and 7 of the 13 after intravenous antibiotic treatment for the exacerbation. Static images were obtained 60–90 minutes after injection of FDG, with uptake measured by SUV. All patients with severe disease clinically as well as all 13 patients imaged during acute exacerbation had multiple foci of increased FDG uptake, whereas patients judged to have mild-to-moderate disease had few foci with low levels of uptake (SUV 0.5–3). None of the foci of uptake correlated with CT findings. Interestingly, in the seven patients who returned for repeat scanning, the foci of uptake observed on the initial PET/CT scan disappeared on repeat imaging, and in the remaining subject, the intensity of uptake was decreased. No change in CT was observed. These findings suggest that FDG-PET is more sensitive than CT for evaluating therapy response and demonstrate the known ability of PET to complement CT by demonstrating which CT lesions may be clinically relevant metabolically active lesions. However, the CT information used for this study was taken from the attenuation correction scan and are not of diagnostic quality. The optimal method for combining high-resolution CT information obtained at full inspiration and the PET data obtained over multiple respiratory cycles has yet to be determined.
Overall, these results suggest that the combination of FDG-PET and CT is a promising method for assessing the neutrophilic inflammatory burden in patients with inflammatory lung disease. The anatomic localization in particular may be useful not only in patients but in better localizing the changes in induced by endotoxin in healthy volunteers, improving upon the ability to use this model for drug development.
3.2 Drug Delivery Distribution with SPECT
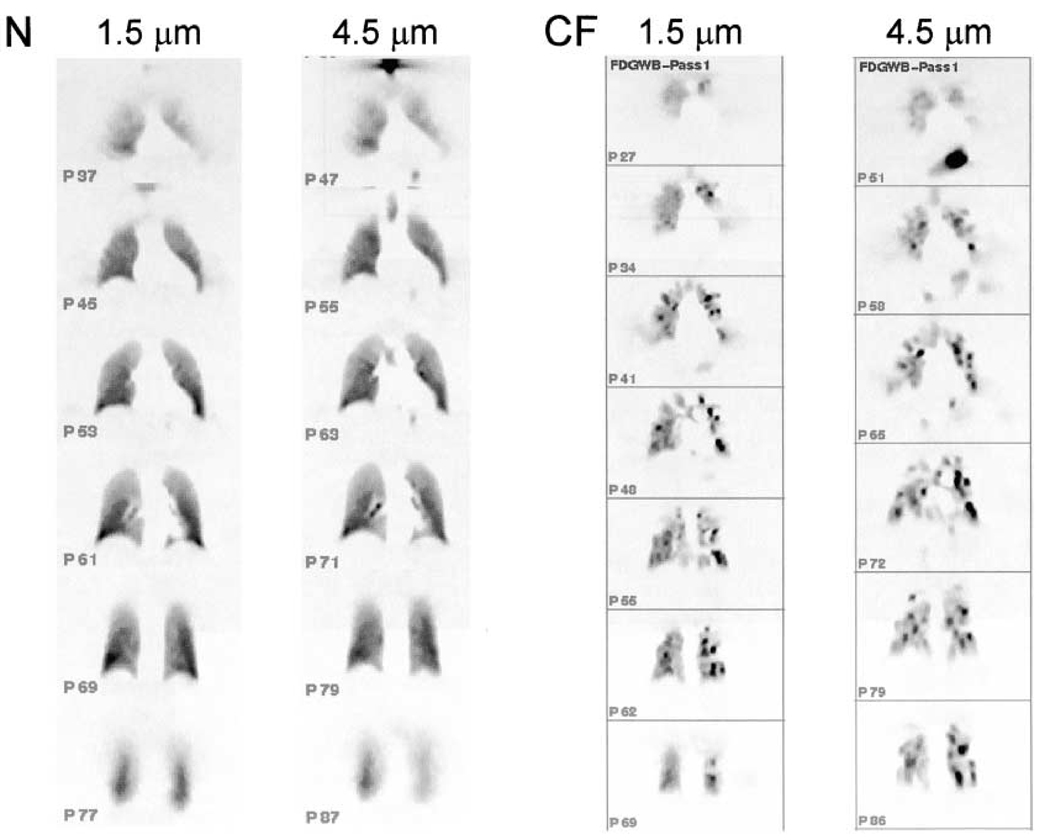
Both PET and SPECT can also be used to assess the distribution of inhaled drugs (54). The application of SPECT imaging in determining aerosol deposition is limited to non-absorbable particles as the radiolabel for SPECT is only associated with the particle, not inherently a part of the particle’s structure, and therefore can easily dissociate and interfere with the evaluation of the particle’s fate (55). PET, on the other hand, can be used to assess not only the distribution of aerosols but also evaluate the kinetics of the drug’s metabolism in the lungs. The distribution of [18F]FDG-labeled particles has been evaluated in patients with cystic fibrosis and compared with healthy volunteers (54). Using imaging, it is clear that the larger 4.5 µm particles deposited more centrally in the cystic fibrosis patients than the smaller 1.5 µm particles (Figure 3). With PET/CT, it is now possible to localize the fate of these particles anatomically more precisely and to study the relationship between structural abnormalities and particle deposition.
Figure 3.
PET images acquired from subjects that are normal (N) and with cystic fibrosis (CF) after inhalation of FDG 1.5 and 4.5 µm aerosols (Reprinted with premission from). Reprinted with permission of the American Thoracic Society. Copyright (c) American Thoracic Society (54).
3.3. Potential Clinical Applications for MR/PET in Lung Imaging
The sophistication of MR imaging applications in the lungs continues to grow. Physiological measurements such as regional lung function (56) and ventilation (57), gas diffusion in airways (58), and alveolar oxygen measurements (59) can be made in patients by MR. These techniques have been applied in diseases such as asthma (60), COPD (58), and cystic fibrosis (61) to identify changes in regional ventilation, which is more sensitive than detecting changes global pulmonary function measurements (62). New developments in using F-19 MR may also allow the measurement of lung inflammation (63) based on the accumulation of the F-19 in monocytes, although the sensitivity of this technique remains to be determined when compared with PET.
Because MR, unlike CT, does not involve exposure of patients to ionizing radiation, combining MR/PET for lung imaging is an attractive option. Respiratory gated MR/PET is particularly appealing from a radiation dose perspective as obtaining the gated information with CT can require a significant amount of radiation exposure for the patient, which is particularly undesirable in children. However, physical constraints on this approach (Section 4) will likely make clinical application of this approach difficult at present. Improvements in the technology will certainly make MR/PET an appealing alternative to PET/CT.
4. TECHNICAL CONSIDERATIONS OF MULTIMODAL MOLECULAR LUNG IMAGING
4.1 Technology development
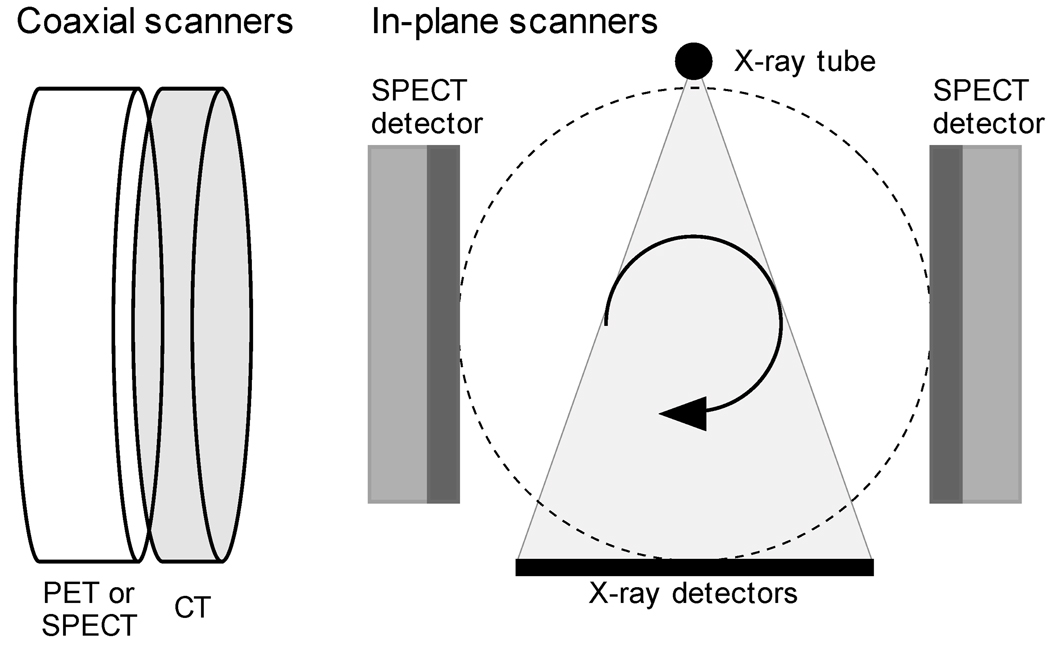
PET/CT is a well-established clinical and research multimodality combination that has proven to be a powerful tool for diagnosis and staging of lung cancer as well as many other forms of cancer (40, 64). SPECT/CT is gradually becoming more established with several commercial scanners available and a growing number of published studies supporting clinical and research use (65, 66). Both PET/CT and SPECT/CT with diagnostic-quality CT are similar in design with the scanners attached side-by-side in a co-axial design (Figure 4). There are also in-plane SPECT/CT scanners, but these use low current x-ray sources and do not provide diagnostic-quality CT images. Neither approach allows for simultaneous PET (or SPECT) and CT imaging as the high photon flux rate of the x-ray tube would overload the PET (or SPECT) detector system. In-plane PET/CT scanners with diagnostic-quality CT scanners are currently not feasible for several reasons, including design complexity and the potential for radiation damage to the PET detectors.
Figure 4.
Illustration of coaxial (left) and in-plane (right) PET/CT and SPECT/CT imaging.
There are two approaches that have been implemented for clinical MRI/PET systems. The first is shown in Figure 5, where an MRI-compatible PET detector ring is placed inside a standard 3T MRI scanner (67). In this system the inner diameter of the PET detector ring is sufficient to allow insertion of an MRI head coil unit. The advantages of this type of integrated approach are that it allows for simultaneous MRI/PET imaging and thus has a higher throughput and the best possible image registration between the MRI and PET images. This system, however, is necessarily limited to head imaging and thus cannot accommodate lung imaging. An additional challenge is the lack of a transmission source to directly measure the PET or SPECT emission attenuation image.
Figure 5.
Illustration of a MRI/PET scanner combinations. (a) MR scanner with a PET insert suitable for head imaging.(b) Tandem MRI/PET scanner with a FOV diameter sufficient for lung imaging. (c) Potential integrated MRI/PET scanner with a FOV diameter sufficient for lung imaging and also capable of simultaneous MRI and PET imaging.
The second clinical MRI/PET approach utilizes standard PET and MRI scanners with a common bed to shuttle patients between the two scanners (Figure 6). In this manner standard systems and FOV diameters are useable, thus allowing thorax imaging. The other advantages are that interference between the MRI and PET scanners is easier to avoid, and that it is less expensive. The disadvantage of this approach is that simultaneous imaging is not possible. If a PET scanner is part of a PET/CT, then it will likely need to be located outside the MRI-shielded room to avoid magnetic and RF interference from the rotating CT components. This increases the likelihood of motion between the MRI and PET/CT scan. If a PET-only system is located adjacent to the MRI scanner to reduce potential patient motion artifacts, then there is no transmission source to directly measure the emission attenuation image.
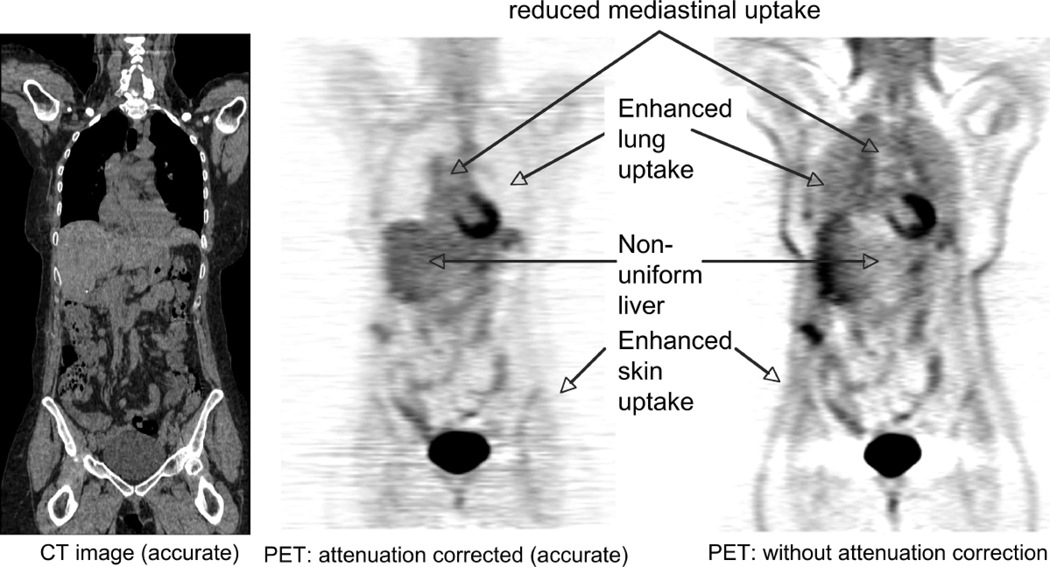
Figure 6.
CT and PET images showing the affects of photon attenuation in the PET emission data.
A potential method to allow simultaneous MRI/PET imaging of the lungs is illustrated in Figure 5(c). In this case a narrow and MR-compatible PET detector ring is sandwiched between split MRI gradient coils to allow for a larger diameter joint FOV for both MRI and PET imaging. Suitable PET technologies are in the offing, with the development of small form-factor silicon photomultipliers (68), which are in early development. There are considerable technological challenges to be overcome in the development of such an integrated MRI/PET scanner. In addition, direct measurement of the emission attenuation image remains a challenge.
4.2 Attenuation Correction
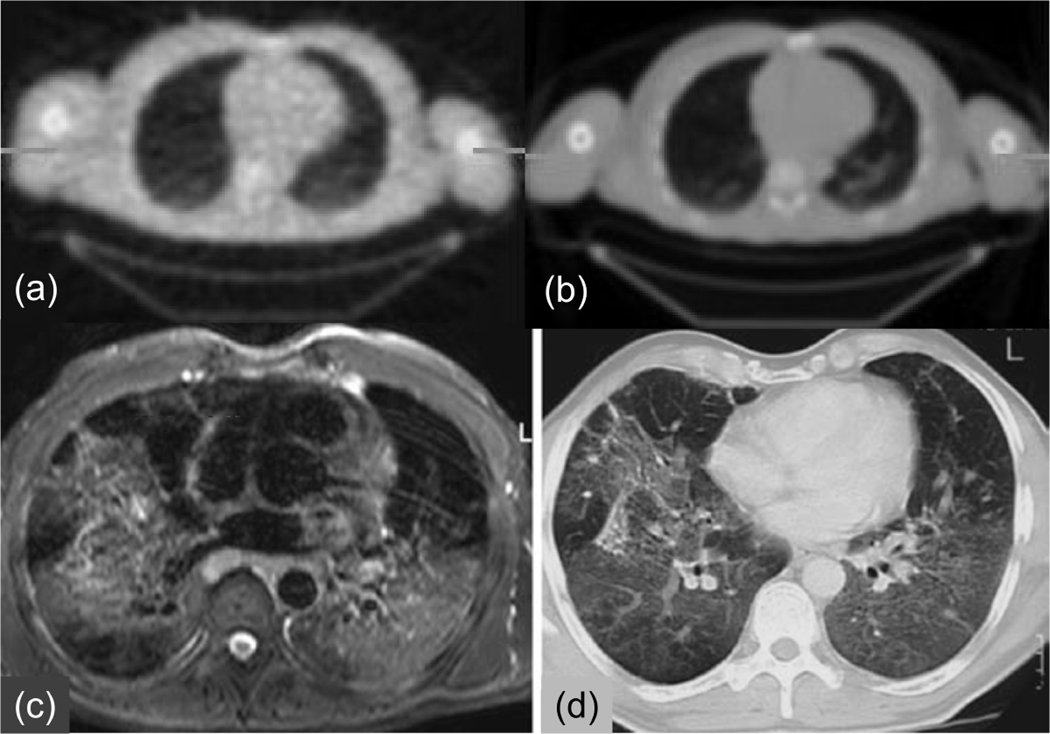
The impact of attenuation on PET imaging is illustrated in Figure 6, which indicates the typical characteristics of a PET image if correction for annihilation photon attenuation is not applied. Similar effects apply to SPECT imaging if attenuation correction is not applied. For PET/CT and SPECT/CT imaging, the attenuation factors can be conveniently derived from the CT image (41, 42, 65). The accuracy of this estimation is illustrated in Figures 7(a) and 7(b), comparing PET transmission and scaled CT images of a patient thorax. With stand-alone PET or SPECT scanners, typically an orbiting transmission source at the desired energy is used to measure the attenuation factors.
Figure 7.
MRI, CT, PET transmission images of the thorax. (a) PET transmission and (b) CT images of the same patient showing the similarity of the physical properties measured. (c) MRI and (d) CT images of the thorax of a different patient showing the lack of similarity of the physical properties measured (With kind permission from Springer Science+Business Media: (80)).
With MR/PET imaging, the MR image values typically represent a weighted average of hydrogen proton density, spin-lattice relaxation times, and spin-spin relaxation times, which are influenced by the local environment (69). The MRI image values (unlike CT) do not have a direct connection to the attenuation values that are the confounding factors for PET or SPECT. This is illustrated in Figures 7(c) and 7(d), which compares CT and T2-weighted MRI images of the lung. Of particular note is that the MR signal in bone is significantly different from that on the CT image, as well as differences in the blood and adipose tissue values. Therefore, there is no simple scaling method that can be used to convert the MRI image to a CT-equivalent (or attenuation) image. Finally, we note that the MRI intensity values in the lung are reduced due to the low density of hydrogen nuclei in the lungs and possibly also due to susceptibility artifacts, some of which are visible. Solutions to these problems are being developed, such as the use of inhaled hyperpolarized gases (57).
Two approaches to MR-based attenuation correction have been proposed (70). The first is the use of image segmentation to identify distinct regions of tissue values and then replace them with known attenuation values. The second approach uses attenuation image templates based on population averages or CT images of the same patient. The attenuation images are then aligned to the MRI image using non-rigid image registration for attenuation correction of the emission data. Each method has well-known challenges (70, 71). In addition, while the MRI receiver coils are not visible in the MRI image, they will still attenuate the PET signal and so should be accounted for in the attenuation correction process. There is no accepted solution to this problem at the moment.
4.3 Respiratory Motion
Multimodality imaging of the lung necessarily involves considerations of respiratory motion. High resolution CT images of the lung can readily be acquired during a single breath-hold due to significant advances in CT imaging technology over the last decade. Most notably, the use of helical (spiral) continuous imaging with multi-row detectors allows lung imaging in a few seconds with ideal imaging properties. This is not the case, however, for MRI, PET, or SPECT lung imaging, due to their slower acquisition speeds.
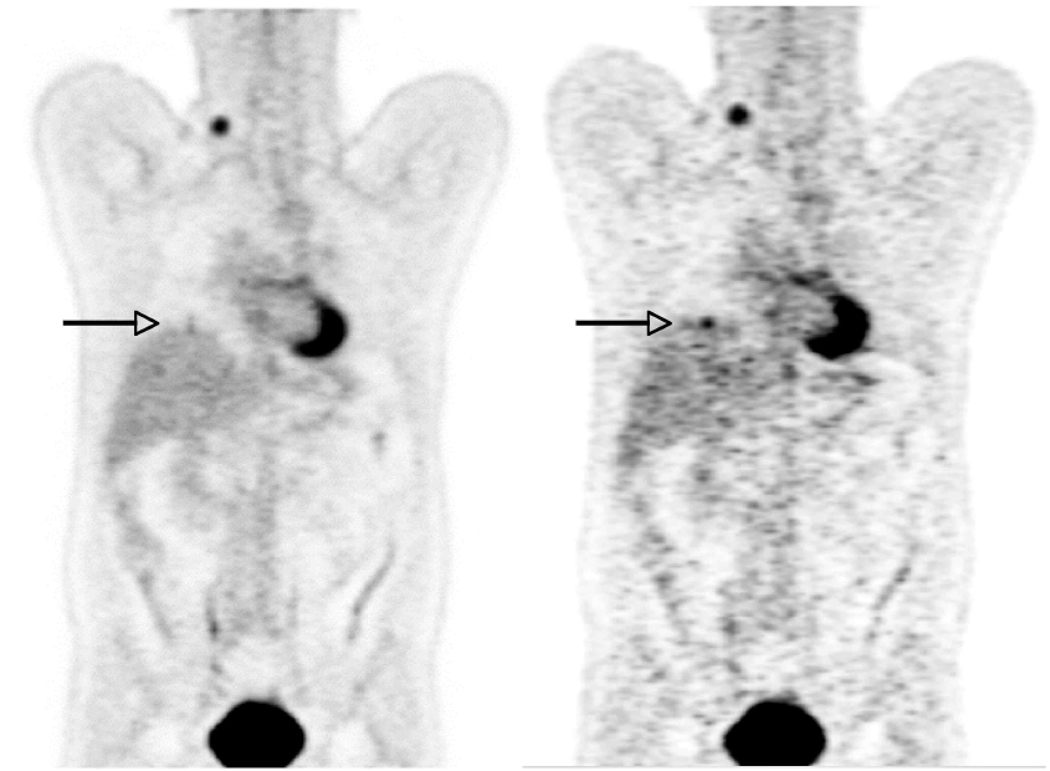
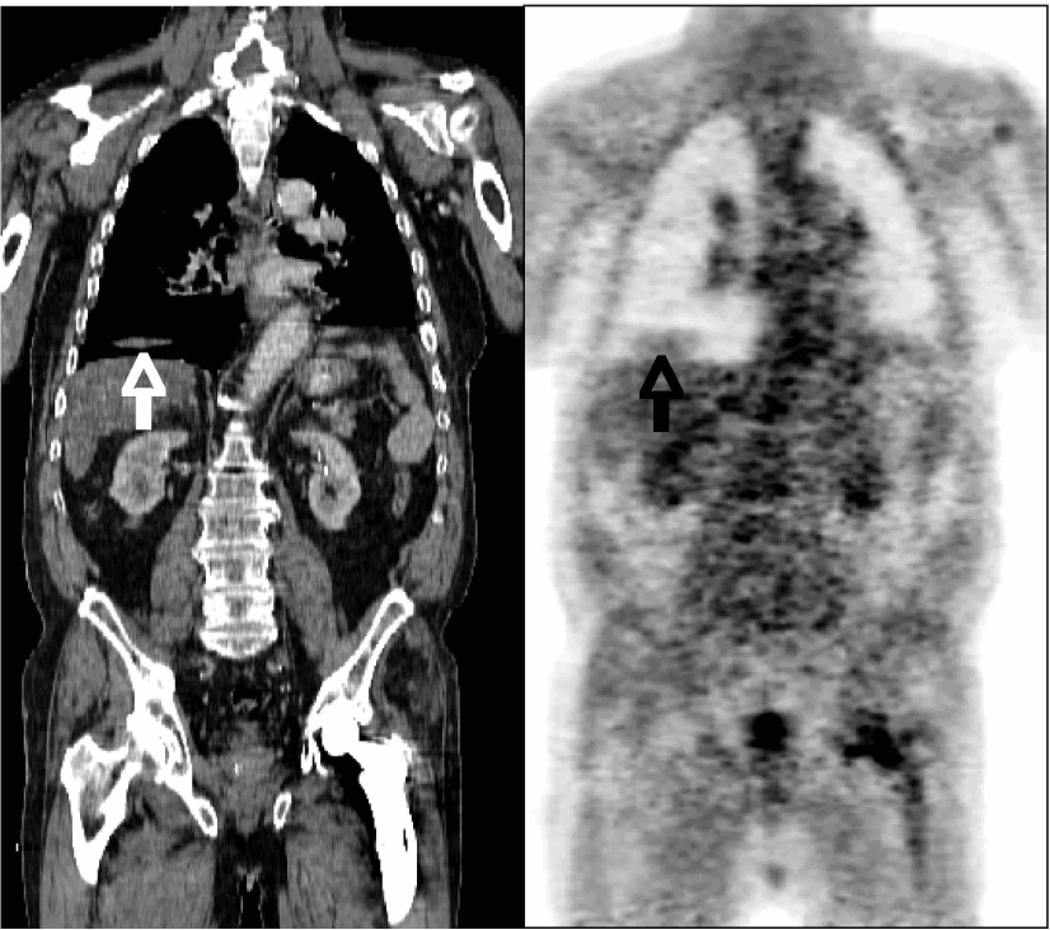
There are two major respiratory motion effects in multimodality molecular imaging. The first is respiratory blurring that leads to shape distortion and loss of signal, as illustrated in Figure 8. In the standard PET image the SUV of a 1 cm lesion is 2.0. In a respiratory-gated PET image (seven respiratory phase bins) the SUV increases to 6.0, showing the impact of respiratory motion on PET image quantitation accuracy.
Figure 8.
Impact of respiratory motion on PET image values. Left: Standard whole-body PET image. Right: Respiratory-gated PET image that is one of seven phase bins, and thus contains only 1/7 of the data and is correspondingly nosier. However, the SUV of a lesion at the base of the lung (arrow) shows a significantly higher uptake.
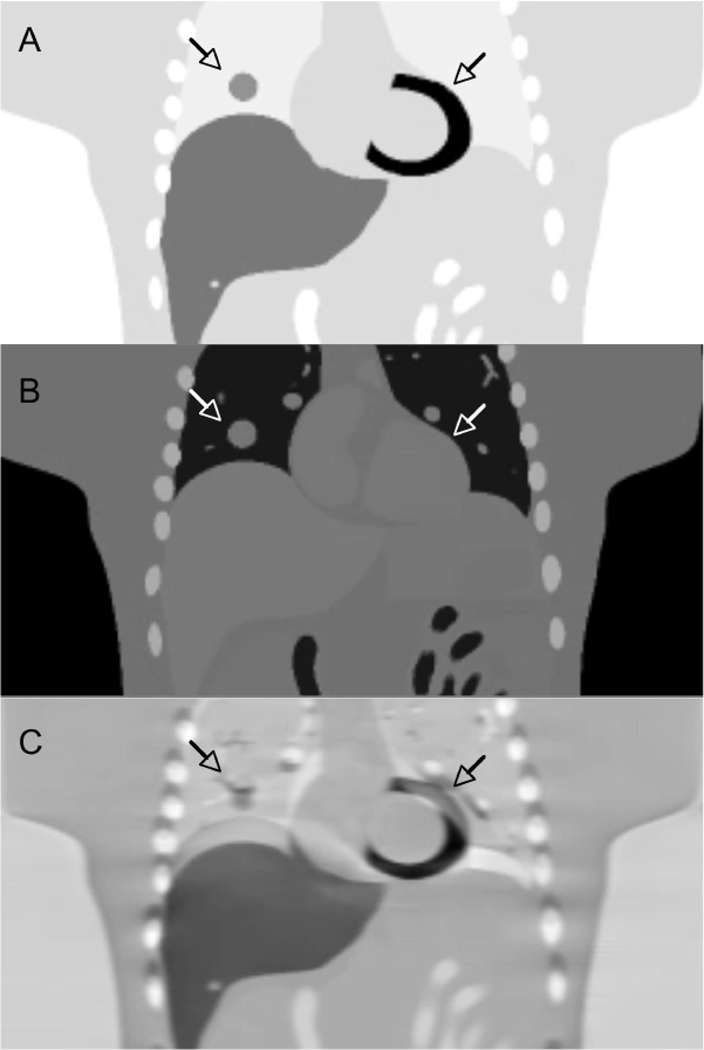
The second effect is the potential for inter-modality positional mismatch. This effect also impacts the use of CT (or potentially MR) for attenuation correction of PET or SPECT data. Mismatch in PET/CT imaging is illustrated in Figure 9, where a detailed computer simulation shows several effects that result from using a misaligned CT image for attenuation correction of PET data. Finally, Figure 10 gives an example of the combined effects of respiratory blurring and inter-modality misalignment. Respiratory motion during the CT scan causes an artifact in the lung bases on the CT image. Subsequently using the artifact-containing CT image for attenuation correction of the PET image introduces a related artifact in the lungs on the PET image.
Figure 9.
Computer simulation of using a misaligned CT image for attenuation correction of PET data. A: true PET tracer uptake image with a lung lesion and myocardial uptake (arrows). B: CT attenuation image. C: PET image reconstructed after using incorrect respiratory phase of CT for attenuation correction, showing significant artifacts in PET tracer uptake in the lesion and left ventricle.
Figure 10.
Combined effects of respiratory blurring (arrow) in CT image, and inter modality misalignment of attenuation correction introducing artifacts in the lung (arrow) in the PET image.
In light of the above discussion and examples, respiratory motion compensation for quantitative multimodality molecular imaging of the lung is important. In PET/CT imaging of the lung, there has been considerable effort on such methods (Table 1). The most direct approach is the use of respiratory gating to reduce the effects of respiratory motion blurring (72). To compensate inter-modality positional mismatch, one approach is the use of time-averaged CT images (73) to approximately match the respiratory blurring that occurs during the PET image acquisition; however, this method is at best an approximate solution and also requires longer CT acquisition times, increasing the radiation dose delivered to the patient. A different approach is to use phase-matched respiratory-gated CT and PET images to jointly solve for both respiratory motion blurring and inter-modality mismatch (74). One of the difficulties with this approach, however, is the multitude of noisy images that are produced. This has lead to the development of more sophisticated methods that remove respiratory motion artifacts of both types while preserving quantitative accuracy and without increasing noise (75).
Table 1.
Overview of methods used for PET/CT respiratory motion compensation.
| Respiratory compensation methods developed for PET/CT imaging* |
|---|
| Quiescent breathing (37, 77) |
| Breath hold (38) |
| Cine CT attenuation correction (CTAC) (73) |
| Respiratory gated PET (4D-PET) (72) |
| Phase-matched 4D-PET and 4D-CT (74) |
| Temporal smoothing of 4D PET (78) |
| Quiescent period gating (79) |
| Non-rigid image registration (75) |
Methods are listed in order of increasing complexity. Cited references are for illustrative examples.
These methods can be considered to some extent as a hierarchy, with more sophisticated (and complex) methods providing more accurate compensation for respiratory blurring and PET-CT mismatch. This is a rapidly advancing field, and a review of potential methods is beyond the scope of this report. A summary of these methods is given in Table 1 and general overview is given in the review by Nehmeh (76). In SPECT/CT and MRI/PET imaging of the lung, similar considerations apply. However, the multimodality aspects of SPECT/CT and MRI/PET respiratory compensation methods are less advanced given the nascency of these technologies.
5. CONCLUSIONS
PET/CT is already established as a useful clinical and research tool for multimodality molecular imaging of the lung. There is also considerable clinical and research promise for SPECT/CT imaging given the number approved SPECT radiotracers. With MRI/PET perhaps comes the greatest flexibility given the range of applications of MRI. The clinical path for MRI/PET lung imaging is not clear, and there are significant technical challenges, including MRI signal levels, attenuation correction, and respiratory motion. However given the separate abilities of PET, SPECT, CT, and MRI separately in basic research, drug discovery and clinical trials, it seems likely that multimodality molecular imaging scanners will be even more useful in these application areas.
Acknowledgements
The authors would also like to acknowledge Edwin Van Beek, Simon Cherry, Ramsey Badawi, Raymond Raylman, Ciprian Catana, and Alexander Ganin for helpful discussions. The authors would also like to acknowledge the contributions of the late Dr. Daniel P. Schuster to the field of functional pulmonary PET imaging.
DLC is supported by NIH grant K08 EB006702. This work was also supported in part by NIH grant R01 CA115870.
Footnotes
"Molecular imaging is the visualization, characterization, and measurement of biological processes at the molecular and cellular levels in humans and other living systems." (1).
Both ultrasound and optical imaging have applications in aspects of pulmonary imaging, but the potential combinations with PET, SPECT, CT, or MRI are beyond the scope of this review.
Contributor Information
Delphine L. Chen, Division of Nuclear Medicine Mallinckrodt Institute of Radiology, Washington University School of Medicine, St. Louis, MO..
Paul E. Kinahan, Imaging Research Laboratory, Department of Radiology, University of Washington, Seattle, WA..
References
- 1.Mankoff DM. A Definition of Molecular Imaging. Journal of Nuclear Medicine. 2007;48:18N–19N. [PubMed] [Google Scholar]
- 2.Schuster DP, Blackwell T, editors. Lung biology in health and disease. Boca Raton, FL: Taylor & Francis; 2005. [Google Scholar]
- 3.Stanbrook MB, Corey M, Tullis DE. The repeatability of forced expiratory volume measurements in adults with cystic fibrosis. Chest. 2004;125:150–155. doi: 10.1378/chest.125.1.150. [DOI] [PubMed] [Google Scholar]
- 4.Glenny RW. Determinants of regional ventilation and blood flow in the lung. Intensive Care Med. 2009;35:1833–1842. doi: 10.1007/s00134-009-1649-3. [DOI] [PubMed] [Google Scholar]
- 5.Harris RS, Winkler T, Tgavalekos N, et al. Regional pulmonary perfusion, inflation, and ventilation defects in bronchoconstricted patients with asthma. Am J Respir Crit Care Med. 2006;174:245–253. doi: 10.1164/rccm.200510-1634OC. [DOI] [PMC free article] [PubMed] [Google Scholar]
- 6.Tgavalekos NT, Tawhai M, Harris RS, et al. Identifying airways responsible for heterogeneous ventilation and mechanical dysfunction in asthma: an image functional modeling approach. J Appl Physiol. 2005;99:2388–2397. doi: 10.1152/japplphysiol.00391.2005. [DOI] [PubMed] [Google Scholar]
- 7.Fazio F, Jones T, MacArthur CG, Rhodes CG, Steiner RE, Hughes JM. Measurement of regional pulmonary oedema in man using radioactive water (H215O) Br J Radiol. 1976;49:393–397. doi: 10.1259/0007-1285-49-581-393. [DOI] [PubMed] [Google Scholar]
- 8.Schuster DP, Anderson C, Kozlowski J, Lange N. Regional pulmonary perfusion in patients with acute pulmonary edema. J Nucl Med. 2002;43:863–870. [PubMed] [Google Scholar]
- 9.Wollmer P, Rhodes CG, Allan RM, Maseri A, Fazio F. Regional extravascular lung density and fractional pulmonary blood volume in patients with chronic pulmonary venous hypertension. Clin Physiol. 1983;3:241–256. doi: 10.1111/j.1475-097x.1983.tb00707.x. [DOI] [PubMed] [Google Scholar]
- 10.Wollmer P, Rhodes CG, Deanfield J, et al. Regional extravascular density of the lung in patients with acute pulmonary edema. J Appl Physiol. 1987;63:1890–1895. doi: 10.1152/jappl.1987.63.5.1890. [DOI] [PubMed] [Google Scholar]
- 11.Wollmer P, Rhodes CG, Hughes JM. Regional extravascular density and fractional blood volume of the lung in interstitial disease. Thorax. 1984;39:286–293. doi: 10.1136/thx.39.4.286. [DOI] [PMC free article] [PubMed] [Google Scholar]
- 12.Kaplan JD, Trulock EP, Anderson DJ, Schuster DP. Pulmonary vascular permeability in interstitial lung disease. A positron emission tomographic study. Am Rev Respir Dis. 1992;145:1495–1498. doi: 10.1164/ajrccm/145.6.1495. [DOI] [PubMed] [Google Scholar]
- 13.Kaplan JD, Trulock EP, Cooper JD, Schuster DP. Pulmonary vascular permeability after lung transplantation. A positron emission tomographic study. Am Rev Respir Dis. 1992;145:954–957. doi: 10.1164/ajrccm/145.4_Pt_1.954. [DOI] [PubMed] [Google Scholar]
- 14.Ueki J, Rhodes CG, Hughes JM, et al. In vivo quantification of pulmonary beta-adrenoceptor density in humans with (S)-[11C]CGP-12177 and PET. J Appl Physiol. 1993;75:559–565. doi: 10.1152/jappl.1993.75.2.559. [DOI] [PubMed] [Google Scholar]
- 15.Chen DL, Ferkol TW, Mintun MA, Pittman JE, Rosenbluth DB, Schuster DP. Quantifying pulmonary inflammation in cystic fibrosis with positron emission tomography. Am J Respir Crit Care Med. 2006;173:1363–1369. doi: 10.1164/rccm.200506-934OC. [DOI] [PMC free article] [PubMed] [Google Scholar]
- 16.Jones HA, Marino PS, Shakur BH, Morrell NW. In vivo assessment of lung inflammatory cell activity in patients with COPD and asthma. Eur Respir J. 2003;21:567–573. doi: 10.1183/09031936.03.00048502. [DOI] [PubMed] [Google Scholar]
- 17.Jones HA, Cadwallader KA, White JF, Uddin M, Peters AM, Chilvers ER. Dissociation between respiratory burst activity and deoxyglucose uptake in human neutrophil granulocytes: implications for interpretation of (18)F-FDG PET images. J Nucl Med. 2002;43:652–657. [PubMed] [Google Scholar]
- 18.Cherry SR, Sorenson JA, Phelps ME. Physics in Nuclear Medicine. Philadelphia, PA: Saunders; 2003. p. 3e. [Google Scholar]
- 19.Huang SC. Anatomy of SUV. Standardized uptake value. Nucl Med Biol. 2000;27:643–646. doi: 10.1016/s0969-8051(00)00155-4. [DOI] [PubMed] [Google Scholar]
- 20.Thie JA. Understanding the standardized uptake value, its methods, and implications for usage. J Nucl Med. 2004;45:1431–1434. [PubMed] [Google Scholar]
- 21.Boellaard R. Standards for PET Image Acquisition and Quantitative Data Analysis. J Nucl Med. 2009;50:11S–120S. doi: 10.2967/jnumed.108.057182. [DOI] [PubMed] [Google Scholar]
- 22.Kinahan PE, Doot RK, Wanner-Roybal M, et al. PET/CT Assessment of Response to Therapy: Tumor Change Measurement, Truth Data, and Error. Transl Oncol. 2009;2:223–230. doi: 10.1593/tlo.09223. [DOI] [PMC free article] [PubMed] [Google Scholar]
- 23.Mai VM, Knight-Scott J, Berr SS. Improved visualization of the human lung in 1H MRI using multiple inversion recovery for simultaneous suppression of signal contributions from fat and muscle. Magn Reson Med. 1999;41:866–870. doi: 10.1002/(sici)1522-2594(199905)41:5<866::aid-mrm2>3.0.co;2-d. [DOI] [PubMed] [Google Scholar]
- 24.Biederer J, Reuter M, Both M, et al. Analysis of artefacts and detail resolution of lung MRI with breath-hold T1-weighted gradient-echo and T2-weighted fast spin-echo sequences with respiratory triggering. Eur Radiol. 2002;12:378–384. doi: 10.1007/s00330-001-1147-7. [DOI] [PubMed] [Google Scholar]
- 25.Chen DL, Mintun MA, Schuster DP. Comparison of methods to quantitate 18F-FDG uptake with PET during experimental acute lung injury. J Nucl Med. 2004;45:1583–1590. [PubMed] [Google Scholar]
- 26.Patlak CS, Blasberg RG. Graphical evaluation of blood-to-brain transfer constants from multiple-time uptake data. Generalizations. J Cereb Blood Flow Metab. 1985;5:584–590. doi: 10.1038/jcbfm.1985.87. [DOI] [PubMed] [Google Scholar]
- 27.Patlak CS, Blasberg RG, Fenstermacher JD. Graphical evaluation of blood-to-brain transfer constants from multiple-time uptake data. J Cereb Blood Flow Metab. 1983;3:1–7. doi: 10.1038/jcbfm.1983.1. [DOI] [PubMed] [Google Scholar]
- 28.Huang SC, Phelps ME. Principles of tracer kinetic modeling in positron emission tomography and autoradiography. In: Phelps ME, Mazziotta JC, Schelbert HR, editors. Positron Emission Tomography and Autoradiography: Principles and Applications for the Brain and Heart. New York, NY: Raven Press; 1986. pp. 287–346. [Google Scholar]
- 29.Jones HA, Sriskandan S, Peters AM, et al. Dissociation of neutrophil emigration and metabolic activity in lobar pneumonia and bronchiectasis. Eur Respir J. 1997;10:795–803. [PubMed] [Google Scholar]
- 30.Bellani G, Messa C, Guerra L, et al. Lungs of patients with acute respiratory distress syndrome show diffuse inflammation in normally aerated regions: a [18F]-fluoro-2-deoxy-D-glucose PET/CT study. Crit Care Med. 2009;37:2216–2222. doi: 10.1097/CCM.0b013e3181aab31f. [DOI] [PubMed] [Google Scholar]
- 31.Chen DL, Rosenbluth DB, Mintun MA, Schuster DP. FDG-PET imaging of pulmonary inflammation in healthy volunteers after airway instillation of endotoxin. J Appl Physiol. 2006;100:1602–1609. doi: 10.1152/japplphysiol.01429.2005. [DOI] [PubMed] [Google Scholar]
- 32.Chen DL, Schuster DP. Positron emission tomography with [18F]fluorodeoxyglucose to evaluate neutrophil kinetics during acute lung injury. Am J Physiol Lung Cell Mol Physiol. 2004;286:L834–L840. doi: 10.1152/ajplung.00339.2003. [DOI] [PubMed] [Google Scholar]
- 33.Jones HA, Donovan T, Goddard MJ, et al. Use of 18FDG-pet to discriminate between infection and rejection in lung transplant recipients. Transplantation. 2004;77:1462–1464. doi: 10.1097/01.tp.0000121767.05724.33. [DOI] [PubMed] [Google Scholar]
- 34.Schroeder T, Vidal Melo MF, Musch G, Harris RS, Venegas JG, Winkler T. Modeling pulmonary kinetics of 2-deoxy-2-[18F]fluoro-D-glucose during acute lung injury. Acad Radiol. 2008;15:763–775. doi: 10.1016/j.acra.2007.12.016. [DOI] [PMC free article] [PubMed] [Google Scholar]
- 35.Lammertsma AA. Measurement of tumor response using [18F]-2-fluoro-2-deoxy-D-glucose and positron-emission tomography. J Clin Pharmacol. 2001 Suppl:104S–106S. [PubMed] [Google Scholar]
- 36.Gilman MD, Fischman AJ, Krishnasetty V, Halpern EF, Aquino SL. Optimal CT breathing protocol for combined thoracic PET/CT. Am J Roentgenol. 2006;187:1357–1360. doi: 10.2214/AJR.05.1427. [DOI] [PubMed] [Google Scholar]
- 37.Goerres GW, Kamel E, Heidelberg TN, Schwitter MR, Burger C, von Schulthess GK. PET-CT image co-registration in the thorax: influence of respiration. Eur J Nucl Med Mol Imaging. 2002;29:351–360. doi: 10.1007/s00259-001-0710-4. [DOI] [PubMed] [Google Scholar]
- 38.Kawano T, Ohtake E, Inoue T. Deep-Inspiration Breath-Hold PET/CT of Lung Cancer: Maximum Standardized Uptake Value Analysis of 108 Patients. Journal of Nuclear Medicine. 2008;49:1223–1231. doi: 10.2967/jnumed.107.049296. [DOI] [PubMed] [Google Scholar]
- 39.Liu C, L. P, Alessio AM, Kinahan PE. The impact of respiratory motion on tumor quantification and delineation in static PET/CT imaging. Physics in Medicine and Biology. 2009;54:7345–7362. doi: 10.1088/0031-9155/54/24/007. [DOI] [PMC free article] [PubMed] [Google Scholar]
- 40.Beyer T, Townsend DW, Brun T, et al. A combined PET/CT scanner for clinical oncology. Journal of Nuclear Medicine. 2000;41:1369–1379. [PubMed] [Google Scholar]
- 41.Kinahan PE, Hasegawa BH, Beyer T. X-ray Based Attenuation Correction for PET/CT Scanners. Seminars in Nuclear Medicine. 2003;33:166–179. doi: 10.1053/snuc.2003.127307. [DOI] [PubMed] [Google Scholar]
- 42.Kinahan PE, Townsend DW, Beyer T, Sashin D. Attenuation correction for a combined 3D PET/CT scanner. Med Phys. 1998;25:2046–2053. doi: 10.1118/1.598392. [DOI] [PubMed] [Google Scholar]
- 43.Takasawa M, Jones PS, Guadagno JV, et al. How reliable is perfusion MR in acute stroke? Validation and determination of the penumbra threshold against quantitative PET. Stroke. 2008;39:870–877. doi: 10.1161/STROKEAHA.107.500090. [DOI] [PubMed] [Google Scholar]
- 44.Cherry SR, Louie AY, Jacobs RE. The Integration of Positron Emission Tomography With Magnetic Resonance Imaging. Proceedings of the IEEE. 2008;96:416–438. [Google Scholar]
- 45.Taylor IK, Hill AA, Hayes M, et al. Imaging allergen-invoked airway inflammation in atopic asthma with [18F]-fluorodeoxyglucose and positron emission tomography. Lancet. 1996;347:937–940. doi: 10.1016/s0140-6736(96)91416-6. [DOI] [PubMed] [Google Scholar]
- 46.Chen DL, Bedient TJ, Kozlowski J, et al. [18F]fluorodeoxyglucose positron emission tomography for lung antiinflammatory response evaluation. Am J Respir Crit Care Med. 2009;180:533–539. doi: 10.1164/rccm.200904-0501OC. [DOI] [PMC free article] [PubMed] [Google Scholar]
- 47.Pio BS, Byrne FR, Aranda R, et al. Noninvasive quantification of bowel inflammation through positron emission tomography imaging of 2-deoxy-2-[18F]fluoro-D-glucose-labeled white blood cells. Molecular Imaging & Biology. 2003;5:271–277. doi: 10.1016/s1536-1632(03)00103-3. [DOI] [PubMed] [Google Scholar]
- 48.Rini JN, Bhargava KK, Tronco GG, et al. PET with FDG-labeled Leukocytes versus Scintigraphy with 111In-Oxine,Äìlabeled Leukocytes for Detection of Infection1. Radiology. 2006;238:978–987. doi: 10.1148/radiol.2382041993. [DOI] [PubMed] [Google Scholar]
- 49.Dumarey N, Egrise D, Blocklet D, et al. Imaging Infection with 18F-FDG-Labeled Leukocyte PET/CT: Initial Experience in 21 Patients. J Nucl Med. 2006;47:625–632. [PubMed] [Google Scholar]
- 50.Rini JN, Palestro CJ. Imaging of infection and inflammation with 18F-FDG-labeled leukocytes. Q J Nucl Med Mol Imaging. 2006;50:143–146. [PubMed] [Google Scholar]
- 51.Locke LW, Chordia MD, Zhang Y, et al. A novel neutrophil-specific PET imaging agent: cFLFLFK-PEG-64Cu. J Nucl Med. 2009;50:790–797. doi: 10.2967/jnumed.108.056127. [DOI] [PMC free article] [PubMed] [Google Scholar]
- 52.Siaens RH, Rennen HJ, Boerman OC, Dierckx R, Slegers G. Synthesis and Comparison of 99mTc-Enrofloxacin and 99mTc-Ciprofloxacin. J Nucl Med. 2004;45:2088–2094. [PubMed] [Google Scholar]
- 53.Klein M, Cohen-Cymberknoh M, Armoni S, et al. 18F-fluorodeoxyglucose-PET/CT imaging of lungs in patients with cystic fibrosis. Chest. 2009;136:1220–1228. doi: 10.1378/chest.09-0610. [DOI] [PubMed] [Google Scholar]
- 54.Dolovich M, Labiris R. Imaging drug delivery and drug responses in the lung. Proc Am Thorac Soc. 2004;1:329–337. doi: 10.1513/pats.200404-030MS. [DOI] [PubMed] [Google Scholar]
- 55.Dolovich MB. Measuring total and regional lung deposition using inhaled radiotracers. J Aerosol Med. 2001;14 Suppl 1:S35–S44. doi: 10.1089/08942680150506321. [DOI] [PubMed] [Google Scholar]
- 56.Tetzlaff R, Schwarz T, Kauczor HU, Meinzer HP, Puderbach M, Eichinger M. Lung Function Measurement of Single Lungs by Lung Area Segmentation on 2D Dynamic MRI. Acad Radiol. 2010 doi: 10.1016/j.acra.2009.11.009. [DOI] [PubMed] [Google Scholar]
- 57.Emami K, Kadlecek SJ, Woodburn JM, et al. Improved technique for measurement of regional fractional ventilation by hyperpolarized 3He MRI. Magn Reson Med. 2010;63:137–150. doi: 10.1002/mrm.22186. [DOI] [PMC free article] [PubMed] [Google Scholar]
- 58.Gierada DS, Woods JC, Bierhals AJ, et al. Effects of diffusion time on short-range hyperpolarized (3)He diffusivity measurements in emphysema. J Magn Reson Imaging. 2009;30:801–808. doi: 10.1002/jmri.21912. [DOI] [PMC free article] [PubMed] [Google Scholar]
- 59.Miller GW, Mugler JPr, Altes TA, et al. A short-breath-hold technique for lung pO2 mapping with 3He MRI. Magn Reson Med. 2010;63:127–136. doi: 10.1002/mrm.22181. [DOI] [PMC free article] [PubMed] [Google Scholar]
- 60.Holmes JH, O'Halloran RL, Brodsky EK, et al. Three-dimensional imaging of ventilation dynamics in asthmatics using multiecho projection acquisition with constrained reconstruction. Magn Reson Med. 2009;62:1543–1556. doi: 10.1002/mrm.22150. [DOI] [PMC free article] [PubMed] [Google Scholar]
- 61.Woodhouse N, Wild JM, van Beek EJ, Hoggard N, Barker N, Taylor CJ. Assessment of hyperpolarized 3He lung MRI for regional evaluation of interventional therapy: a pilot study in pediatric cystic fibrosis. J Magn Reson Imaging. 2009;30:981–988. doi: 10.1002/jmri.21949. [DOI] [PubMed] [Google Scholar]
- 62.Tashkin DP, de Lange EE. Imaging of the distal airways. J Allergy Clin Immunol. 2009;124:S78–S83. doi: 10.1016/j.jaci.2009.10.002. [DOI] [PMC free article] [PubMed] [Google Scholar]
- 63.Ebner B, Behm P, Jacoby C, et al. Early Assessment of Pulmonary Inflammation By 19F MRI In Vivo. Circ Cardiovasc Imaging. 2010 doi: 10.1161/CIRCIMAGING.109.902312. [DOI] [PMC free article] [PubMed] [Google Scholar]
- 64.Weber WA, Grosu AL, Czernin J. Technology Insight: advances in molecular imaging and an appraisal of PET/CT scanning. Nat Clin Pract Oncol. 2008;5:160–170. doi: 10.1038/ncponc1041. [DOI] [PubMed] [Google Scholar]
- 65.Hasegawa BH, Iwata K, Wong KH, et al. Dual-modality Imaging of function and physiology. Academic Radiology. 2002;9:1305–1321. doi: 10.1016/s1076-6332(03)80564-0. [DOI] [PubMed] [Google Scholar]
- 66.Keidar Z, Israel O, Krausz Y. SPECT/CT in tumor imaging: technical aspects and clinical applications. Semin Nucl Med. 2003;33:205–218. doi: 10.1053/snuc.2003.127310. [DOI] [PubMed] [Google Scholar]
- 67.Schlemmer HP, Pichler BJ, Schmand M, et al. Simultaneous MR/PET imaging of the human brain: feasibility study. Radiology. 2008;248:1028–1035. doi: 10.1148/radiol.2483071927. [DOI] [PubMed] [Google Scholar]
- 68.Lecomte R. Novel detector technology for clinical PET. Eur J Nucl Med Mol Imaging. 2009;36 Suppl 1:S69–S85. doi: 10.1007/s00259-008-1054-0. [DOI] [PubMed] [Google Scholar]
- 69.Liang Z-P, Lauterbur PC. Principles of Magnetic Resonance Imaging: A Signal Processing Perspective. e. Wiley IEEE-Press; 1999. [Google Scholar]
- 70.Hofmann M, Pichler B, Sch√∂lkopf B, Beyer T. Towards quantitative PET/MRI: a review of MR-based attenuation correction techniques. European Journal of Nuclear Medicine and Molecular Imaging. 2009;36:S93–S104. doi: 10.1007/s00259-008-1007-7. [DOI] [PubMed] [Google Scholar]
- 71.Beyer T, Weigert M, Quick HH, Pietrzyk U. MR-based attenuation correction for torso-PET/MR imaging: pitfalls in mapping MR to CT. European Journal of Nuclear Medicine and Molecular Imaging. 2008;35:1142–1146. doi: 10.1007/s00259-008-0734-0. [DOI] [PubMed] [Google Scholar]
- 72.Boucher L, Rodrigue S, Lecomte R, Benard F. Respiratory Gating for 3-Dimensional PET of the Thorax: Feasibility and Initial Results. J Nucl Med. 2004;45:214–219. [PubMed] [Google Scholar]
- 73.Chi PC, Mawlawi O, Luo D, Liao Z, Macapinlac HA, Pan T. Effects of respiration-averaged computed tomography on positron emission tomography/computed tomography quantification and its potential impact on gross tumor volume delineation. Int J Radiat Oncol Biol Phys. 2008;71:890–899. doi: 10.1016/j.ijrobp.2008.02.064. [DOI] [PMC free article] [PubMed] [Google Scholar]
- 74.Nehmeh SA, Erdi YE, Pan T, et al. Four-dimensional (4D) PET/CT imaging of the thorax. Medical Physics. 2004;31:3179–3186. doi: 10.1118/1.1809778. [DOI] [PubMed] [Google Scholar]
- 75.Kinahan PE, MacDonald L, Ng L, et al. Compensating for patient respiration in PET/CT imaging with the registered and summed phases (RASP) procedure. 3rd IEEE International Symposium on Biomedical Imaging: Nano to Macro; Washington D.C. 2006. pp. 1104–11107. [Google Scholar]
- 76.Nehmeh SA, Erdi YE. Respiratory motion in positron emission tomography / computed tomography: a review. Semin Nucl Med. 2008;38:167–176. doi: 10.1053/j.semnuclmed.2008.01.002. [DOI] [PubMed] [Google Scholar]
- 77.Beyer T, Antoch G, Muller S, et al. Acquisition Protocol Considerations for Combined PET/CT Imaging. J Nucl Med. 2004;45:25S–235. [PubMed] [Google Scholar]
- 78.Kohlmyer S, Alessio A, Kinahan P, Fessler J. 4D PET temporal smoothing with respiratory induced Fourier filter (RIFF) J Nuc Med. 2007;48:197P. [Google Scholar]
- 79.Liu C, Alessio A, Pierce L, et al. Quiescent phase respiratory gating for PET/CT. J Nuc Med. 2009;50:1473P. [Google Scholar]
- 80.Lutterbey G, Gieseke J, von F M, Morakkabati N, Schild H. Lung MRI at 3.0 T: a comparison of helical CT and high-field MRI in the detection of diffuse lung disease. European Radiology. 2005;15:324–328. doi: 10.1007/s00330-004-2548-1. [DOI] [PubMed] [Google Scholar]


