

Abstract
The relationship between various amyloidoses and chaperones is gathering attention. In patients with dialysis-related amyloidosis, α2-macroglobulin (α2M), an extracellular chaperone, forms a complex with β2-microglobulin (β2-m), a major component of amyloid fibrils, but the molecular mechanisms and biological implications of the complex formation remain unclear. Here, we found that α2M substoichiometrically inhibited the β2-m fibril formation at a neutral pH in the presence of SDS, a model for anionic lipids. Binding analysis showed that the binding affinity between α2M and β2-m in the presence of SDS was higher than that in the absence of SDS. Importantly, SDS dissociated tetrameric α2M into dimers with increased surface hydrophobicity. Western blot analysis revealed that both tetrameric and dimeric α2M interacted with SDS-denatured β2-m. At a physiologically relevant acidic pH and in the presence of heparin, α2M was also dissociated into dimers, and both tetrameric and dimeric α2M interacted with β2-m, resulting in the inhibition of fibril growth reaction. These results suggest that under conditions where native β2-m is denatured, tetrameric α2M is also converted to dimeric form with exposed hydrophobic surfaces to favor the hydrophobic interaction with denatured β2-m, thus dimeric α2M as well as tetrameric α2M may play an important role in controlling β2-m amyloid fibril formation.
Keywords: Amyloid, Biophysics, Chaperone Chaperonin, Protein Conformation, Protein Denaturation, Protein Folding, Protein Self-assembly, Protein-Protein Interactions, Spectroscopy
Introduction
A number of proteins and peptides can misfold into β-sheet-rich structures, called amyloid fibrils (1). The deposition of amyloid fibrils in intra- and extracellular spaces is responsible for more than 40 serious diseases, including Alzheimer and Parkinson diseases and dialysis-related amyloidosis (DRA)2 (1). β2-Microglobulin (β2-m) is a major structural component of amyloid fibrils in DRA, a common and serious complication in long term hemodialysis patients (2). The formation of β2-m amyloid fibrils is thought to be induced by partial unfolding of β2-m (3, 4). Several groups have established conditions under which β2-m amyloid fibril formation occurs at a neutral pH (5–11). We found that β2-m amyloid fibrils are formed at a neutral pH in the presence of SDS (11). SDS below its critical micelle concentration unfolds the compact structure of β2-m to an amyloidogenic conformer and stabilizes the extended amyloid fibrils. SDS is an anionic detergent that mimics some characteristics of biological membranes and is considered to be a good model for anionic lipids. We recently reported that some lysophospholipids, especially lysophosphatidic acid as well as nonesterified fatty acids induce the extension of β2-m amyloid fibrils at a neutral pH by partially unfolding the compact structure of β2-m to an amyloidogenic conformer as well as by stabilizing the extended fibrils (6, 8). Although many groups have proposed the mechanisms by which β2-m amyloid fibrils are formed under physiological conditions, the biological machineries to inhibit the formation and deposition of β2-m amyloid fibrils are poorly understood (12).
α2-Macroglobulin (α2M), haptoglobin (Hp), and clusterin are abundantly secreted glycoproteins present in human plasma and cerebrospinal fluid and are known as acute phase proteins (13). These glycoproteins have been found to be associated with extracellular amyloid deposits in Alzheimer disease and many other amyloidoses (13). Recently, these glycoproteins have been shown to suppress the amyloid fibril formation and amorphous aggregation of various proteins and have been described as extracellular chaperones (14–18). All of these glycoproteins can interact with prefibrillar species to maintain the solubility of amyloidogenic proteins (15–17). Wilson's group proposed that extracellular chaperones respond to misfolded and aggregated proteins in the extracellular space by binding to their exposed hydrophobic regions, maintaining the solubility of the substrate, and promoting its removal from the extracellular space via receptor-mediated endocytosis and lysosomal degradation (13, 14).
α2M is a homotetramer that is formed by noncovalent association of two disulfide-bonded dimers (19). In addition to its interactions with amyloidgenic proteins, α2M is known to trap proteases (19). The trapping of proteases is accompanied by a conformational change of α2M, which exposes receptor binding domains and consequently undergoes endocytosis by binding to low density lipoprotein receptor-related protein (20, 21). In patients with DRA, α2M is identified in the amyloid deposits (22) and forms a complex with β2-m in the blood (23). Serum concentrations of the α2M·β2-m complex are correlated with the progression of DRA (23). The complex formation has been thought to prevent the metabolism of β2-m in the kidney (24). Therefore, α2M may play an active role in the pathogenesis of DRA. However, it remains unclear whether α2M directly affects the formation of β2-m amyloid fibrils. Moreover, the mechanism by which α2M interacts with β2-m is poorly understood.
In this study, we first examined the effect of α2M on the formation of β2-m amyloid fibrils at a neutral pH in the presence of 0.5 mm SDS. We next assessed the interaction of α2M with β2-m adopting various conformational states (native state, denatured state, and amyloid fibrils). We also examined the structural changes of α2M under conditions where α2M interacted with β2-m. Finally, we examined the effect of α2M on the fibril growth at a physiologically relevant acidic pH and in the presence of heparin. Our results provide new insights into the effect of α2M on β2-m amyloid fibril formation and the mechanism of α2M-β2-m interaction.
EXPERIMENTAL PROCEDURES
Materials
Human α2M, human Hp, bovine serum albumin (BSA), and equine ferritin were obtained from Sigma. Recombinant human β2-m was expressed using an Escherichia coli expression system and purified as described previously (25). Additional procedures are discussed in the supplemental Methods.
Seed-dependent Growth Reaction of β2-m Amyloid Fibrils and Thioflavin T (ThT) Assay
Seed β2-m amyloid fibrils used for the growth reaction were prepared from the patient-derived β2-m amyloid fibrils by the repeated growth reaction at pH 7.5 with recombinant human β2-m, as described elsewhere (26). Seeds (i.e. fragmented fibrils) were prepared by sonication of the amyloid fibrils. The reaction mixture containing 30 μg/ml seeds, 25 μm β2-m, 0–25 μm α2M, Hp, BSA, or ferritin, 50 mm phosphate buffer (pH 7.5), 100 mm NaCl, 0.5 mm SDS, and 0.05% NaN3 was incubated at 37 °C without agitation. In the presence of heparin, the reaction mixture containing 30 μg/ml seeds, 25 μm β2-m, 0 or 25 μm α2M, 50 mm phosphate buffer (pH 6.3), 100 mm NaCl, 100 μg/ml heparin, and 0.05% NaN3 was incubated at 37 °C in a 96-well plate with moderate stirring (300 rpm) using a Teflon-coated microstirrer bar. The reactions were monitored by fluorescence assay with ThT in which an aliquot of 5 μl was taken from each reaction tube and mixed with 1 ml of 5 μm ThT in 50 mm sodium glycine buffer (pH 8.5) (27). The ThT fluorescence was measured using a Hitachi F-4500 spectrofluorometer (Tokyo, Japan) at 25 °C with excitation at 445 nm and emission at 485 nm.
Transmission Electron Microscopy
Sample was spread on carbon-coated grids, negatively stained with 1% phosphotungstic acid (pH 7.0), and examined under a Hitachi H-7650 electron microscope with an acceleration voltage of 80 kV.
Dot-Blot Assay
Samples of α2M, Hp, and BSA (1 μg) were spotted onto nitrocellulose membranes using a dot-blot apparatus (Bio-Rad). The membranes were blocked with 5% skim milk and then incubated for 1 h at 25 °C with 25 μm β2-m in 50 mm phosphate buffer (pH 7.5), 100 mm NaCl, 0 or 0.5 mm SDS and 1.25 μm BSA. After washing three times with a washing buffer (50 mm phosphate buffer (pH 7.5), 100 mm NaCl, and 0 or 0.5 mm SDS), bound β2-m was detected with horseradish peroxidase-conjugated anti-human β2-m antibody (1:2,000) (Dako) followed by enhanced chemiluminescence with BM Chemiluminescent Blotting substrate (Roche Applied Science). In a separate experiment, β2-m amyloid fibrils (1 μg) were first spotted on the membrane. The membranes were blocked with 5% skim milk and then incubated for 1 h at 25 °C with 55 nm α2M in 50 mm phosphate buffer (pH 7.5), 100 mm NaCl, 0.5 mm SDS, and 1.25 μm BSA. After washing three times with a washing buffer, bound α2M was detected using anti-human α2M antibody (1:400) (Sigma) and horseradish peroxidase-conjugated anti-rabbit immunoglobulins antibody (1:2,000) (Dako).
Enzyme-linked Immunosorbent Assay (ELISA)
We used an ELISA plate kit (Sumitomo Bakelite). Each well of a 96-well ELISA plate was first coated with 100 μl of 27 nm α2M dissolved in a coating buffer supplied by the manufacturer. After washing three times with a washing buffer (50 mm phosphate buffer (pH 7.5), 100 mm NaCl), 100 μl of 0–42 μm β2-m, 50 mm phosphate buffer (pH 7.5), 100 mm NaCl, 0 or 0.5 mm SDS and 1.25 μm BSA was added to the wells and incubated for 1 h at 25 °C. After washing three times with a washing buffer containing 0.5 mm SDS, bound β2-m was detected with horseradish peroxidase-conjugated anti-human β2-m antibody (1:1,000) (Dako) followed by color development using 3,3′,5,5′-tetramethylbenzidine as the peroxidase substrate (Bio-Rad). The absorbance was measured at 450 nm in a SpectraMax 250 microplate reader (Molecular Devices, Sunnyvale, CA). The binding data were subjected to Scatchard analysis.
Amyloid Fibril Formation from β2-m Monomer
The reaction mixture containing 25 μm β2-m, 1.25 μm α2M, Hp, or BSA, 50 mm phosphate buffer (pH 7.5), 100 mm NaCl, 0.5 mm SDS, and 0.05% NaN3 was incubated at 37 °C in a 96-well plate with moderate stirring (300 rpm) using a Teflon-coated microstirrer bar. ThT assay was performed as described above.
Circular Dichroism (CD) Measurements
Far-UV CD spectra of the mixture containing 0.14 μm α2M, 50 mm phosphate buffer (pH 7.5), 100 mm NaCl, and 0 or 0.5 mm SDS were measured with a Jasco 725 spectropolarimeter (Tokyo, Japan) and a cell of 0.1-cm path length at 25 °C. For the measurement of near-UV region, the CD signals of the mixture containing 0.69 μm α2M, 50 mm phosphate buffer (pH 7.5), 100 mm NaCl, and 0 or 0.5 mm SDS were recorded with a cell of 1-cm path length. The results were expressed in terms of mean residue ellipticity.
Analytical Ultracentrifugation
Sedimentation velocity of α2M in the presence or absence of SDS was measured using a Beckman-Coulter Optima XL-A analytical ultracentrifuge with an An-60 rotor and two-channel charcoal-filled Epon cells. The sample solution containing 1 μm α2M, 50 mm phosphate buffer (pH 7.5), 100 mm NaCl, and 0 or 0.5 mm SDS was measured at 25 °C. The data were analyzed using the software UltraScan 9.3.
8-Anilino-1-naphthalenesulfonate (ANS) Binding
ANS (Wako Pure Chemical Industries) was added at a final concentration of 10 μm to the mixture containing 1.25 μm α2M or 25 μm β2-m, 50 mm phosphate buffer (pH 7.5), 100 mm NaCl, and 0 or 0.5 mm SDS and incubated for 1 h at 25 °C. The ANS fluorescence was measured using a Hitachi F-7000 spectrofluorometer at 25 °C with excitation at 350 nm and emission at 400–600 nm.
Cross-linking Experiments with Bis(sulfosuccinimidyl) Suberate (BS3) and Western Blot Analysis
The reaction mixture containing 0 or 12.5 μm β2-m, 0 or 0.63 μm α2M, 50 mm citrate buffer (pH 4–5) or phosphate buffer (pH 6–7.5), 100 mm NaCl, and 0–0.5 mm SDS or 0–100 μg/ml heparin was incubated for 1 h at 25 °C. BS3 (Thermo Fisher Scientific), an amine-reactive cross-linking reagent, was then added at a final concentration of 5 mm to the mixture. After a 45-min incubation at 25 °C, the cross-linking reaction was quenched with 50 mm Tris buffer (pH 7.5). Cross-linked products were separated by 5% SDS-PAGE without reducing reagent and heat treatment. After separate SDS-PAGE performed in parallel, the proteins were transferred to PVDF membranes (Bio-Rad). The membranes were blocked with 5% skim milk. After washing three times with a washing buffer (20 mm Tris-HCl (pH 7.6), 137 mm NaCl, and 0.1% Tween 20), bound β2-m was detected with horseradish peroxidase-conjugated anti-human β2-m antibody (1:2,000) (Dako) followed by enhanced chemiluminescence with BM Chemiluminescent Blotting substrate.
RESULTS
Effect of α2M on Seed-dependent Growth of β2-m Amyloid Fibrils
First, we examined the effects of α2M and Hp on the seed-dependent growth of β2-m amyloid fibrils at pH 7.5 monitored by ThT fluorescence assay (Fig. 1, A and B). Because lysophospholipids, nonesterified fatty acids, and SDS induce the extension of β2-m amyloid fibrils by the same mechanisms (6, 8, 11), the experiments were performed mainly using SDS as a model for anionic lipids. In the absence of α2M, ThT fluorescence increased without a lag phase and proceeded to equilibrium at 24–48 h after initiation of the reaction (Fig. 1A). In the presence of α2M at molar ratios of 1:200–1:20 to β2-m, a concentration-dependent inhibitory effect was observed. At a molar ratio of 1:20, the fluorescence increase was negligible. Notably, α2M exhibited a significant inhibitory effect substoichiometrically even at a molar ratio of 1:200. In the presence of 0.5 mm oleate, α2M exhibited similar concentration-dependent inhibitory effects on the fibril growth (supplemental Fig. S1). In contrast, the addition of BSA or ferritin (440 kDa) at a molar ratio of 1:20 to β2-m had little effect on the fluorescence increase, suggesting the specific inhibitory effect of α2M on the growth of β2-m amyloid fibrils. By electron microscopy, clear fibril growth was observed after a 72-h incubation in the absence of α2M and in the presence of ferritin (Fig. 1, C, D, and F), whereas no fibril growth was observed in the presence of α2M at a molar ratio of 1:20 (Fig. 1, C and E). In the presence of Hp, another extracellular chaperone with an action similar to α2M (16), at molar ratios of 1:100–1:1 to β2-m, a concentration-dependent inhibitory effect was observed (Fig. 1B). The inhibitory effect of Hp was much lower than that of α2M because at a molar ratio of 1:20, Hp inhibited fibril growth only slightly. By electron microscopy, no fibril growth was observed in the presence of Hp at a molar ratio of 1:1 (Fig. 1, C and G). In the presence of 0.5 mm oleate, Hp exhibited similar concentration-dependent inhibitory effects on the fibril growth (supplemental Fig. S1).
FIGURE 1.

Effects of α2M and Hp on seed-dependent growth of β2-m amyloid fibrils. A, time course of fibril growth monitored by ThT fluorescence in the absence (black) or presence of 1:200 (molar ratio of α2M to β2-m) (blue), 1:100 (orange), or 1:20 (red) α2M, or in the presence of 1:20 BSA (green) or ferritin (purple). B, time course of fibril growth in the absence (black) or presence of 1:100 (orange), 1:20 (red), or 1:1 (purple) Hp. Each point represents the average of three ThT measurements from the same sample. S.D. was <5% of each average value. Each figure is a representative pattern of three independent experiments. C–G, electron microscopy images of the samples of seed-dependent growth reaction. The sample prepared in the absence (D) or presence of 1:20 α2M (E), 1:20 ferritin (F), or 1:1 Hp (G) was incubated at 37 °C for 72 h. C, seeds prepared by sonication. Scale bars, 1 μm. H, effect of α2M concentration on the initial rate of seed-dependent growth. The initial rates of seed-dependent growth were calculated from the increase of ThT fluorescence after 1-h incubation. The data points representing the average of three independent experiments were fitted to the function: Initial rate = (m + n[α2M])/(m + [α2M]), as reported previously (27) (r = 0.994). Error bars, S.D.
Next, to determine whether α2M inhibits the seed-dependent fibril growth by binding to β2-m monomers or to the growing ends of β2-m fibrils, we used two kinetic schemes reported previously (27). The initial rates of seed-dependent growth were calculated from the increase of ThT fluorescence after a 1-h incubation in the presence of 1:800–1:10 α2M (supplemental Fig. S2) and normalized by that without α2M. At a constant β2-m concentration, the initial rate decreased exponentially as the α2M concentration increased (Fig. 1H). When these data points were fitted to the function: Initial rate = (m + n[α2M])/(m + [α2M]) (27), a good fit was observed (r = 0.994). This may indicate that α2M inhibits the seed-dependent fibril growth by binding to β2-m monomers rather than binding to the growing ends of β2-m amyloid fibrils.
Differential Binding of α2M to β2-m Adopting Various Conformational States
To determine whether α2M interacts with β2-m adopting various conformational states, including native and denatured states, and amyloid fibrils, we first analyzed the binding of native and SDS-denatured β2-m to α2M by dot-blot assay. Both native and SDS-denatured β2-m were found to bind to α2M (Fig. 2A). The spot of SDS-denatured β2-m seemed to be darker than that of native β2-m. In contrast, there was no detectable binding of native and SDS-denatured β2-m to Hp and BSA. We observed previously that in the presence of 0.5 mm SDS at 37 °C, β2-m is partially unfolded, and this β2-m conformer weakly and reversibly aggregates into small oligomers composed of up to five molecules via hydrophobic interactions (11, 26). The far-UV CD spectrum of β2-m in the presence of SDS was different from that in the absence of SDS (supplemental Fig. S3). Analytical ultracentrifugation revealed that at 25 °C at which dot-blot assay was performed, SDS-denatured β2-m partly aggregated into small oligomers composed of 2–4 molecules (supplemental Fig. S3). This indicates that α2M may interact with SDS-denatured monomeric/oligomeric β2-m. The binding of α2M to β2-m amyloid fibrils was also observed (Fig. 2A). This is consistent with the previous report of α2M identified in amyloid deposits from patients with DRA (22).
FIGURE 2.

Differential binding of α2M to β2-m adopting various conformational states. A, binding of native and SDS-denatured β2-m to immobilized α2M, Hp, and BSA and binding of α2M to immobilized β2-m amyloid fibrils were assessed by dot-blot assay as under “Experimental Procedures.” B–E, binding affinities of native and SDS-denatured β2-m to immobilized α2M. α2M was immobilized on an ELISA plate and incubated with β2-m in the absence (B) or presence (D) of SDS as described under “Experimental Procedures.” Bound β2-m was detected with horseradish peroxidase-conjugated anti-human β2-m antibody, and the absorbance at 450 nm was determined. Each point represents the average of three wells. Error bars, S.D. Each figure is a representative pattern of two independent experiments. C and E, Scatchard plots of the binding data shown in B and D, respectively.
To assess quantitatively the binding of native and SDS-denatured β2-m to α2M, we performed ELISA (Fig. 2, B and D). The ELISA data were subjected to Scatchard analysis to determine the apparent dissociation constant (Kd) (Fig. 2, C and E). The apparent Kd values for native and SDS-denatured β2-m were 21.6 μm and 1.4 μm, respectively, clearly indicating that α2M interacts with SDS-denatured β2-m much more strongly than native β2-m.
To identify the binding sites for α2M in the β2-m molecule, we performed nuclear magnetic resonance (NMR) experiments. 15N-Labeled β2-m was titrated with increasing concentrations of α2M both in the presence and absence of 0.5 mm SDS at 25 °C. Although each peak position did not shift in 1H-15N heteronuclear single-quantum coherence (HSQC) spectra, the intensities of all peaks decreased simultaneously both in the absence and presence of SDS (supplemental Fig. S4). The decrease in signal intensity in the presence of SDS was greater than that in the absence of SDS. In contrast, the peak intensities remained unchanged when β2-m was titrated with BSA (supplemental Fig. S4). Although the specific regions of β2-m to interact with α2M are unidentified, these data show that α2M strongly interacts with β2-m (see “Discussion”).
Effect of α2M on Amyloid Fibril Formation from β2-m Monomer
Because α2M interacted with SDS-denatured β2-m, we next examined the effect of α2M on the SDS-induced amyloid fibril formation from β2-m monomer. When β2-m alone was incubated in the presence of 0.5 mm SDS at pH 7.5 and with agitation, ThT fluorescence increased sigmoidally with a 10-h lag time, then proceeded to equilibrium after 30–40 h (Fig. 3A). Although final equilibrium levels were varied from experiment to experiment, similar kinetics was observed in the presence of Hp and BSA (Fig. 3A). In contrast, no increase in ThT fluorescence was observed during a 40-h incubation when β2-m was incubated with α2M (Fig. 3A). By electron microscopy, clear amyloid fibril formation was observed when β2-m was incubated alone or with Hp or BSA (Fig. 3, B, D, and E), whereas only amorphous aggregates were occasionally found in the presence of α2M (Fig. 3C). These data indicate that α2M may inhibit the de novo amyloid fibril formation from β2-m monomer by binding to SDS-denatured monomeric/oligomeric β2-m.
FIGURE 3.

Effects of α2M and Hp on the amyloid fibril formation from β2-m monomer. A, time course of amyloid fibril formation monitored by ThT fluorescence in the absence (black) or presence of 1:20 α2M (red), Hp (blue), or BSA (green). Each point represents the average of three ThT measurements from the same sample. S.D. was <5% of each average value. This is a representative pattern of three independent experiments. B–E, electron microscopy images of the amyloid fibrils formed from β2-m monomer. Monomeric β2-m was incubated at 37 °C for 40 h in the absence (B) or presence of 1:20 α2M (C), Hp (D), or BSA (E). Scale bars, 100 nm.
Structural Analysis of α2M in the Presence of SDS
Although the structural change of β2-m is observed in the presence of 0.5 mm SDS, below the critical micelle concentration (supplemental Fig. S3) (11, 26), it is unclear whether the structure of α2M is affected by 0.5 mm SDS. The far-UV CD spectrum of α2M in the presence of SDS was slightly different from that in the absence of SDS (Fig. 4A). On the other hand, the near-UV CD spectra of both samples were clearly different from each other in the range of 250–300 nm (Fig. 4B). These data suggest the SDS-induced change in the secondary and tertiary structures of α2M.
FIGURE 4.

Structural analysis of α2M and β2-m in the absence and presence of SDS. A and B, far (A) and near-UV (B) CD spectra of α2M in the absence (blue) or presence (red) of SDS. The results are expressed in terms of mean residue ellipticity. C and D, distribution of sedimentation coefficients obtained from the sedimentation velocity measurements of α2M in the absence (C) and presence (D) of SDS. The centrifugation experiments were performed at 30,000 × g (C) and 17,000 × g (D), respectively. E and F, ANS fluorescence emission spectra of α2M (E) and β2-m (F) in the absence (blue) or presence (red) of SDS. The ANS fluorescence was measured with excitation at 350 nm.
To investigate whether tetrameric α2M is dissociated into dimers in 0.5 mm SDS, we next performed sedimentation velocity analytical ultracentrifugation. In the absence of SDS, the sedimentation coefficient of α2M was 17 S, consistent with a tetramer (Fig. 4C). In the presence of SDS, α2M existed as two major forms with sedimentation coefficients of 11 S and 17 S, corresponding to a dimer and a tetramer, respectively (Fig. 4D). These results indicate that α2M is partly dissociated and exists as both dimeric and tetrameric forms in the presence of 0.5 mm SDS.
The interaction between extracellular chaperones and misfolded proteins can be attributed to hydrophobic interactions (13, 14, 28). We obtained further information about the conformations of α2M and β2-m by ANS binding experiments, which are used to probe the exposure of the hydrophobic surfaces. Intriguingly, when α2M was incubated with 0.5 mm SDS, an ∼3-fold increase in ANS fluorescence intensity (λem = 470 nm) and a blue shift of the spectrum were observed (Fig. 4E). Jensen et al. (29) showed that the surface hydrophobicity of dimeric α2M is significantly higher than that of tetrameric α2M. Thus, it is reasonable to consider that SDS-induced dimerization of α2M (Fig. 4D) may lead to the exposure of the hydrophobic surfaces on α2M. Similarly, when β2-m was incubated with 0.5 mm SDS, an increase in ANS fluorescence intensity and a blue shift of the spectrum were observed (Fig. 4F), indicating that SDS induced the exposure of the hydrophobic surfaces on β2-m. These results clearly indicate that the much stronger binding of α2M to SDS-denatured β2-m than to native β2-m (Fig. 2) may be due to SDS-induced exposure of the hydrophobic surfaces on both α2M and β2-m.
Interaction of Tetrameric and Dimeric α2M with SDS-denatured β2-m
To demonstrate the interaction of tetrameric and dimeric α2M with SDS-denatured β2-m, we performed BS3 cross-linking experiments. When α2M was incubated with SDS, two bands corresponding to tetramer and dimer was identified on SDS-PAGE (Fig. 5A, lane 1). On the other hand, when α2M was incubated without SDS, only a band corresponding to tetramer was identified (Fig. 5A, lane 4). When α2M was incubated with β2-m in the presence of SDS, the dimeric band slightly shifted toward a higher molecular mass (Fig. 5A, lane 2). As shown in Western blot analysis performed in parallel (Fig. 5B, lane 2), this dimeric band harbored β2-m, indicating the interaction between SDS-denatured dimeric α2M and β2-m. Additionally, tetrameric α2M also harbored β2-m irrespective of the presence of SDS (Fig. 5B, lanes 2 and 5). The difference in the captured β2-m amount between SDS-denatured dimeric α2M and tetrameric α2M (Fig. 5B, lanes 2 and 5, respectively) is consistent with the difference in the apparent Kd value of α2M for SDS-denatured and native β2-m (1.4 μm and 21.6 μm, respectively; Fig. 2). The interaction of ferritin with β2-m was not observed in the presence of 0.5–2 mm SDS (supplemental Fig. S5), suggesting that the SDS-induced interaction of α2M with β2-m is not the generic hydrophobic interaction between SDS-denatured proteins.
FIGURE 5.
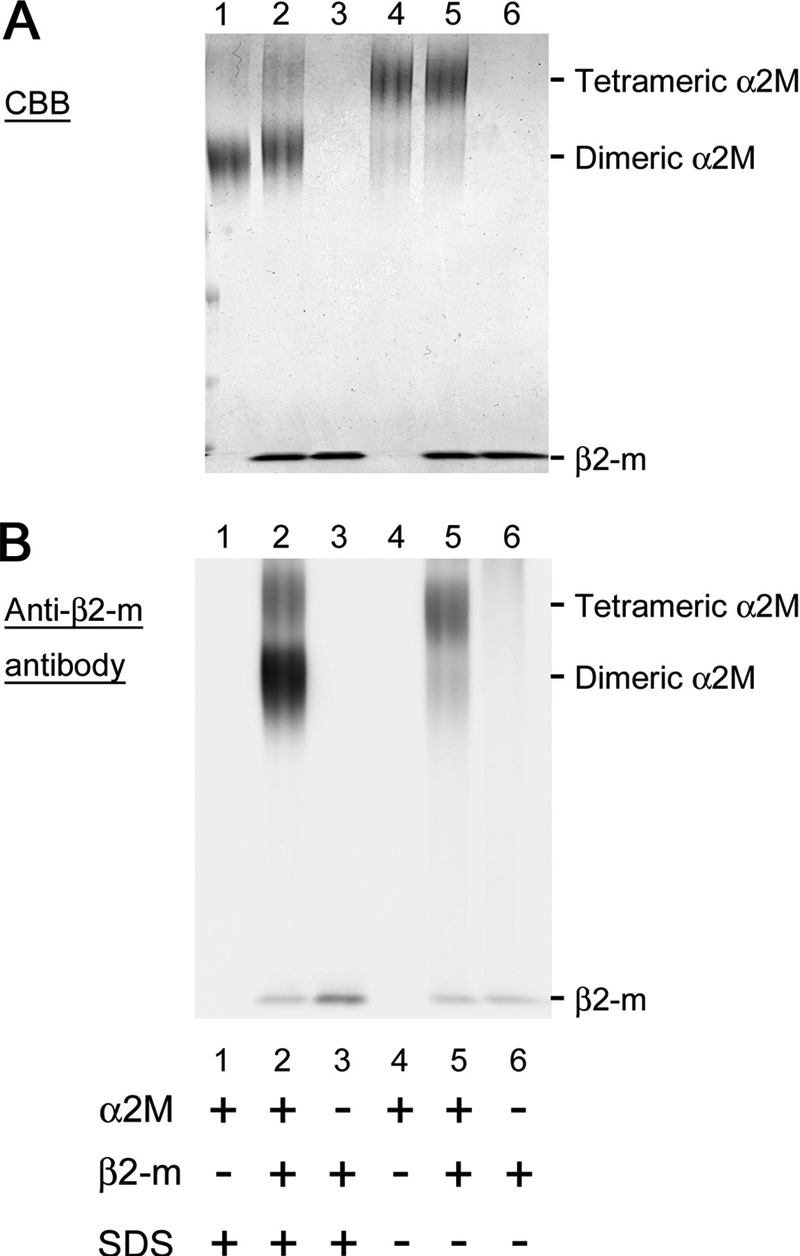
Interaction of tetrameric and dimeric α2M with β2-m as demonstrated by SDS-PAGE (A) and Western blot analysis (B). After α2M was incubated with β2-m for 1 h in the absence or presence of SDS, BS3 cross-linking reagent was added to the mixture, then SDS-PAGE was performed (A, Coomassie Brilliant Blue (CBB) staining). In Western blot analysis (B) performed in parallel, bound β2-m was detected with horseradish peroxidase-conjugated anti-human β2-m antibody followed by enhanced chemiluminescence.
Effect of α2M on Seed-dependent Growth of β2-m Amyloid Fibrils at an Acidic pH in the Presence of Heparin
To analyze the interaction of α2M with β2-m in other physiologically relevant in vitro conditions (30, 31), we next examined the effect of α2M on seed-dependent growth of β2-m amyloid fibrils at an acidic pH in the presence of heparin. When β2-m monomers were incubated with seeds at pH 6.3 in the presence of 100 μg/ml heparin and with agitation, seed-dependent growth was observed (Fig. 6, A and B). However, when incubated with α2M, this reaction was inhibited during a 45-h incubation (Fig. 6, A and C). As shown in SDS-PAGE (Fig. 6D) and Western blot analysis (Fig. 6E), a small proportion of tetrameric α2M was dissociated into dimers, and both tetramers and dimers harbored β2-m at pH 6.3 in the presence of heparin. As shown in Fig. 7A, pH-dependent dissociation of tetrameric α2M into dimers was observed in the absence of heparin. Moreover, both tetramers and dimers harbored more β2-m according to the reduction in pH (Fig. 7B).
FIGURE 6.

Effect of α2M on seed-dependent growth of β2-m amyloid fibrils at an acidic pH in the presence of heparin. A, time course of fibril growth monitored by ThT fluorescence in the absence (black) or presence (red) of 1:20 α2M. Each point represents the average of three ThT measurements from the same sample. S.D. was <5% of each average value. This is a representative pattern of three independent experiments. B and C, electron microscopy images of the samples of seed-dependent growth reaction. The sample prepared in the absence (B) or presence (C) of 1:20 α2M was incubated at 37 °C for 45 h. Scale bars, 1 μm. D and E, interaction of α2M with β2-m. After α2M was incubated with β2-m for 1 h at pH 6.3 in the presence of 100 μg/ml heparin, BS3 cross-linking reagent was added to the mixture, then SDS-PAGE (D) and Western blot analysis (E) were performed.
FIGURE 7.
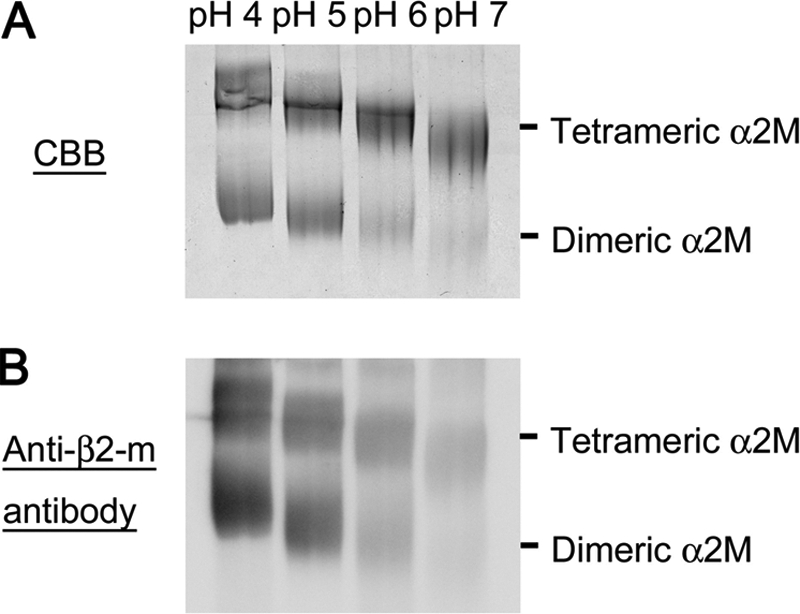
pH-dependent dissociation of α2M and interaction with β2-m. After α2M was incubated with β2-m for 1h at pH 4–7 in the absence of heparin, BS3 cross-linking reagent was added to the mixture, then SDS-PAGE (A) and Western blot analysis (B) were performed.
DISCUSSION
In the mechanism of amyloidogenesis from natively folded proteins such as β2-m and transthyretin, their partial unfolding is believed to be a prerequisite for their assembly into amyloid fibrils both in vitro and in vivo (32). We propose a model of the interaction of α2M with β2-m under normal and amyloidogenic denaturing conditions (e.g. SDS, lipids, low pH) (Fig. 8). Under normal conditions, because the hydrophobic surfaces of both α2M and β2-m are not exposed, tetrameric native α2M interacts weakly with native β2-m (Fig. 8A). Under amyloidogenic denaturing conditions, tetrameric α2M is partly converted to dimeric form (Figs. 4–7). β2-m is also partially unfolded, and this β2-m conformer may weakly and reversibly aggregate into small oligomers via hydrophobic interactions (11, 26). Because the surface hydrophobicity of dimeric α2M is clearly higher than that of tetrameric α2M (Fig. 4) (29), dimeric α2M can strongly interact with denatured monomeric/oligomeric β2-m with exposed hydrophobic surfaces (Fig. 8B). This scenario is consistent with the finding that the binding affinity between α2M and β2-m in the presence of SDS is higher than that in the absence of SDS (Fig. 2 and supplemental Fig. S4). At the same time, Figs. 5–7 indicate that tetrameric α2M may also interact with denatured monomeric/oligomeric β2-m, suggesting that the effect of tetrameric α2M on β2-m fibrillogenesis is not a minor one. Under amyloidogenic denaturing conditions, tetrameric α2M may also be partially denatured, inducing the exposure of the hydrophobic surfaces without dissociating into dimers.
FIGURE 8.

Schematic model of the denaturation-driven interaction of α2M with β2-m. A, under normal conditions, tetrameric native α2M may interact weakly with native β2-m. B, under amyloidogenic denaturing conditions (e.g. SDS, lipids, low pH), tetrameric α2M is partly converted to dimeric form. β2-m is also partially unfolded, and this β2-m conformer may weakly and reversibly aggregate into small oligomers. Because the surface hydrophobicity of dimeric α2M is clearly higher than that of tetrameric α2M, dimeric α2M can strongly interact with denatured monomeric/oligomeric β2-m with exposed hydrophobic surfaces. Tetrameric α2M may also interact with denatured monomeric/oligomeric β2-m. By binding to the denatured monomeric/oligomeric β2-m, α2M may inhibit the formation of β2-m amyloid fibrils.
Gouin-Charnet et al. (24) reported that several peptides from the β2-m sequence (e.g. Phe30-Asp38, Val49-Trp60, and Leu64-Thr73) bind to α2M and suggested that the α2M binding sites are buried in the native form of β2-m complexed with the heavy chain of the class I major histocompatibility complex, and β2-m released from the complex binds to α2M. Interestingly, these binding sites, especially Phe30-Asp38 and Leu64-Thr73, are hydrophobic regions (33). Our data suggested that under conditions where native β2-m is denatured, tetrameric α2M may also be converted to a dimeric form with exposed hydrophobic surfaces to favor the hydrophobic interaction with denatured β2-m, thus dimeric α2M as well as tetrameric α2M may interact with denatured β2-m. Based on this scenario, we attempted to identify the binding sites for α2M in the SDS-denatured β2-m molecule by NMR experiments (supplemental Fig. S4). However, when 15N-labeled β2-m was titrated with increasing concentrations of α2M, the intensities of all peaks in 1H-15N HSQC spectra decreased simultaneously. Because α2M is thought to bind to a variety of proteins via hydrophobic interactions (14, 16), the result suggests that α2M interacts with the broad hydrophobic surfaces of SDS-denatured β2-m rather than the specific region of β2-m. Alternatively, as α2M is much larger than β2-m (360 kDa as a dimer versus 12 kDa), α2M·β2-m complex formation makes the tumbling of the β2-m molecule much slower, leading to the simultaneous decreases in peak intensities of bound β2-m. More elaborate NMR studies are essential to identify the specific region of β2-m to interact with α2M.
Amyloid deposits, including those found in Alzheimer disease and DRA, contain not only major components of amyloid fibrils but also many other amyloid associated molecules, e.g. glycosaminoglycans, apolipoproteins, and glycoproteins (4), suggesting that these molecules affect the deposition of amyloid fibrils. α2M was found in amyloid deposits from patients with DRA (22). Moreover, the complex of α2M with β2-m was detected in serum obtained from the patients (23). These data suggested that α2M favors the formation of β2-m amyloid fibrils by modifying the degradation process of β2-m. On the other hand, recent studies have shown that α2M inhibits the amyloid fibril formation of amyloid β peptide, calcitonin, and lysozyme (16). The amorphous aggregation of proteins with no connections with amyloid diseases is also prevented by α2M (14). These results suggest that α2M can protect a variety of proteins from the formation of insoluble aggregates.
In the current study, we showed that α2M inhibits both seed-dependent growth of β2-m amyloid fibrils (Figs. 1 and 6) and amyloid fibril formation from β2-m monomer (Fig. 3). The growth and de novo formation of the fibrils were almost completely inhibited even at a 1:20 molar ratio of α2M to β2-m, suggesting that α2M interacts with one or more β2-m molecules. The dot-blot assay revealed the interaction of α2M with β2-m adopting a broad range of conformational states, including the native state, SDS-denatured state, and amyloid fibrils (Fig. 2). In the presence of SDS, β2-m exists as denatured monomers and oligomers (11, 26). We confirmed that under the conditions used here, SDS-denatured β2-m partly aggregated into small oligomers composed of 2–4 molecules (supplemental Fig. S3). Thus, α2M may interact not only with monomers but also with oligomers (Fig. 8B). In fact, Yerbury et al. (17) reported that α2M interacts with prefibrillar species to maintain the solubility of amyloidgenic proteins. These findings suggest that α2M plays an important role in controlling the amyloid fibril formation of β2-m by binding to denatured monomeric/oligomeric β2-m. In addition, it has been reported that α2M protects cells from the toxicity of amyloid β peptide and promotes the uptake of amyloid β peptide in macrophage-like cells (34), suggesting that α2M and other extracellular chaperones are important elements of a system of extracellular protein folding quality control that protects against the toxicity and accumulation of amyloid β peptide. When the efficient protein quality control machinery of α2M and other extracellular chaperones is overwhelmed, the denatured β2-m and other amyloidogenic proteins may form extracellular amyloid deposits in vivo (12, 16). Although α2M interacted with the amyloid fibrils (Fig. 2A), this complex may be too huge to be removed from the extracellular space via receptor-mediated endocytosis and lysosomal degradation, leading to the co-deposition of α2M with amyloid fibrils in vivo (22).
Mettenburg et al. (35) reported that a chemically stabilized preparation of human α2M conformational intermediates binds to natively unfolded amyloid β peptides more strongly than native α2M. Interestingly, Haslbeck et al. (36) reported that under conditions of heat stress, oligomeric small heat shock proteins display structural changes with increased surface hydrophobicity and exhibit increased chaperone activity by complexing a variety of nonnative proteins. Moreover, Poon et al. (37) showed that the chaperone action of clusterin is enhanced as clusterin oligomer is dissociated at mildly acidic pH. These indicate that the conformational change of α2M may be critical to bind to denatured proteins. Although the proteolytic cleavage in the “bait region” of α2M could prime the conformational changes that by modifying the dimer-dimer interaction would enhance the interaction with unfolded/misfolded proteins, the chaperone activity of α2M was reported to be abolished in the conformational change induced by trypsin (14).
α2M exists as a tetramer in human plasma and cerebrospinal fluid (13). On the other hand, tetrameric α2M can be dissociated into dimers in vitro by denaturants (38, 39), oxidative modification (40), or low pH (41, 42). We also showed that dimeric α2M is formed by 0.5 mm SDS (Figs. 4 and 5) or at low pH (Fig. 7). Similar to tetrameric α2M, dimeric α2M retains the ability to bind proteases (38, 42). Interestingly, the receptor binding domain of dimeric α2M for receptor-mediated endocytosis is exposed irrespective of the conformational change induced by the trapping of proteases (43).
In the tenosynovial tissues of DRA patients, infiltrating macrophages into β2-m amyloid deposits cause local inflammation, resulting in tissue destruction and further amyloid deposition (44). At sites of inflammation, factors such as elevated temperature, reactive oxygen species, and lowered pH may cause damage to extracellular proteins, inducing them to partially unfold (14). α2M expression is increased in response to inflammation (45), and at localized inflammatory sites, the local pH is known to fall to <6 (46–50). This raises the possibility that α2M may respond to unfolded/misfolded proteins in acidic environments at inflammatory sites. In fact, pH-dependent dissociation of tetrameric α2M into dimers was observed (Fig. 7A) and both tetramers and dimers interacted with more β2-m according to the reduction in pH (Fig. 7B). This pH-dependent dissociation of α2M and enhancement of the chaperone activity are similar to those of clusterin (37). However, these extracellular chaperones could not prevent the progression of β2-m amyloid deposition in vivo because the efficient protein quality control machinery of extracellular chaperones might be overwhelmed in the inflammatory environments.
We cannot rule out the possibility that the stronger binding efficiency of α2M dimers may not actually show up in vivo simply because only the small amounts of dimers are present. Thus, future studies are essential to examine whether tetrameric α2M is converted to dimeric form and tetrameric/dimeric α2M interact with unfolded/misfolded proteins in vivo in the extracellular environment where native proteins are denatured.
In conclusion, we revealed that α2M inhibits the formation of β2-m amyloid fibrils. Moreover, we demonstrated that tetrameric and dimeric α2M interact with denatured β2-m. These results suggest that α2M plays an important role in controlling the abnormal aggregation of unfolded proteins in the extracellular space. Further understanding of the function of α2M may help the development of the therapeutics and prophylaxis of DRA and other protein deposition diseases.
Supplementary Material
Acknowledgments
We thank M. Sakai for performing analytical ultracentrifugation, H. Okada and R. Nomura for excellent technical assistance, and T. Ban for helpful discussion.
This work was supported in part by grants-in-aid for scientific research (B) (H. N.), scientific research on priority area “protein community” (H. N.), and scientific research (C) (K. H.) from the Ministry of Education, Culture, Sports, Science, and Technology, Japan, and for research on specific diseases (H. N.) from the Ministry of Health, Labour and Welfare, Japan.

The on-line version of this article (available at http://www.jbc.org) contains supplemental Figs. S1–S5, Methods, and an additional reference.
- DRA
- dialysis-related amyloidosis
- α2M
- α2-macroglobulin
- ANS
- 8-anilino-1-naphthalenesulfonate
- β2-m
- β2-microglobulin
- BS3
- bis(sulfosuccinimidyl) suberate
- Hp
- haptoglobin
- HSQC
- heteronuclear single-quantum coherence
- ThT
- thioflavin T.
REFERENCES
- 1. Chiti F., Dobson C. M. (2009) Nat. Chem. Biol. 5, 15–22 [DOI] [PubMed] [Google Scholar]
- 2. Gejyo F., Yamada T., Odani S., Nakagawa Y., Arakawa M., Kunitomo T., Kataoka H., Suzuki M., Hirasawa Y., Shirahama T., Cohen A. S., Schmid K. (1985) Biochem. Biophys. Res. Commun. 129, 701–706 [DOI] [PubMed] [Google Scholar]
- 3. Corazza A., Rennella E., Schanda P., Mimmi M. C., Cutuil T., Raimondi S., Giorgetti S., Fogolari F., Viglino P., Frydman L., Gal M., Bellotti V., Brutscher B., Esposito G. (2010) J. Biol. Chem. 285, 5827–5835 [DOI] [PMC free article] [PubMed] [Google Scholar]
- 4. Heegaard N. H. (2009) Amyloid 16, 151–173 [DOI] [PubMed] [Google Scholar]
- 5. Calabrese M. F., Miranker A. D. (2007) J. Mol. Biol. 367, 1–7 [DOI] [PubMed] [Google Scholar]
- 6. Hasegawa K., Tsutsumi-Yasuhara S., Ookoshi T., Ohhashi Y., Kimura H., Takahashi N., Yoshida H., Miyazaki R., Goto Y., Naiki H. (2008) Biochem. J. 416, 307–315 [DOI] [PubMed] [Google Scholar]
- 7. Jahn T. R., Parker M. J., Homans S. W., Radford S. E. (2006) Nat. Struct. Mol. Biol. 13, 195–201 [DOI] [PubMed] [Google Scholar]
- 8. Ookoshi T., Hasegawa K., Ohhashi Y., Kimura H., Takahashi N., Yoshida H., Miyazaki R., Goto Y., Naiki H. (2008) Nephrol. Dial. Transplant. 23, 3247–3255 [DOI] [PubMed] [Google Scholar]
- 9. Relini A., Canale C., De Stefano S., Rolandi R., Giorgetti S., Stoppini M., Rossi A., Fogolari F., Corazza A., Esposito G., Gliozzi A., Bellotti V. (2006) J. Biol. Chem. 281, 16521–16529 [DOI] [PubMed] [Google Scholar]
- 10. Sasahara K., Yagi H., Sakai M., Naiki H., Goto Y. (2008) Biochemistry 47, 2650–2660 [DOI] [PubMed] [Google Scholar]
- 11. Yamamoto S., Hasegawa K., Yamaguchi I., Tsutsumi S., Kardos J., Goto Y., Gejyo F., Naiki H. (2004) Biochemistry 43, 11075–11082 [DOI] [PubMed] [Google Scholar]
- 12. Naiki H., Nagai Y. (2009) J. Biochem. 146, 751–756 [DOI] [PubMed] [Google Scholar]
- 13. Wilson M. R., Yerbury J. J., Poon S. (2008) Mol. Biosyst. 4, 42–52 [DOI] [PubMed] [Google Scholar]
- 14. French K., Yerbury J. J., Wilson M. R. (2008) Biochemistry 47, 1176–1185 [DOI] [PubMed] [Google Scholar]
- 15. Kumita J. R., Poon S., Caddy G. L., Hagan C. L., Dumoulin M., Yerbury J. J., Stewart E. M., Robinson C. V., Wilson M. R., Dobson C. M. (2007) J. Mol. Biol. 369, 157–167 [DOI] [PubMed] [Google Scholar]
- 16. Wyatt A. R., Wilson M. R. (2010) J. Biol. Chem. 285, 3532–3539 [DOI] [PMC free article] [PubMed] [Google Scholar]
- 17. Yerbury J. J., Kumita J. R., Meehan S., Dobson C. M., Wilson M. R. (2009) J. Biol. Chem. 284, 4246–4254 [DOI] [PubMed] [Google Scholar]
- 18. Yerbury J. J., Poon S., Meehan S., Thompson B., Kumita J. R., Dobson C. M., Wilson M. R. (2007) FASEB J. 21, 2312–2322 [DOI] [PubMed] [Google Scholar]
- 19. Sottrup-Jensen L. (1989) J. Biol. Chem. 264, 11539–11542 [PubMed] [Google Scholar]
- 20. Feldman S. R., Gonias S. L., Pizzo S. V. (1985) Proc. Natl. Acad. Sci. U.S.A. 82, 5700–5704 [DOI] [PMC free article] [PubMed] [Google Scholar]
- 21. Kolodziej S. J., Wagenknecht T., Strickland D. K., Stoops J. K. (2002) J. Biol. Chem. 277, 28031–28037 [DOI] [PubMed] [Google Scholar]
- 22. Argiles A., Mourad G., Axelrud-Cavadore C., Watrin A., Mion C., Cavadore J. C. (1989) Clin. Sci. 76, 547–552 [DOI] [PubMed] [Google Scholar]
- 23. Motomiya Y., Ando Y., Haraoka K., Sun X., Iwamoto H., Uchimura T., Maruyama I. (2003) Kidney Int. 64, 2244–2252 [DOI] [PubMed] [Google Scholar]
- 24. Gouin-Charnet A., Laune D., Granier C., Mani J. C., Pau B., Mourad G., Argilés A. (2000) Clin. Sci. 98, 427–433 [PubMed] [Google Scholar]
- 25. Chiba T., Hagihara Y., Higurashi T., Hasegawa K., Naiki H., Goto Y. (2003) J. Biol. Chem. 278, 47016–47024 [DOI] [PubMed] [Google Scholar]
- 26. Kihara M., Chatani E., Sakai M., Hasegawa K., Naiki H., Goto Y. (2005) J. Biol. Chem. 280, 12012–12018 [DOI] [PubMed] [Google Scholar]
- 27. Naiki H., Gejyo F., Nakakuki K. (1997) Biochemistry 36, 6243–6250 [DOI] [PubMed] [Google Scholar]
- 28. Wyatt A. R., Yerbury J. J., Wilson M. R. (2009) J. Biol. Chem. 284, 21920–21927 [DOI] [PMC free article] [PubMed] [Google Scholar]
- 29. Jensen P. E., Hägglöf E. M., Arbelaez L. F., Stigbrand T., Shanbhag V. P. (1993) Biochim. Biophys. Acta 1164, 152–158 [DOI] [PubMed] [Google Scholar]
- 30. Relini A., De Stefano S., Torrassa S., Cavalleri O., Rolandi R., Gliozzi A., Giorgetti S., Raimondi S., Marchese L., Verga L., Rossi A., Stoppini M., Bellotti V. (2008) J. Biol. Chem. 283, 4912–4920 [DOI] [PubMed] [Google Scholar]
- 31. Myers S. L., Jones S., Jahn T. R., Morten I. J., Tennent G. A., Hewitt E. W., Radford S. E. (2006) Biochemistry 45, 2311–2321 [DOI] [PubMed] [Google Scholar]
- 32. Kelly J. W. (1998) Curr. Opin. Struct. Biol. 8, 101–106 [DOI] [PubMed] [Google Scholar]
- 33. Platt G. W., Routledge K. E., Homans S. W., Radford S. E. (2008) J. Mol. Biol. 378, 251–263 [DOI] [PMC free article] [PubMed] [Google Scholar]
- 34. Yerbury J. J., Wilson M. R. (2010) Cell Stress Chaperones 15, 115–121 [DOI] [PMC free article] [PubMed] [Google Scholar]
- 35. Mettenburg J. M., Arandjelovic S., Gonias S. L. (2005) J. Neurochem. 93, 53–62 [DOI] [PubMed] [Google Scholar]
- 36. Haslbeck M., Kastenmüller A., Buchner J., Weinkauf S., Braun N. (2008) J. Mol. Biol. 378, 362–374 [DOI] [PubMed] [Google Scholar]
- 37. Poon S., Rybchyn M. S., Easterbrook-Smith S. B., Carver J. A., Pankhurst G. J., Wilson M. R. (2002) J. Biol. Chem. 277, 39532–39540 [DOI] [PubMed] [Google Scholar]
- 38. Liu D., Feinman R. D., Wang D. (1987) Biochemistry 26, 5221–5226 [DOI] [PubMed] [Google Scholar]
- 39. Sjöberg B., Pap S., Kjems J. (1987) Eur. J. Biochem. 162, 259–264 [DOI] [PubMed] [Google Scholar]
- 40. Reddy V. Y., Desorchers P. E., Pizzo S. V., Gonias S. L., Sahakian J. A., Levine R. L., Weiss S. J. (1994) J. Biol. Chem. 269, 4683–4691 [PubMed] [Google Scholar]
- 41. Pap S., Sjöberg B., Mortensen K. (1990) Eur. J. Biochem. 191, 41–45 [DOI] [PubMed] [Google Scholar]
- 42. Pochon F., Barray M., Delain E. (1989) Biochim. Biophys. Acta 996, 132–138 [DOI] [PubMed] [Google Scholar]
- 43. Shanbhag V. P., Stigbrand T., Jensen P. E. (1997) Eur. J. Biochem. 244, 694–699 [DOI] [PubMed] [Google Scholar]
- 44. Kazama J. J., Yamamoto S., Takahashi N., Ito Y., Maruyama H., Narita I., Gejyo F. (2006) J. Bone Miner. Metab. 24, 182–184 [DOI] [PubMed] [Google Scholar]
- 45. Okubo H., Ishibashi H., Shibata K., Tsuda-Kawamura K., Yanase T. (1984) Inflammation 8, 171–179 [DOI] [PubMed] [Google Scholar]
- 46. Lardner A. (2001) J. Leukocyte Biol. 69, 522–530 [PubMed] [Google Scholar]
- 47. Leake D. S. (1997) Atherosclerosis 129, 149–157 [DOI] [PubMed] [Google Scholar]
- 48. Jacobus W. E., Taylor G. J., 4th, Hollis D. P., Nunnally R. L. (1977) Nature 265, 756–758 [DOI] [PubMed] [Google Scholar]
- 49. Punnia-Moorthy A. (1987) J. Oral Pathol. 16, 36–44 [DOI] [PubMed] [Google Scholar]
- 50. Yates C. M., Butterworth J., Tennant M. C., Gordon A. (1990) J. Neurochem. 55, 1624–1630 [DOI] [PubMed] [Google Scholar]
Associated Data
This section collects any data citations, data availability statements, or supplementary materials included in this article.