Abstract
Background
Human class I alcohol dehydrogenase 2 isoenzymes (encoded by the ADH1B locus) have large differences in kinetic properties; however, individuals inheriting the alleles for the different isoenzymes exhibit only small differences in alcohol elimination rates. This suggests that other cellular factors must regulate the activity of the isoenzymes.
Methods
The activity of the isoenzymes expressed from ADH1B*1, ADH1B*2, and ADH1B*3 cDNAs was examined in stably transduced HeLa cell lines, including lines which expressed human low Km aldehyde dehydrogenase (ALDH2). The ability of the cells to metabolize ethanol was compared with that of HeLa cells expressing rat class I ADH (HeLa-rat ADH cells), rat hepatoma (H4IIEC3) cells, and rat hepatocytes.
Results
The isoenzymes had similar protein half-lives in the HeLa cells. Rat hepatocytes, H4IIEC3 cells, and HeLa-rat ADH cells oxidized ethanol much faster than the cells expressing the ADH1B isoenzymes. This was not explained by high cellular NADH levels or endogenous inhibitors; but rather because the activity of the β1 and β2 ADHs were constrained by the accumulation of acetaldehyde, as shown by the increased rate of ethanol oxidation by cell lines expressing β2 ADH plus ALDH2.
Conclusion
The activity of the human β2 ADH isoenzyme is sensitive to inhibition by acetaldehyde, which likely limits its activity in vivo. This study emphasizes the importance of maintaining a low steady–state acetaldehyde concentration in hepatocytes during ethanol metabolism.
Keywords: ethanol elimination, product inhibition, acetaldehyde, protein half-life, enzyme kinetics
Introduction
The hepatic metabolism of ethanol is mainly carried out by alcohol and aldehyde dehydrogenases, producing acetate for further oxidation or release from the liver. ADHs are dimeric enzymes expressed from several genetic loci, ADH1-ADH7, and are most highly expressed in the liver. The ADH1B locus is polymorphic with three alleles commonly observed among human populations. ADH1B*1, ADH1B*2, and ADH1B*3 alleles encode β1, β2, and β3 enzymes, respectively, which have very large differences in kinetic properties (Bosron and Li, 1986, 1987; Ehrig et al., 1990). β2 ADH has a high maximal velocity (Vmax) and low Michaelis constant (Km) for ethanol relative to β1 ADH, while β3 ADH has both high Km and Vmax. β1 ADH is found in all populations, while β2 is found predominantly in Asians, with lower allele frequency in Israelis and Europeans. The β3 allele is found in African populations and some southwestern native American populations. Acetaldehyde produced by the ADHs is disposed of by aldehyde dehydrogenases (ALDHs). They are expressed in a wider range of tissues than are the ADH isozymes, and consist of class 1 (low Km, cytosolic), class 2 (low Km, mitochondrial), and class 3 (high Km) isoenzymes based upon their kinetic properties and sequence similarities. Only the class 1 and 2 enzymes are predicted to participate in the removal of acetaldehyde generated from ethanol, with ALDH2 the predominant enzyme owing to its very low Km for acetaldehyde (< 1 μM).
The isoenzymes encoded by ADH1B are of substantial biomedical interest, representing some of the best established biological factors that affect responses to alcohol. Inheritance of the β2 enzyme provides a significant degree of protection from the risk of alcoholism in Asians (Mizoi et al., 1994) and Israelis (Hasin et al., 2002), and may contribute to the risk of alcoholic liver disease in individuals who drink heavily. Inheritance of ADH1B*2 and ADH1B*3 alleles have been associated with differential risk of fetal alcohol syndrome (reviewed in Crabb et al., 2004). The biological effects of inheriting different ADH1B alleles are predicted to be due to higher rates of ethanol oxidation by the high Vmax β2 and β3 isoenzymes. In particular, the presence of these more active isoenzymes is postulated to explain part of the wide between-individual variation in alcohol metabolic rates. However, individuals with ADH1B*2 and ADH1B*3 alleles have at most 10-15% higher rates of ethanol elimination compared with those with the ADH1B*1 genotype (Neumark et al., 2004; Thomasson et al., 1995).
Mitochondrial ALDH2 plays the major role in disposal of acetaldehyde generated during ethanol metabolism, as demonstrated by the marked increase in blood acetaldehyde and flushing that occurs in individuals with genetic deficiency of ALDH2 (resulting from the dominant negative effect of the ALDH2*2 allele) who consume ethanol (Enomoto et al., 1991). Individuals with ALDH2 deficiency have somewhat slowed elimination of ethanol, as judged by an increased in the area under the blood ethanol concentration curve after receiving a dose of ethanol (Luu et al., 1995). This has been attributed to product inhibition of ADHs by acetaldehyde. A second, smaller study was unable to detect a difference in ethanol elimination rates between ALDH2-deficient and normal individuals (Wall et al., 1997); however, the latter study did not control for variation at the ADH1B loci, nor did it analyze the area under the blood ethanol concentration curve.
Other factors besides the Vmax and Km for ethanol are likely to be important in determining the in situ activity of the human β ADH isozymes. First, the different isozymes might have different stability in the cells, owing perhaps to their different affinity for cofactors. Were the high activity isozyme proteins less stable and thus expressed as lower steady state levels than the lower activity forms, they would contribute less to the overall activity of ADH in the liver. Second, earlier studies from this laboratory demonstrated that the rate of ethanol elimination in rats could be accurately predicted from the kinetic rate equation, the steady state concentrations of substrates and products, and the total activity of ADH in the liver (Crabb et al., 1983). This requires determination of levels of the nucleotide cofactors and the product acetaldehyde in cells metabolizing ethanol.
Since there are no human liver cell lines expressing individual ADH isozymes and detailed studies of intrahepatic product and substrate concentrations are virtually impossible to carry out in human subjects, alternative experimental models are desirable. The ability of HeLa cells expressing rat ADH to metabolize ethanol, generate a high lactate/pyruvate ratio in the culture medium, and accumulate triacylglycerol was reported previously (Galli et al., 1999). We therefore extended this model by creating HeLa cells expressing human β1, β2, and β3 ADHs, with and without ALDH2. These cells were used to determine the stability of the enzyme proteins, to determine the rate of ethanol oxidation by the cells, and to fit these rates to the steady-state kinetic equation for each isoenzyme, using the medium concentration of ethanol and acetaldehyde, and estimated intracellular concentration of NAD+ and NADH. These studies demonstrate that the intracellular acetaldehyde concentration played a major role in determining the overall flux through this pathway, particularly for the β2 ADH isoenzyme.
MATERIALS AND METHODS
Materials and Cell Culture
Most chemicals and supplies were purchased from Sigma-Aldrich Chemical Corp. (St. Louis, MO). Tissue culture reagents and G418 were purchased from GIBCO/BRL (Gaithersburg, MD). Hygromycin B was from Invitrogen (Carlsbad, CA). HeLa and H4IIEC3 cells (American Type Culture Collection) were grown in minimum essential medium supplemented with 5% fetal bovine serum, 63 μg/ml penicillin, and 100 μg/ml streptomycin. PA317 packaging cells were grown in Dulbecco’s modified Eagle medium supplemented with 10% fetal bovine serum, plus penicillin and streptomycin. Primary hepatocyte suspensions were isolated from male Sprague-Dawley rats (Harlan, Indianapolis, IN) as previously described (You et al., 2002). The animal use protocol was approved by the Indiana University School of Medicine Animal Care and Use Committee and the Veterans Affairs Animal Use Subcommittee.
Generation of HeLa Cells Expressing ADHs and ALDH2
Rat and human β1, β2, and β3 ADH cDNAs (kindly provided by Dr. Howard Edenberg, Indiana University) were cloned into pLNCX, a retroviral vector expressing the insert from the cytomegalovirus promoter and conferring resistance to G418 (Miller and Rosman, 1989). Human ALDH2 cDNA was cloned into the vector pLHCX, constructed by replacing the G418 resistance gene with the hygromycin resistance gene (Gritz and Davies, 1983). The constructs were confirmed by DNA sequencing. Retroviruses were generated by transfecting the packaging cell line, PA317, with the retroviral plasmids using calcium phosphate precipitation, and were used to transduce HeLa cells (Graham and van der Eb, 1973; Xiao et al., 1995). After selection of G418- or hygromycin-resistant clones, the cells were screened for ADH or ALDH2 expression by Western blotting as described (Crabb et al., 1995), using rabbit anti-serum against recombinant human β ADH (provided by Dr. William Bosron, Indiana University) or purified bovine liver ALDH2 (kindly provided by Dr. Henry Weiner). The ADH antiserum detects each of the human β isozymes, as well as mouse and rat ADH. The filters were developed using the Amersham (Arlington Heights, IL) ECL chemiluminescence kit.
Enzymatic Assays
The cells were harvested by scraping or centrifuging suspension cultures of hepatocytes. The pellet was sonicated in Dulbecco’s phosphate buffered saline containing 0.5 mM dithiothreitol and 0.5% Nonidet P-40. ADH activity was determined in 0.25 M Tris-Cl, pH 7.2, containing 10 mM ethanol and 2 mM NAD+ (for HeLa, rat hepatocyte, H4IIEC3, and Hela cells expressing β1, β2, and rat ADH), or 150 mM ethanol and 15 mM NAD+ (for HeLa cells expressing β3 ADH) at 37° C by monitoring NAD+ reduction (Crabb et al., 1983). ALDH activity was assayed at 25° C in 50 mM sodium pyrophosphate (pH 8.8) containing 100 μM 4-methylpyrazole, 1 mM EDTA, and 2.5 mM NAD+. After determining the blank rate of NAD+ reduction, propionaldehyde was added at 40 μM, and absorbance at 340 nm was monitored to determine low Km activity. Propionaldehyde was then added to 7 mM to determine total ALDH activity. High Km activity was total activity minus low Km activity (Crabb et al., 1995).
All kinetic experiments with ADH were performed in 90 mM potassium phosphate, 40 mM potassium chloride, pH 7.3 at 37° C. This chloride concentration approximates the intracellular concentration, which stimulates enzyme activity. Determinations of inhibition constants (Ki) for acetaldehyde, acetyl-carnitine, and palmitoyl-carnitine were performed with purified human β ADH isozymes (provided by Dr. William Bosron). Enzyme was dialyzed and diluted immediately before each experiment to 50 mU/ml in buffer containing 0.5 mM dithiothreitol. Acetaldehyde solutions were prepared from freshly redistilled acetaldehyde. Lactate and pyruvate were measured enzymatically after heat-treatment of the medium to inactivate lactate dehydrogenase (Lamprecht and Heinz, 1984; Noll, 1984). Pyruvate assays were performed immediately to avoid artifactual losses.
Gas Chromatographic Measurement of Ethanol and Acetaldehyde
Concentrations of ethanol and acetaldehyde were determined using a direct injection method (Tangerman, 1997) onto an HP 6890 gas chromatograph equipped with a flame ionization detector and a 7683 Injector (Hewlett Packard, Wilmington, DE). Most supplies were purchased from Agilent Technologies (Wilmington, DE). The injection port of the chromatograph was installed with a deactivated split (for ethanol) or split-less (for acetaldehyde) glass liner. The conditions were as follows. Column: HP INNOWax, polyethylene glycol, 30 m × 2.5 mm i.d. Carrier gas: He, 30 ml/min; H2, 33 ml/min; air, 400 ml/min. Ethanol detection: column temperature, 100° C for 4.5 minutes; injection port temperature: 250° C, split ratio: 20:1, detector temperature: 275° C. Acetaldehyde detection: column temperature: initial temperature: 60°C for 6 minutes, 25°C/min, final temperature: 120°C for 4 minutes, injection port temperature: 150°C, detector temperature: 180° C. The limit of detection for ethanol and acetaldehyde was about 0.1 mM and 10 μM, respectively. For each sample, the concentrations of ethanol and acetaldehyde were determined in triplicate and the results averaged.
Determination of Ethanol Elimination Rates by Cultured Cells
The cells were grown to confluence or in suspension in an 83 cm2 screw top flask fitted with a rubber serum cap to permit repeated sampling without opening the system. All experiments included controls for non-specific losses of ethanol or formation of acetaldehyde (flasks with no cells or with native HeLa cells). For fitting the rate equations to alcohol disappearance or acetaldehyde appearance rates, corrections were made for this rate of loss of ethanol or accumulation of acetaldehyde. At the end of the experiment, the cells were scraped and an aliquot was used to determine the total ADH activity in the flask.
Determination of NAD+ and NADH Content of HeLa Cells
The cells were trypsinized and resuspended to a final concentration of 6 to 8 mg dry weight/ml. The separation of mitochondrial components from cells was as described (Zuurendonk et al., 1979). One ml of cell suspension was rapidly transferred to a 1.5 ml Eppendorf tube containing 0.3 ml of silicone oil, above 0.1 ml of 21% (w/v) perchloric acid. The silicone oil layer consisted of a 1:1 (v:v) mixture of 550 fluid (Dow Corning, San Jose, CA) and Silicone oil AR 20 (Fluka, Switzerland). The cells were centrifuged at 14,000x g into the perchloric acid. The pellet was resuspended with a glass rod to complete extraction of pyridine nucleotides. Aliquots were diluted with an equal volume of distilled water, neutralized (Tischler et al., 1977a, 1977b), and the NAD+ and NADH contents were determined fluorimetrically (Veech et al., 1970). Cytosolic NAD+ and NADH were estimated from the difference between whole cell and mitochondrial pools.
Determination of ADH Turnover in HeLa Cells
Confluent cell cultures were treated with puromycin (100 μg/ml), and cells were harvested 30 minutes later (zero time), and at 8, 16, 24, 32, and 40 hours for Western blotting. Degradation rates were determined by least-squares fits of the natural logarithm of intensity in the ADH bands plotted against time (Waterlow et al., 1978; Xiao et al., 1996). The effect of ethanol on the stability of β2 ADH was tested by incubating cells expressing this isozyme (and cells expressing both β2 ADH and ALDH2) with ethanol, and harvesting the cells for western blotting after 8 and 24 h of incubation.
Statistical Analyses
Rates of ethanol oxidation were determined by least square fitting of the ethanol concentrations over time, the rates of ADH activity were calculated using the kinetic rate equations and constants for each ADH isozyme, kinetic data were analyzed using GraFit 4, and statistical comparisons among multiple groups were made by one-way ANOVA with post hoc test using Microsoft Excel spreadsheets.
RESULTS
Characterization of ADH- and ALDH2-Expressing HeLa Cells
Although HeLa cells are not a good cellular model for liver cells, they have the advantage of low background expression of either ADH or ALDH2 (Figures 1 and 2), and thus permit manipulation of the specific ADH or ALDH2 isozyme of interest. ADH-expressing HeLa cell clones were generated using retrovirus carrying the human β ADH cDNAs (Figure 1). No ADH protein (lane 2) or activity (Table 1) was detected in parental HeLa cells. Lanes 3 and 4 represented extracts of H4IIEC3 rat hepatoma cells and HeLa-rat ADH cells, respectively, and lanes 5 through 7 represented the clones resulting from transduction with the retroviruses expressing the β ADH isozymes. The relative amount of ADH protein expressed/μg cell protein in the cell lines was similar. The cell lines are hereafter referred to as HeLa-β1, -β2, and -β3 ADH cells, respectively. ADH activity in the HeLa-β ADH cells ranged from 0.46 to 13.2 μmol/min/g protein, compared with 11.1 ± 3.9 in the H4IIEC3 cells, 7.8 ± 1.1 in HeLa-rat ADH cells, and 14.5 ± 0.2 in rat hepatocytes (Table 1). The apparent Michaelis constants for NAD+ and ethanol for enzymes extracted from these cell lines (Table 2) conformed to those published for purified or recombinant β ADH enzymes (Bosron and Li, 1987; Ehrig et al., 1990).
Figure 01.
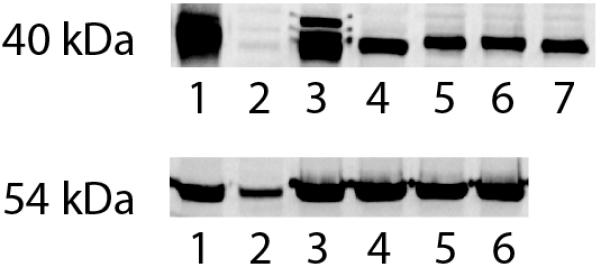
Figure 02.
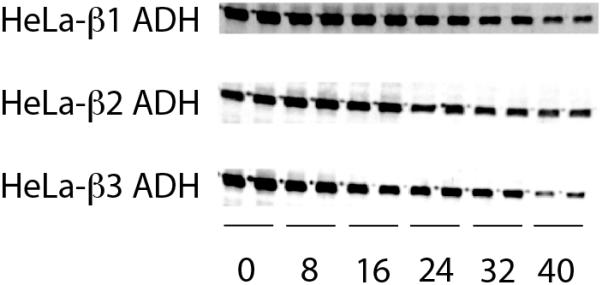
Table 1.
Alcohol Dehydrogenase and Aldehyde Dehydrogenase Activities in Cell Extracts of HeLa Cells Transduced with ADH1B and ALDH2-Expressing Retrovirusesa
| Cell Lines | ADH | ALDH | |
|---|---|---|---|
| Low Km | High Km | ||
| HeLa | N.D | 0.6 ± 0.2 | 2.7 ± 0.6 |
| Rat hepatocyte | 14.5 ± 0.2 | 10.1 ± 0.4 | 33.3 ± 1.0 |
| H4IIEC3 | 11.3 ± 3.9 | 9.3 ± 0.3 | 10.5 ± 2.0 |
| HeLa-rat ADH | 7.8 ± 1.1 | - | - |
| HeLa-β1 ADH | 0.5 ± 0.1 | - | - |
| HeLa-β2 ADH | 4.6 ± 0.6 | - | - |
| HeLa-β3 ADH | 13.2 ± 3.5 | - | - |
| HeLa-β2 ADH +ALDH2 | 7.9 ± 1.0 | 23.7 ± 3.0 | 5.2 ± 2.5 |
| HeLa-β3 ADH +ALDH2 | 21.2 ± 1.4 | 26.9 ± 3.8 | 7.3 ± 1.6 |
The enzyme activities were determined as described in Methods and are reported as the mean ± standard deviation of determinations made on four different plates or suspension cultures of the noted cells. Activities are expressed as μmol/min/g protein in the cell extracts. ALDH activities were not measured in the HeLa ADH cells and are assumed to be the same as in the parent Hela cells.
ND = none detected.
Table 2.
Michaelis Constants for ADH Expressed in HeLa Cells Transduced with ADH 1B-Expressing Retrovirusesa
| Enzyme | |||
|---|---|---|---|
| β1 | β2 | β3 | |
| Km (Ethanol) | |||
| Cell extracts | 0.14 ± 0.07 | 1.00 ± 0.05 | 50.7 ± 0.9 |
| Purified enzyme | 0.05 | 0.94 | 34.0 |
| Km (NAD+) | |||
| Cell extracts | 0.05 ± 0.03 | 0.22 ± 0.02 | 1.42 ± 0.49 |
| Purified enzyme | 0.0074 | 0.18 | 0.53 |
All constants are reported in mM and are the mean ± standard deviation of determinations made on four different extracts of the noted cells. Kinetic constants for the purified enzymes were reported in (Bosron and Li, 1986).
ALDH2-expressing cells were generated from the HeLa β ADH cells using retrovirus carrying human ALDH2 cDNA and a puromycin resistance gene (Figure 1). The parent HeLa cells exhibited an immunoreactive band of the appropriate molecular weight for ALDH2 (approximately 54 kDa). Transduction of the cells with ALDH2 expressing retroviruses resulted in a much more intense band of that molecular weight. Low Km ALDH2 activity in the parent HeLa cells was 0.6 ± 0.2 μmol/min/g protein, while that in the HeLa-β ADH+ALDH2 cells ranged from 23.7 to 26.9 μmol/min/g protein, compared with 9.3 ± 0.3 in the H4IIEC3 cells, and 10.1 ± 0.4 in rat hepatocytes (Table 1). Thus, the low Km ALDH activity in the transduced cells largely represents recombinant human ALDH2. The cell lines represented in lane 3 and 6 were used for subsequent experiments and are referred to as HeLa-β3 ADH+ALDH2 and HeLa-β2 ADH+ALDH2 cells, respectively.
Turnover of β ADH Isozymes in Transduced HeLa Cell Lines
The half-lives of the three ADH isozymes were estimated after treatment of cells with the protein synthesis inhibitor puromycin (Boren et al., 1992) and quantifying the β ADH protein level remaining at subsequent time points in the cells by Western blotting (Figure 2). The estimated half-lives for β1, β2, and β3 ADH were 27 ± 2 (2), 45 ± 16 (2), and 26 ± 7 (4) hours, respectively (n = number of determinations). These half-lives were not statistically different from each other.
Ethanol Oxidation by HeLa Cells Transduced with ADH1B Isozymes
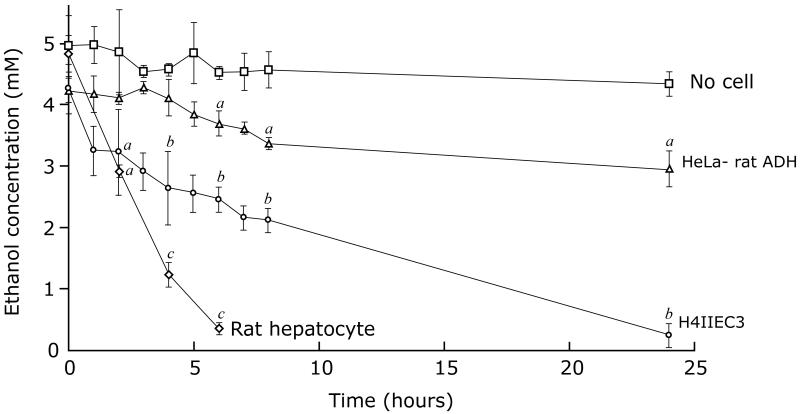
The ability of the cells to oxidize ethanol was tested by culturing them at a density of 1.2 × 10⁷ /per sealed flask. Ethanol was added to the medium at time zero, and the medium was sampled through a serum cap at intervals to measure the concentrations of ethanol and acetaldehyde. Total ADH activity was determined for the scraped cells from each flask at the conclusion of the experiment. Figure 3 shows the ability of rat hepatocytes, H4IIEC3 hepatoma cells, and HeLa-rat ADH cells to oxidize ethanol. The alcohol oxidation rate in the HeLa-rat ADH cells was 0.14 ± 0.03 μmol/h/flask over 24 h. Total ADH activity in the cells was 0.3 μmol/h/flask, indicating that the enzyme was operating at 47% of Vmax. The alcohol oxidation rate by H4IIEC3 cells was 0.56 ± 0.10 μmol/h/flask over 24 h, with a total ADH activity of 1.04 μmol/h/flask, representing enzyme acting at 54% of Vmax. The alcohol oxidation rate by rat hepatocytes was 3.5 ± 0.3 μmol/h/flask and the ADH activity was 6.5 μmol/h/flask, again showing the enzyme was active at 54% of Vmax.
Figure 03.
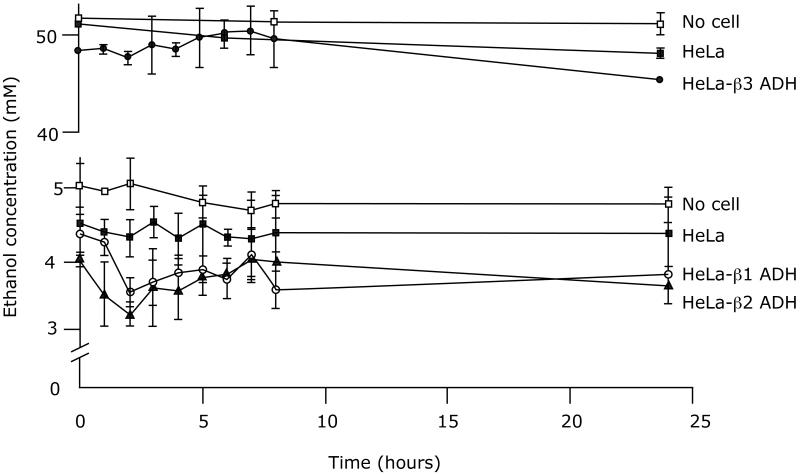
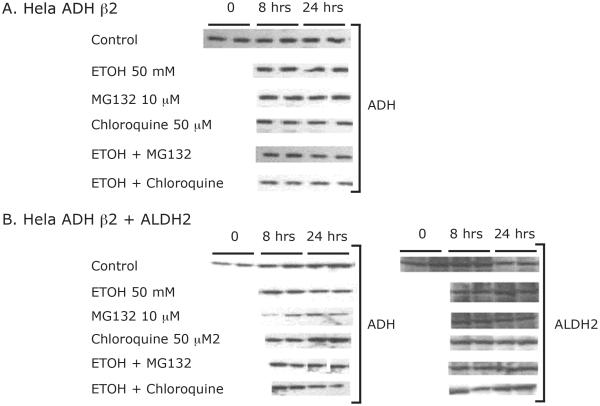
Surprisingly, the rates of ethanol oxidation by the HeLa cells transduced with human ADH1B isozymes were too slow to be accurately determined (Figure 4), even in suspension cultures containing up to 2.5 × 10⁸ cells per flask (not shown). ADH activity of the cultured cells was measured initially and at several time points over the course of the 24 h incubation with ethanol to determine if the activity was stable. The total ADH activities at 8 hours and 24 hours for HeLa-β1, β2, and β3 cells were 63% and 16%, 92 % and 43 %, 34 % and 9 %, respectively, of the initial total ADH activity. This unexpected loss of activity during culture with ethanol would not completely explain the slow ethanol oxidation rate. We then examined whether the loss of activity was due to enzyme degradation), possibly via lysosomal or proteasomal pathways. Cells expressing β2 ADH or β2 ADH + ALDH2 were cultured in the presence of 50 mM ethanol and harvested at 8 and 24 hours for Western blotting. We also tested the effect of the lysosomal proteolysis inhibitor chloroquine and the proteasome inhibitor MG132 on levels of ADH and ALDH2 protein. As shown in Figure 5, the levels of ADH and ALDH2 protein were stable during the 24 hour incubation with ethanol, and there was no effect of the inhibitors on these levels.
Figure 04.
Figure 05.
Another factor that could account for slow ethanol oxidation would be an elevated concentration of cytosolic NADH, reflected by the lactate/pyruvate ratio in the medium. The lactate/pyruvate ratio was considerably higher with HeLa or HeLa-ADH cells than with hepatoma cells or hepatocytes even in the absence of ethanol (Table 3), suggesting a smaller capacity for NADH reoxidation, or a smaller mitochondrial NAD+ pool in HeLa cells. The lactate/pyruvate ratio in the rat hepatocytes or H4IEC3 cells were no increased at the time points samples (6 and 24 hours, respectively, probably because the medium ethanol concentration had fallen below the Km for rat ADH (Figure 3). The total mitochondrial and cytosolic [NAD++NADH] content of HeLa cells to be 555 and 2994 nmol/g dry weight (average of two determinations) respectively, compared with a reported mitochondrial and cytosolic [NAD++NADH] for hepatocytes of 1328 and 1838 nmol/g dry weight (Tischler et al., 1977a). The lactate/pyruvate ratio of the medium at 24 hours was not increased further by culturing the HeLa-ADH cells with ethanol (Table 3), and the rate of ethanol oxidation by HeLa-βADH cells was not increased by the addition of pyruvate (which oxidizes NADH via the lactate dehydrogenase reaction) or methylene blue (which oxidizes NADH by redox cycling) to the medium to lower the lactate/pyruvate ratio (data not shown), suggesting that ethanol oxidation was not solely limited by high levels of NADH. Rat ADH was reported to be inhibited by acetyl-carnitine (Sachan and Cha, 1994), but the inhibition constants for acetyl- and palmitoyl-carnitine were too high to be physiologically relevant: 0.3 ± 0.2, 2.6 ± 1.4, and 19 ± 5 mM, for acetyl-carnitine and 0.2 ± 0.1, 2.8 ± 1.3, and 24 ± 11 mM for palmitoyl-carnitine with β1, β2, and β3 ADH, respectively.
Table 3.
Lactate/Pyruvate Ratios in the Medium of ADH-Expressing Cells during Exposure to Ethanola
| Cell Lines | Without Ethanol | With Ethanol |
|---|---|---|
| Rat hepatocyte | 4.2 ± 1.0 | 6.4 ± 1.4 |
| H4IIEC3 | 5.3 ± 1.9 | 7.6 ± 2.1 |
| HeLa | 20.7 ± 1.4b | 21.9 ± 0.7c |
| HeLa-rat ADH | 30.4 ± 3.5 b | 33.7 ± 0.5 c |
| HeLa-β1 ADH | 22.5 ± 1.5 b | 19.1 ± 0.7 c |
| HeLa-β2 ADH | 26.7 ± 0.9 b | 27.4 ± 3.1 c |
| HeLa-β3 ADH | 25.0 ± 0.4 b | 28.7 ± 2.1 c |
The cells were incubated with or without ethanol, in sealed flasks for 24 hours (6 hours for hepatocytes). At the end of experiment, the medium was collected and assayed for lactate and pyruvate. Lactate/pyruvate ratios are expressed as the mean ± standard deviation. The number of samples analyzed was n = 3 for rat hepatocytes and n = 4 for the others. Initial ethanol concentration was 50 mM for HeLa-β3 ADH cells and 5 mM for the others.
P< 0.001 compared to rat hepatocyte and H4IIEC3 without ethanol.
P< 0.005 compared to rat hepatocyte and H4IIEC3 with ethanol.
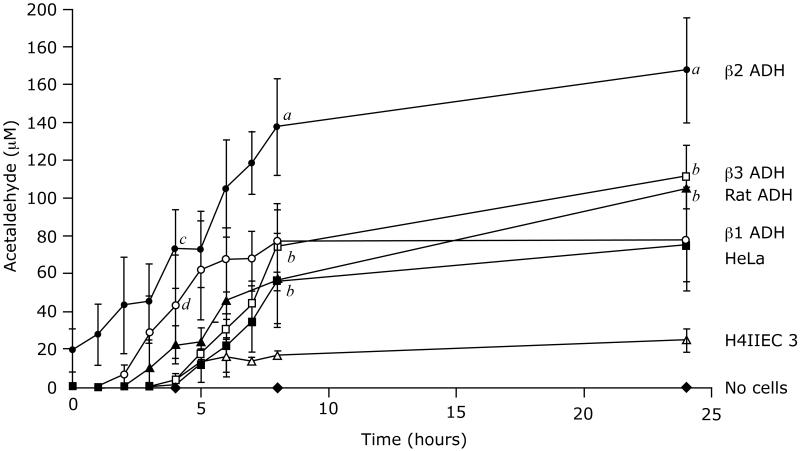
The other compound that could inhibit ethanol oxidation was acetaldehyde (Figure 6). We were surprised that the parental HeLa cells generated acetaldehyde when cultured with ethanol. The cells lacked class I ADH immunoreactive protein (Figure 1) but contained high catalase activity (130 ± 8 mmol/min/g protein). The concentrations of acetaldehyde in the medium at 24 hours after incubating HeLa cells with 5 mM ethanol, ethanol plus the ADH inhibitor 4-methylpyrazole (0.1 mM), and ethanol plus the catalase inhibitor 3-aminotriazole (20 mM) were 75 ± 19, 58 ± 20, and 24 ± 7 μM, respectively. The effect of 4-methylpyrazole was not significant compared with untreated cells (p=0.22), but that of 3-aminotriazole was highly significant (p<0.05); hence, the formation of acetaldehyde in these cells appeared to be mediated predominantly by catalase. H4IIEC3 cells, which express low Km ALDH2 (Crabb et al., 1995), maintained low levels of acetaldehyde. The HeLa β1ADH cells generated acetaldehyde levels over 50 μM within 4 hours, and in the case of the HeLa β2ADH cells, acetaldehyde concentrations exceeded 150 μM by 8 hours (Figure 6).
Figure 06.
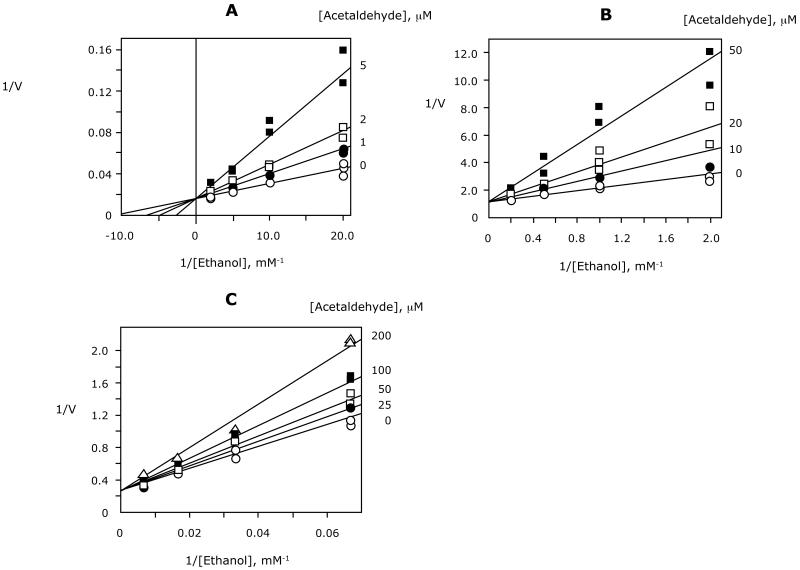
Acetaldehyde could inhibit ADH either as a product inhibitor or by its effect on the equilibrium of the reaction. Because the reported inhibition constants for the human β ADHs were measured using non-physiological buffers (Bosron and Li, 1987), we determined these constants (Kip) in physiological (phosphate) buffers containing chloride, an activator of ADH (Figure 7). As predicted by the ordered Bi-Bi mechanism for ADH, the pattern of inhibition was competitive with ethanol. The inhibition constants for β1, β2, and β3 ADH were 1.5 ± 0.1, 22 ± 14, and 210 ± 5 μM, respectively. The previously reported inhibition constant of acetaldehyde for rat ADH was 12 μM (Crabb et al., 1983), but involving a Theorell-Chance mechanism rather than ordered Bi-Bi. These results suggested that the activity of β1 and β2 ADH could be limited by the accumulation of acetaldehyde at the levels measured with the Hela ADH cells.
Figure 07.
Estimation of in situ ADH Activity using the Kinetic Rate Equation
To correlate ethanol oxidation rates with the activity of ADH derived from the kinetic rate equations for each β ADH isozyme requires an estimate of the cytosolic NAD+ and NADH concentrations. Subtracting the concentration of NADH from the total cytosolic [NAD++NADH] content described above yielded a total NAD+ content of 1547 nmol/g dry weight. Using a value of 2.0 ml cytosol water/g dry weight (derived for liver cells), the estimated total concentration of cytosolic NAD+ was 0.77 mM. Because most of the cytosolic NAD+ is free (Bucher et al., 1972), this is close to the estimated free NAD+ concentration in liver, 0.5 mM.
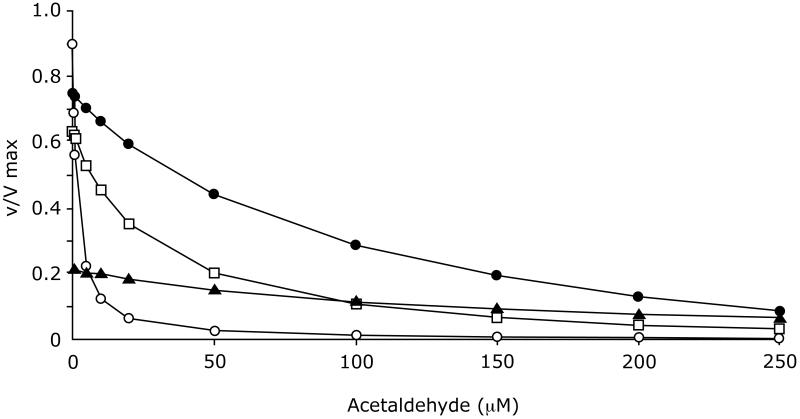
To assess whether the substrate and product concentrations prevailing in the Hela ADH cells regulate ADH activity to a level consistent with the observed rates of ethanol removal from the medium, we modeled the activity of the human β ADH isozymes and rat ADH over increasing concentrations of acetaldehyde (Figure 8). The ethanol concentration was set at 5 mM (or 50 mM in the case of β3 ADH) and NAD+ was set at 0.77 mM. The free NADH concentration was estimated to be approximately 2 μM, based on the free NAD+ concentration and the lactate and pyruvate concentrations ([NAD+]free/[NADH]free = [pyruvate]/([lactate] × Keq) where Keq is the equilibrium constant for LDH (1.11 × 10 at pH 7.4 (Williamson et al., 1967). The activities of the enzymes in the absence of acetaldehyde were calculated to be 90%, 63%, and 22% of Vmax for β1, β2, and β3 ADH, respectively. This was due largely to differences in Km for ethanol. Rat ADH was calculated to be active at 75% of Vmax. At an acetaldehyde concentration of 50 μM, β1 ADH was virtually inactive and β2 ADH was only 20% active. This effect of acetaldehyde was largely due to the increase in the magnitude of the denominator term [A][B][P]/Kip, rather than to the enzyme approaching equilibrium at higher acetaldehyde concentrations. These calculated activities of the enzymes are consistent with the low rate of ethanol oxidation by the HeLa -β1 and -β2 ADH cells. β3 ADH and rat ADH were less sensitive to acetaldehyde; in the presence of 50 μM acetaldehyde, β3 ADH activity was reduced from 22 to 15 % of Vmax, and rat ADH activity was reduced from 75 to 50% of Vmax. This estimate for rat ADH activity is remarkably similar to the activity observed in the three types of cells expressing rat ADH shown (rat hepatocytes, H4IIEC3 cells, and HeLa rat ADH cells, discussed above). The predicted rate for β3 ADH in the presence or absence of acetaldehyde is also consistent with the low rate of ethanol elimination by cells expressing this isoenzyme.
Figure 08.
Ethanol Oxidation by Cells Expressing both Human ADH and ALDH2
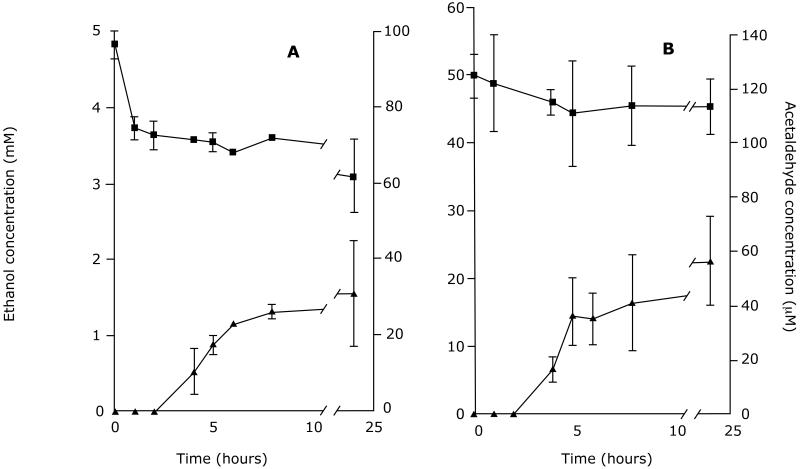
Modeling of the ADH reaction indicated that acetaldehyde was contributing to the slow rate of ethanol disappearance from the medium of the HeLa β2ADH cells, and predicted that ethanol elimination would be more rapid in HeLa β2ADH+ALDH2 cells. As shown in Figure 9, when HeLa βADH+ALDH2 cells were incubated with ethanol at 5 mM, there was a rapid decrease in ethanol in the first hour, followed by a steady state oxidation rate of 0.18 ± 0.04 μmol/h/flask between 1 and 8 hr.. Acetaldehyde was not detectable until the fourth hour, then increased to a near steady state level of 30 μM, much lower than in the cells without ALDH2 (Figure 6). Using the ethanol and acetaldehyde concentrations, plus NAD+ and NADH concentrations estimated from the lactate/pyruvate ratio in the medium (not shown) and the kinetic rate equation, the ethanol oxidation rate was predicted to be 0.15 μmol/h/flask in the steady state phase, similar to the observed rate. When cells expressing β3ADH+ALDH2 were incubated in 50 mM ethanol, there was no faster rate of ethanol oxidation than in cells expressing only β3 ADH. In fact, the rate of ethanol disappearance was the same with HeLa cells, Hela β3 ADH and HeLa β3 ADH+ALDH2 cells (approximately 0.55 μmol/h/flask, compare Figures 4 and 8). However, the medium concentration of acetaldehyde was substantially reduced in the cells expressing both β3 ADH and ALDH2 (compare Figures 6 and 9).
Figure 09.
DISCUSSION
Polymorphisms of ADH and ALDH2 are the strongest and best studied genetic factors influencing the risk of alcoholism. Factors that affect the activity of these enzymes in human liver are of critical biomedical interest, as the behavioral response to alcohol may in part be related to the rate of change in blood alcohol or acetaldehyde concentration. Human liver represents a complicated system for the study of ethanol oxidation: it contains a mixture of α, β, γ, and π ADH, all have differing kinetic properties and possibly expressed at different levels between individuals. It is of particular interest to study the control of β2 ADH activity, as it is many times more active than β1 ADH, and has a low Km relative to usual blood alcohol concentrations. Individuals with β2 ADH have a reduced risk of alcoholism compared to individuals with β1 ADH (Hasin et al., 2002; Mizoi et al., 1994;), yet have only 15% greater rates of ethanol elimination than those with β1 ADH (Neumark et al., 2004). Although the β ADH forms represent only a fraction of the total hepatic ADH activity, it is still surprising that the presence of β2 ADH does not have a more pronounced effect on the elimination rate.
Studies on the in situ activity of human ADHs have been hampered by the lack of a cell model allowing manipulation of the enzyme activity and the concentrations of its substrates and products. By comparing actual rates of ethanol oxidation with rates predicted by kinetic equations, it is possible to quantify the factors which exert control over the enzyme activity; discrepancies between the measured and calculated rates can point to unknown modes of regulation. To provide an accessible system to study the behavior of these enzymes in a cellular milieu, HeLa cells expressing β1, β2 and β3 ADH were created and characterized. We chose to use HeLa as the parental cell line because of very low endogenous ADH and ALDH2 activities. This allowed us to study the rate of ethanol oxidation at widely varying acetaldehyde concentrations, and to vary the NADH/NAD+ ratio by the addition of oxidized or reduced substrates for lactate dehydrogenase (pyruvate or lactate, respectively). They clearly differ from liver cells in having a smaller mitochondrial pyridine nucleotide pool (about one third that of hepatocytes. The isoenzymes were readily expressed in the HeLa cells and exhibited the expected electrophoretic and kinetic properties. Because the isozymes differ markedly in affinity for NAD+ and NADH, and because binding of cofactor may influence protein stability, we determined the half-life of each enzyme in the HeLa cells. The estimates were in the range of 25 to 46 hours, were not significantly different from each other, and may underestimate the half life, since the puromycin decay method is limited in its ability to determine the half-lives of stable proteins because of the cumulative cellular toxicity it induces. By comparison, the half-life of rat ADH was reported to be about 4-5 days, estimated from the rate of synthesis and degradation of total ADH protein after labeling in vivo with radioactive bicarbonate (Bosron et al., 1984). While we were not able to precisely determine the half lives of these isozymes, the data suggest that the β2 and β3 ADHs are not labile in comparison to β1 ADH.
The rate of ethanol oxidation by cells expressing rat ADH (Figure 4) was similar to that estimated from the kinetic rate equation, confirming the validity of this approach to analyzing the factors that regulate ADH activity (Crabb et al., 1983). The low rates of ethanol oxidation by the cells expressing human β ADH (Figure 4) were unexpected. There were three possible explanations: inactivation of the enzyme, inhibition by other compounds present in the cells, or product inhibition by acetaldehyde or NADH. ADH activity declined during the incubation of the cells with ethanol, an effect which was most pronounced for β3 ADH. We examined whether there was loss of β2 ADH or ALDH2 protein during incubation of the cells with ethanol, but the levels of these proteins did not fall during the incubation. This suggests that during ethanol metabolism by the cells, ADH was inactivated but not degraded A potential mechanism would be covalent modification of the enzyme, perhaps at its active site cysteine(s). ADH has not been shown to be modified by acetaldehyde (Mauch et al., 1986), and the degree of inactivation observed in our studies did not bear an obvious relationship to the level of acetaldehyde achieved by the cells. Both acute and chronic ethanol exposure increased nitric oxide levels in liver and increased the activity of inducible nitric oxide synthase (Baraona et al., 2002), and nitric oxide was reported to modify ADH and cause release of the active site zinc (Gergel and Cederbaum, 1996). This deserves additional study, as ADH activity was decreased in liver biopsies of patients with alcoholic hepatitis and cirrhosis (Zorzano et al., 1989). Furthermore, ALDH2 has been reported to undergo S-nitrosylation in ethanol-fed rats (Moon et al, 2006). Acetyl- and palmitoyl-carnitine accumulate during ethanol-induced inhibition of fatty acid oxidation and could inhibit ADH activity (Sachan and Cha, 1994). However, the inhibition constants of the β ADHs for these compounds were much too high (high μM to mM) for them to play a role in vivo, as the cellular concentrations of these compounds are likely to be in the nM range.
The low rate of ethanol oxidation in the HeLa β2 ADH cells was best explained by product inhibition by acetaldehyde, since the inhibition constants were shown to be quite low for β1 and 2 ADH. There was a rapid increase in acetaldehyde concentration in the culture medium from the HeLa β2 ADH cells at the time of the first sampling, suggesting a burst of ethanol oxidation that continued until the acetaldehyde concentration in the medium rose and the enzyme was inhibited by acetaldehyde reaching concentrations over 150 μM within 8 hours (Figure 6). The amount of ethanol converted to acetaldehyde to generate a concentration of 150 μM is only a few percent of the starting concentration, and hence the change in ethanol concentration is negligible. Since the rate of acetaldehyde production by β2 ADH after the first few hours would be quite slow, any change in intracellular NADH/NAD+ ratio would be mitigated by 24 hours (reflected by the lactate/ pyruvate ratio in the medium at 24 h (Table 3)).
While rat ADH has a similar Kip to that of β2 ADH, the enzymes have different reaction mechanisms and different rate equations (Crabb et al., 1983), and thus, the activity of the rat enzyme is less sensitive to acetaldehyde concentration than the human ADHs. Specifically, the Theorell-Chance mechanism for rat ADH reduces the ability of acetaldehyde to inhibit the enzyme. Nonetheless, studies on ethanol metabolism in rats treated with inhibitors of ALDH which raised plasma acetaldehyde levels showed reduced ethanol elimination rates, consistent with product inhibition of ADH (Nishigaki et al., 1985; Shimada et al., 1987). However, the behavior of the Hela rat ADH cells presented a paradox: these cells oxidized ethanol better than Hela-β2 ADH cells, and the calculated in situ ADH activity (the v/Vmax times the total activity in the cells) was higher, yet the level of acetaldehyde in the medium was lower. Ethanol removed from the medium by the cells has three fates: complete oxidation to CO2, or accumulation of the metabolic intermediates acetaldehyde or acetate in the medium. We have reported that these cells accumulated both acetaldehyde and acetate in the medium during ethanol oxidation (Galli et al., 1999). One might expect that the ethanol oxidation pathway would limited in the Hela cells by the activity of ALDH, since the total activity of low and high Km ALDH in the parental HeLa cells was lower than the activity of either rat or β2 ADH (Table 1). If the activity of ALDH limits the ability of the cells to oxidize ethanol, it appears that the HeLa-rat ADH cells have greater capacity to oxidize acetaldehyde than the HeLa β2 ADH cells. A possible explanation is the acetaldehyde dismutase activity reported for ADH (Svensson et al., 1996). This activity allows ADH to both oxidize and reduce aldehydes (to its corresponding carboxylic acid and alcohol, respectively) with no net reduction of NAD+. This dismutase activity has been demonstrated for human β1 and γ2 ADH, as well as horse and Drosophila ADH. The Km for butanal dismutation was 2.1 mM for β1 ADH; if aldehyde dismutation by rat ADH were to play a role in aldehyde removal in the HeLa-rat ADH cells, the Km for acetaldehyde would have to be substantially lower than this, and the rat ADH would have to be considerably more active as a dismutase than the β2 ADH.
This postulated role for acetaldehyde in the control of ethanol metabolism was consistent with the ability of cells expressing both ADH and ALDH2 (H4IIEC3 cells or rat hepatocytes, Figure 3) to oxidize ethanol well, and was confirmed experimentally by showing that expression of ALDH2 in the HeLa β2ADH cells increased the cells ability to remove ethanol from the medium, while maintaining lower concentrations of acetaldehyde (Figure 9).
The magnitude of the effect of acetaldehyde on human ADH activity in the liver during ethanol metabolism remains to be determined, but these studies allow us to estimate it. The concentration of acetaldehyde is kept low by ALDH1 and ALDH2 in liver. Estimates of intrahepatic acetaldehyde concentrations are difficult to obtain, but the concentration in the hepatic venous blood was reported to be 0.1-68 μM in controls, which did not differ significantly from 0.2-164 μM in alcoholics (Nuutinen et al., 1984). This must be a lower limit for the intracellular concentration, since intrahepatic shunting of blood, oxidation of acetaldehyde by erythrocytes, plus the gradient from the intracellular to vascular pools would result in hepatic venous blood assays underestimating intracellular acetaldehyde. If we assume that the intracellular concentration of acetaldehyde is 10 μM and that of ethanol is 5 mM, the rate equations predict that the activity of β1 and β2 ADH would be limited to 13 and 45 % of Vmax compared with the activity in the absence of acetaldehyde. This suggests that acetaldehyde could play a substantial role in the control of ethanol oxidation by the β ADHs in humans, reducing the contribution of β2 ADH to ethanol elimination. In the case of individuals with ALDH2 deficiency, considerably higher intrahepatic acetaldehyde levels occur, and would be predicted to reduce the activity of β2 ADH further from 45% to perhaps 20% of Vmax. This is consistent with the report of reduced area under the curve and peak ethanol levels in patients homozygous for ADH1B2 and ALDH2*2 given a test dose of ethanol (Luu et al., 1995).
A recently created rat model for the effect of human β ADH on ethanol metabolism also points to a role of acetaldehyde in the control of ADH activity. Rat ADH cDNA engineered to resemble human β ADH with an Arg47His mutation was introduced into liver using an adenoviral vector (Rivera-Meza et al., 2010). The animals had a 90% increase in liver ADH activity and demonstrated a transient burst of arterial blood acetaldehyde when given ethanol. The strain of animals used (UChB) were selected for high ethanol preference. Introduction of the high activity ADH resulted in a substantial reduction in alcohol consumption by these rats. The transient increase in acetaldehyde would be consistent with more rapid oxidation of ethanol when acetaldehyde levels are low initially, and might be the in vivo correlate of the early, rapid removal of ethanol from the culture medium by HeLa β2 ADH-ALDH2 cells (Figure 9) and the burst of acetaldehyde production in β2 ADH-expressing cells lacking ALDH2 (Figure 6). Ethanol oxidation would presumedly slow as the acetaldehyde concentration rose, ultimately resulting in a lower steady state rate of ethanol oxidation with an intermediate intrahepatic acetaldehyde concentration. Unfortunately, the rate of ethanol oxidation in the adenoviral-treated rats was not reported.
In summary, the ability of human ADH isozymes to oxidize ethanol was in part regulated by product inhibition of ADH by acetaldehyde; this likely contributes to the observation that individuals with highly active β2 ADH have only slightly increased rates of ethanol elimination.
ACKNOWLEDGMENT
The authors thank Dr. Jae Seung Park (Indiana University School of Medicine, Department of Medicine) for assistance with the preparation of rat hepatocytes, Dr. William Bosron for antibody against human ADH and the recombinant ADH enzymes, as well as useful connments on the manuscript, Dr. Howard Edenberg for cDNAs for β1, β2, and β3 ADH, and Dr. Henry Weiner for the antibody against human ALDH2.
ABBREVIATIONS
- ADH
alcohol dehydrogenase
- ALDH
aldehyde dehydrogenase
- Vmax
maximal velocity of the enzyme
- NAD+
nicotinamide adenine dinucleotide
- NADH
reduced nicotinamide adenine dinucleotide
- Ki
inhibition constant
Footnotes
Support: This work was supported by grants from the National Institute on Alcohol Abuse and Alcoholism (NIAAA) to DWC (AA06434 and AA11835) and the Indiana Alcohol Research Center (P60 AA07611).
REFERENCES
- Baraona E, Zeballos GA, Shoichet L, Mak KM, Lieber CS. Ethanol consumption increases nitric oxide production in rats, and its peroxynitrite-mediated toxicity is attenuated by polyenylphosphatidylcholine. Alcohol Clin Exp Res. 2002;26:883–889. [PubMed] [Google Scholar]
- Boren J, Graham L, Wettesten M, Scott J, White A, Olofsson SO. The assembly and secretion of ApoB 100-containing lipoproteins in Hep G2 cells. ApoB 100 is cotranslationally integrated into lipoproteins. J Biol Chem. 1992;267:9858–9867. [PubMed] [Google Scholar]
- Bosron WF, Crabb DW, Housinger TA, Li TK. Effect of fasting on the activity and turnover of rat liver alcohol dehydrogenase. Alcohol Clin Exp Res. 1984;8:196–200. doi: 10.1111/j.1530-0277.1984.tb05837.x. [DOI] [PubMed] [Google Scholar]
- Bosron WF, Li TK. Genetic polymorphism of human liver alcohol and aldehyde dehydrogenases, and their relationship to alcohol metabolism and alcoholism. Hepatology. 1986;6:502–510. doi: 10.1002/hep.1840060330. [DOI] [PubMed] [Google Scholar]
- Bosron WF, Li TK. Catalytic properties of human liver alcohol dehydrogenase isoenzymes. Enzyme. 1987;37:19–28. doi: 10.1159/000469238. [DOI] [PubMed] [Google Scholar]
- Bucher T, Brauser B, Conze A, Klein F, Langguth O, Sies H. State of oxidation-reduction and state of binding in the cytosolic NADH-system as disclosed by equilibration with extracellular lactate-pyruvate in hemoglobin-free perfused rat liver. Eur J Biochem. 1972;27:301–317. doi: 10.1111/j.1432-1033.1972.tb01840.x. [DOI] [PubMed] [Google Scholar]
- Crabb DW, Bosron WF, Li TK. Steady-state kinetic properties of purified rat liver alcohol dehydrogenase: application to predicting alcohol elimination rates in vivo. Arch Biochem Biophys. 1983;224:299–309. doi: 10.1016/0003-9861(83)90213-8. [DOI] [PubMed] [Google Scholar]
- Crabb DW, Matsumoto M, Chang D, You M. Overview of the role of alcohol dehydrogenase and aldehyde dehydrogenase and their variants in the genesis of alcohol-related pathology. Proc Nutr Soc. 2004;63:49–63. doi: 10.1079/pns2003327. [DOI] [PubMed] [Google Scholar]
- Crabb DW, Stewart MJ, Xiao Q. Hormonal and chemical influences on the expression of class 2 aldehyde dehydrogenases in rat H4IIEC3 and human HuH7 hepatoma cells. Alcohol Clin Exp Res. 1995;19:1414–1419. doi: 10.1111/j.1530-0277.1995.tb01000.x. [DOI] [PubMed] [Google Scholar]
- Ehrig T, Bosron WF, Li TK. Alcohol and aldehyde dehydrogenase. Alcohol Alcohol. 1990;25:105–116. doi: 10.1093/oxfordjournals.alcalc.a044985. [DOI] [PubMed] [Google Scholar]
- Enomoto N, Takase S, Yasuhara M, Takada A. Acetaldehyde metabolism in different aldehyde dehydrogenase-2 genotypes. Alcohol Clin Exp Res. 1991;15:141–144. doi: 10.1111/j.1530-0277.1991.tb00532.x. [DOI] [PubMed] [Google Scholar]
- Galli A, Price D, Crabb D. High-level expression of rat class I alcohol dehydrogenase is sufficient for ethanol-induced fat accumulation in transduced HeLa cells. Hepatology. 1999;29:1164–1170. doi: 10.1002/hep.510290420. [DOI] [PubMed] [Google Scholar]
- Gergel D, Cederbaum AI. Inhibition of the catalytic activity of alcohol dehydrogenase by nitric oxide is associated with S nitrosylation and the release of zinc. Biochemistry. 1996;35:16186–16194. doi: 10.1021/bi962043r. [DOI] [PubMed] [Google Scholar]
- Graham FL, van der Eb AJ. A new technique for the assay of infectivity of human adenovirus 5 DNA. Virology. 1973;52:456–467. doi: 10.1016/0042-6822(73)90341-3. [DOI] [PubMed] [Google Scholar]
- Gritz L, Davies J. Plasmid-encoded hygromycin B resistance: the sequence of hygromycin B phosphotransferase gene and its expression in Escherichia coli and Saccharomyces cerevisiae. Gene. 1983;25:179–188. doi: 10.1016/0378-1119(83)90223-8. [DOI] [PubMed] [Google Scholar]
- Hasin D, Aharonovich E, Liu X, Mamman Z, Matseoane K, Carr LG, Li TK. Alcohol dependence symptoms and alcohol dehydrogenase 2 polymorphism: Israeli Ashkenazis, Sephardics, and recent Russian immigrants. Alcohol Clin Exp Res. 2002;26:1315–1321. doi: 10.1097/01.ALC.0000029597.07916.A9. [DOI] [PubMed] [Google Scholar]
- Lamprecht W, Heinz F. Pyruvate. In: Bergmeyer HU, editor. Methods of Enzymatic Analysis. 3rd ed Verlag Chemie; Basel: 1984. pp. 570–577. [Google Scholar]
- Luu SU, Wang MF, Lin DL, Kao MH, Chen ML, Chiang CH, Pai L, Yin SJ. Ethanol and acetaldehyde metabolism in Chinese with different aldehyde dehydrogenase-2 genotypes. Proc Natl Sci Counc Repub China B. 1995;19:129–136. [PubMed] [Google Scholar]
- Mauch TJ, Donohue TM, Jr, Zetterman RK, Sorrell MF, Tuma DJ. Covalent binding of acetaldehyde selectively inhibits the catalytic activity of lysine-dependent enzymes. Hepatology. 1986;6:263–269. doi: 10.1002/hep.1840060218. [DOI] [PubMed] [Google Scholar]
- Miller AD, Rosman GJ. Improved retroviral vectors for gene transfer and expression. Biotechniques. 1989;7:980–990. [PMC free article] [PubMed] [Google Scholar]
- Mizoi Y, Yamamoto K, Ueno Y, Fukunaga T, Harada S. Involvement of genetic polymorphism of alcohol and aldehyde dehydrogenases in individual variation of alcohol metabolism. Alcohol Alcohol. 1994;29:707–710. [PubMed] [Google Scholar]
- Moon KH, Hood BL, Kim BJ, Hardwich JP, Conrads TP, Veenstra TD, Song BJ. Hepatology. 2006;44:1218–1230. doi: 10.1002/hep.21372. [DOI] [PubMed] [Google Scholar]
- Neumark YD, Friedlander Y, Durst R, Leitersdorf E, Jaffe D, Ramchandani VA, O’Connor S, Carr LG, Li TK. Alcohol dehydrogenase polymorphisms influence alcohol-elimination rates in a male Jewish population. Alcohol Clin Exp Res. 2004;28:10–14. doi: 10.1097/01.ALC.0000108667.79219.4D. [DOI] [PubMed] [Google Scholar]
- Nishigaki R, Utsugi K, Maeda K, Inahara S, Enomoto K, Umemura K. Effects of diethyldithiocarbamate, a metabolite of disulfiram, on the pharmacokinetics of alcohol and acetaldehyde in the rat. J Pharmacobiodyn. 1985;8:847–852. doi: 10.1248/bpb1978.8.847. [DOI] [PubMed] [Google Scholar]
- Noll F. Lactate. In: Bergmeyer HU, editor. Methods of Enzymatic Analysis. 3rd ed. Verlag Chemie; Basel: 1984. pp. 582–587. [Google Scholar]
- Nuutinen HU, Salaspuro MP, Valle M, Lindros KO. Blood acetaldehyde concentration gradient between hepatic and antecubital venous blood in ethanol-intoxicated alcoholics and controls. Eur J Clin Invest. 1984;14:306–311. doi: 10.1111/j.1365-2362.1984.tb01186.x. [DOI] [PubMed] [Google Scholar]
- Rivera-Meza M, Quintanilla ME, Tampier L, Mura CV, Sapag A, Israel Y. Mechanism of protection against alcoholism by an alcohol dehydrogenase polymorphism: development of an animal model. FASEB J. 2010;24:266–274. doi: 10.1096/fj.09-132563. [DOI] [PMC free article] [PubMed] [Google Scholar]
- Sachan DS, Cha YS. Acetylcarnitine inhibits alcohol dehydrogenase. Biochem Biophys Res Commun. 1994;203:1496–1501. doi: 10.1006/bbrc.1994.2354. [DOI] [PubMed] [Google Scholar]
- Shimada J, Miyahara T, Otsubo S, Yoshimatsu N, Oguma T, Matsubara T. Effects of alcohol-metabolizing enzyme inhibitors and beta-lactam antibiotics on ethanol elimination in rats. Jpn J Pharmacol. 1987;45:533–544. doi: 10.1254/jjp.45.533. [DOI] [PubMed] [Google Scholar]
- Svensson S, Lundsjö A, Cronholm T, Höög JO. Aldehyde dismutase activity of human liver alcohol dehydrogenase. FEBS Lett. 1996;394:217–220. doi: 10.1016/0014-5793(96)00954-4. [DOI] [PubMed] [Google Scholar]
- Tangerman A. Highly sensitive gas chromatographic analysis of ethanol in whole blood, serum, urine, and fecal supernatants by the direct injection method. Clin Chem. 1997;43:1003–1009. [PubMed] [Google Scholar]
- Thomasson HR, Beard JD, Li TK. ADH2 gene polymorphisms are determinants of alcohol pharmacokinetics. Alcohol Clin Exp Res. 1995;19:1494–1499. doi: 10.1111/j.1530-0277.1995.tb01013.x. [DOI] [PubMed] [Google Scholar]
- Tischler ME, Friedrichs D, Coll K, Williamson JR. Pyridine nucleotide distributions and enzyme mass action ratios in hepatocytes from fed and starved rats. Arch Biochem Biophys. 1977a;184:222–236. doi: 10.1016/0003-9861(77)90346-0. [DOI] [PubMed] [Google Scholar]
- Tischler ME, Hecht P, Williamson JR. Determination of mitochondrial/cytosolic metabolite gradients in isolated rat liver cells by cell disruption. Arch Biochem Biophys. 1977b;181:278–293. doi: 10.1016/0003-9861(77)90506-9. [DOI] [PubMed] [Google Scholar]
- Veech RL, Raijman L, Krebs HA. Equilibrium relations between the cytoplasmic adenine nucleotide system and nicotinamide-adenine nucleotide system in rat liver. Biochem J. 1970;117:499–503. doi: 10.1042/bj1170499. [DOI] [PMC free article] [PubMed] [Google Scholar]
- Wall TL, Peterson CM, Peterson KP, Johnson ML, Thomasson HR, Cole M, Ehlers CL. Alcohol metabolism in Asian-American men with genetic polymorphisms of aldehyde dehydrogenase. Ann Intern Med. 1997;127:376–379. doi: 10.7326/0003-4819-127-5-199709010-00007. [DOI] [PubMed] [Google Scholar]
- Waterlow JC, Garlick PJ, Millward DJ. Protein turnover in mammalian tissues and in the whole body. Elsevier/North-Holland; Amsterdam: 1978. [Google Scholar]
- Williamson DH, Lund P, Krebs HA. The redox state of free nicotinamide-adenine dinucleotide in the cytoplasm and mitochondria of rat liver. Biochem J. 1967;103:514–527. doi: 10.1042/bj1030514. [DOI] [PMC free article] [PubMed] [Google Scholar]
- Xiao Q, Weiner H, Johnston T, Crabb DW. The aldehyde dehydrogenase ALDH2*2 allele exhibits dominance over ALDH2*1 in transduced HeLa cells. J Clin Invest. 1995;96:2180–2186. doi: 10.1172/JCI118272. [DOI] [PMC free article] [PubMed] [Google Scholar]
- Xiao Q, Weiner H, Crabb DW. The mutation in the mitochondrial aldehyde dehydrogenase (ALDH2) gene responsible for alcohol-induced flushing increases turnover of the enzyme tetramers in a dominant fashion. J Clin Invest. 1996;98:2027–2032. doi: 10.1172/JCI119007. [DOI] [PMC free article] [PubMed] [Google Scholar]
- You M, Fischer M, Cho WK, Crabb D. Transcriptional control of the human aldehyde dehydrogenase 2 promoter by hepatocyte nuclear factor 4: inhibition by cyclic AMP and COUP transcription factors. Arch Biochem Biophys. 2002;398:79–86. doi: 10.1006/abbi.2001.2713. [DOI] [PubMed] [Google Scholar]
- Zorzano A, Ruiz del Arbol L, Herrera E. Effect of liver disorders on ethanol elimination and alcohol and aldehyde dehydrogenase activities in liver and erythrocytes. Clin Sci (Lond) 1989;76:51–57. doi: 10.1042/cs0760051. [DOI] [PubMed] [Google Scholar]
- Zuurendonk PF, Tischler ME, Akerboom TP, Van Der Meer R, Williamson JR, Tager JM. Rapid separation of particulate and soluble fractions from isolated cell preparations (digitonin and cell cavitation procedures) Methods Enzymol. 1979;56:207–223. doi: 10.1016/0076-6879(79)56023-6. [DOI] [PubMed] [Google Scholar]


