

Abstract
Objectives
Bipolar disorder is a debilitating psychiatric illness presenting with recurrent mania and depression. The pathophysiology of bipolar disorder is poorly understood, and molecular targets in the treatment of bipolar disorder remain to be identified. Preclinical studies have suggested that glycogen synthase kinase-3 (GSK3) is a potential therapeutic target in bipolar disorder, but evidence of abnormal GSK3 in human bipolar disorder and its response to treatment is still lacking.
Methods
This study was conducted in acutely ill type I bipolar disorder subjects who were hospitalized for a manic episode. The protein level and the inhibitory serine phosphorylation of GSK3 in peripheral blood mononuclear cells of bipolar manic and healthy control subjects were compared, and the response of GSK3 to antimanic treatment was evaluated.
Results
The levels of GSK3α and GSK3β in this group of bipolar manic subjects were higher than healthy controls. Symptom improvement during an eight-week antimanic treatment with lithium, valproate, and atypical antipsychotics was accompanied by a significant increase in the inhibitory serine phosphorylation of GSK3, but not the total level of GSK3, whereas concomitant electroconvulsive therapy treatment during a manic episode appeared to dampen the response of GSK3 to pharmacological treatment.
Conclusions
Results of this study suggest that GSK3 can be modified during the treatment of bipolar mania. This finding in human bipolar disorder is in agreement with preclinical data suggesting that inhibition of GSK3 by increasing serine phosphorylation is a response of GSK3 to psychotropics used in bipolar disorder, supporting the notion that GSK3 is a promising molecular target in the pharmacological treatment of bipolar disorder.
Keywords: antipsychotics, bipolar disorder, glycogen synthase kinase-3, mania, mood stabilizers
Bipolar disorder afflicts approximately 2% of the population and is debilitating and life-threatening if untreated (1-3). The clinical course of bipolar disorder is characterized by the occurrence of one or more manic episodes that often cycles with depressive episodes. The pathophysiological mechanisms underlying bipolar disorder are unknown, but may include genetic variations, abnormal development of neural networks, and dysregulation of neurotransmitters and signaling activities (4-6). Therefore, identifying key mood-regulating molecules is critical for understanding the pathophysiology of bipolar disorder and developing new therapeutic interventions (7).
Glycogen synthase kinase-3 (GSK3) is a serine/threonine protein kinase that is widely distributed in many tissues, including brain and peripheral blood cells. Two GSK3 proteins, GSK3α and GSK3β, are paralogous proteins that share 84% sequence homology, but are encoded by different genes (8) and have similar and different substrates and functions (9-15). GSK3 is a broadly influential enzyme that modulates many aspects of cellular function, such as gene expression and neural plasticity (16, 17).
GSK3 has been thought to be associated with bipolar disorder since lithium, an effective mood stabilizer used therapeutically for bipolar disorder, was found to be a selective inhibitor of GSK3 (18, 19). Substantial preclinical evidence has also shown a relationship between GSK3 and mood-related behavioral disturbances; e.g., GSK3β-overexpressing transgenic mice exhibit hyperactive behavior (20), amphetamine-induced hyperactivity concurs with disinhibition of GSK3 (21, 22), and both lithium and selective GSK3 inhibitors reduce hyperactivity in animals (21-23). In addition, GSK3 may play a role in depressive-like behavioral disturbances, as mice with constitutively active GSK3 are vulnerable to stress-induced depressive behaviors (22), whereas mice with reduced levels of either GSK3α and GSK3β or treated with selective GSK3 inhibitors elicit antidepressant-like behaviors (23-27).
GSK3 is constitutively partially active in the brain, while its activity is predominantly regulated in an inhibitory manner by phosphorylation of serines in the N-terminal regions of its two isoforms, serine-21 in GSK3α and serine-9 in GSK3β (8). This phosphorylation transforms the N-terminus into a pseudosubstrate that blocks access of substrates to GSK3, rendering GSK3 inactive (28). The serine phosphorylation mechanism is used by many mood-regulating neuromodulators, such as dopamine (21), serotonin (29), and brain-derived neurotrophic factor (BDNF) (30), raising the possibility that this regulatory mechanism is critical for mood regulation (22, 31-33). Besides directly inhibiting GSK3 activity by competing with magnesium, lithium also increases the inhibitory serine-phosphorylation of GSK3 (34), and this action is shared by other antimanic agents such as valproate and antipsychotic drugs (34-37), and by established antidepressants fluoxetine and imipramine (29).
Previously, we reported that the level of serine phosphorylation of GSK3 in human peripheral blood mononuclear cells (PBMCs) was lower in bipolar disorder patients than in healthy controls (22), but much higher in bipolar disorder patients stabilized on lithium (38). In this study, we further examined the protein level and the inhibitory serine phosphorylation of GSK3α and GSK3β in an independent group of acutely manic type I bipolar disorder patients by comparing their GSK3 levels to those of healthy controls and by testing their GSK3 responses to antimanic treatment. The results showed that the level of total GSK3 was higher in bipolar manic patients than in healthy controls, and an eight-week antimanic treatment increased the inhibitory serine phosphorylation of GSK3. These new data therefore provide additional support of GSK3 as a potential molecular target during bipolar disorder treatment.
Materials and methods
Human subjects, demographics, and clinical evaluation
This study was approved by the local Institutional Review Board and was conducted from December 2007 to March 2010 at the Beijing Anding Hospital, an ambulatory psychiatric institution in Beijing, China. Written informed consent was obtained from all subjects after receiving a complete description of the study.
The inclusion criteria for eligible subjects were: (i) men and women, 19–65 years of age; (ii) DSM-IV diagnosis of type I bipolar disorder; (iii) hospitalization within the last seven days for an acute manic episode, symptomatic at enrollment with a score of ≥ 20 on the Young Mania Rating Scale (YMRS) (39), and no ongoing mixed or depressive episodes with a score of ≤ 10 on the Montgomery-Åsberg Depression Rating Scale (MADRS) (40); (iv) not taking psychotropic medications for at least four weeks prior to this hospital admission; and (v) no major unstable medical illnesses for three months prior to enrollment. Subjects were excluded if they concomitantly met criteria for any other major DSM-IV Axis I diagnoses, such as psychotic disorder, major depressive disorder, anxiety disorder, or alcohol and/or other substance dependence. Psychiatric history, DSM-IV diagnosis, and medical history along with a physical examination and neurological examination were obtained prior to enrollment. Clinical symptoms were assessed using the YMRS for mania, the MADRS and the Hamilton Depression Rating Scale (HAM-D) (41) for depression, and the Clinical Global Impression for Bipolar Disorder-Severity (CGI-S) (42). All assessments were completed on the day of each blood collection at Week 0, Week 4, and Week 8. Vital signs, laboratory tests for chemistry, blood cell count, thyroid function, liver function, and metabolic profile were conducted at Week 0, and vital signs, blood glucose, liver function, and blood cholesterol were repeated at Week 4 and Week 8.
A total of 73 type I bipolar disorder subjects who met inclusion criteria at the screening visit were enrolled in the study and had blood collected at baseline. Blood samples from the first 30 medication-free (i.e., not taking psychotropics for four consecutive weeks prior to blood collection) subjects were included in the comparative analysis with 30 healthy controls who had no history of psychiatric illness and no major medical illnesses. All enrolled bipolar disorder subjects received treatment as usual (TAU) for their manic episode. For subjects whose medication treatment was initiated prior to Week 0 blood collection (n = 9), the medication had not been used for longer than four days, and the YMRS score was > 20 at the Week 0 blood draw. There was no washout phase for this study. Among all bipolar disorder subjects, blood was collected from 47 at Week 4 treatment and from 28 of these at Week 8. Data from these 47 samples were used for before- and after-treatment analysis. Post-treatment blood samples from 26 subjects were not available due to loss to follow-up, consent withdrawal, or change of pharmacological treatment during the study period. Two cases were terminated due to switch to significant depression during the study period. Treatment received by the 47 subjects included lithium, valproate, and an atypical antipsychotic (olanzapine, risperidone, or quetiapine). Due to the severity of clinical symptoms, 40 of the 47 subjects received a combination drug treatment. In addition to drug treatment (monotherapy or combination therapy), a course of ECT from Week 0 to Week 3 was administered to 20 of the 47 subjects. Demographic and baseline clinical information of the 47 subjects are summarized in Table 1, and detailed treatment information is shown in Table 2.
Table 1.
Baseline demographic and clinical information of bipolar manic subjects
| Subjects, n | 47 |
| Age, years, mean (SD) | 32.60 (12.47) |
| Gender, n: male/female | 16/31 |
| Education, years, mean (SD) | 12.55 (3.22) |
| Course of bipolar disorder, months, mean (SD) | 80.72 (117.48) |
| Current episode, days (median) | 7∼120 (13) |
| Lifetime manic episodes, mean (SD) | 3.23 (4.41) |
| Baseline YMRS score, mean (SD) | 27.04 (4.37) |
| Baseline CGI-S score, mean (SD) | 5.06 (0.75) |
| Baseline HAMD score, mean (SD) | 3.15 (2.57) |
| Baseline MADRS score, mean (SD) | 4.83 (2.44) |
| Subjects with ECT, n | 20 |
| Dropouts between Week 4 and Week 8, n | 19 |
YMRS = Young Mania Rating Scale; CGI-S = Clinical Global Impression for Bipolar Disorder-Severity; HAM-D = Hamilton Depression Rating Scale; MADRS = Montgomery-Åsberg Depression Rating Scale; ECT = electroconvulsive therapy.
Table 2.
Medication treatment record of the 47 bipolar manic subjectsa
| Treatment (Week 0 ∼ Week 8) | Week 0 dose | Ending dose | Min. dose | Max. dose | Treatment prior to Week 0 |
|---|---|---|---|---|---|
| Lithium + olanzapine | LITH 500-750 mg/d + OLAN 5-10 mg/d × 4d (n = 2); LITH 750 mg/d × 4d (n = 1) | ||||
| Subjects, n | 20 | ||||
| Lithium carbonate, mean (SD) | 525 (112) | 981 (190) | 250 | 1250 | |
| Olanzapine, mean (SD) | 7.63 (3.86) | 7.00 (3.50) | 5 | 15 | |
| With ECT, n | 10 | ||||
| Without ECT, n | 10 | ||||
| Lithium + quetiapine | |||||
| Subjects, n | 2 | ||||
| Lithium carbonate, mean (SD) | 500 (0) | 1125 (177) | 500 | 1250 | |
| Quetiapine, mean (SD) | 50 (0) | 300 (141) | 50 | 400 | |
| With ECT, n | 1 | ||||
| Without ECT, n | 1 | ||||
| Lithium + risperidone | |||||
| Subjects, n | 2 | ||||
| Lithium carbonate, mean (SD) | 500 (0) | 500 (0) | 500 | 500 | |
| Risperidone, mean (SD) | 1(0) | 3 (0) | 1 | 3 | |
| With ECT, n | 2 | ||||
| Without ECT, n | 0 | ||||
| Lithium | |||||
| Subjects, n | 2 | ||||
| Lithium, mean (SD) | 550 (112) | 1050 (209) | 500 | 1250 | |
| With ECT, n | 1 | ||||
| Without ECT, n | 1 | ||||
| Valproate + olanzapine | VAL 500 mg/d + QUET 300 mg/d × 4d (n = 1) | ||||
| Subjects, n | 5 | ||||
| Valproate, mean (SD) | 600 (224) | 1000 (0) | 500 | 1000 | |
| Olanzapine, mean (SD) | 8.00 (2.74) | 7.50 (3.54) | 5 | 10 | |
| With ECT, n | 1 | ||||
| Without ECT, n | 4 | ||||
| Valproate | VAL 500-1000 mg/d × 2d (n = 2) | ||||
| Subjects, n | 3 | ||||
| Valproate, mean (SD) | 700 (265) | 1067 (275) | 500 | 1250 | |
| With ECT, n | 0 | ||||
| Without ECT, n | 3 | ||||
| Lithium + valproate + olanzapine | |||||
| Subjects, n | 3 | ||||
| Lithium, mean (SD) | 750 (250) | 1000 (0) | 500 | 1000 | |
| Valproate, mean (SD) | 500 (0) | 1000 (0) | 500 | 1000 | |
| Olanzapine, mean (SD) | 6.67 (2.89) | 5.00 (0) | 5 | 5 | |
| With ECT, n | 0 | ||||
| Without ECT, n | 3 | ||||
| Lithium + valproate + quetiapine | LITH 500 mg/d × 1d (n = 1) | ||||
| Subjects, n | 5 | ||||
| Lithium, mean (SD) | 460 (89) | 930 (208) | 300 | 1250 | |
| Valproate, mean (SD) | 620 (217) | 838 (197) | 500 | 1000 | |
| Quetiapine, mean (SD) | 150 (71) | 283 (275) | 100 | 600 | |
| With ECT, n | 3 | ||||
| Without ECT, n | 2 | ||||
| Lithium + valproate + risperidone | |||||
| Subjects, n | 1 | ||||
| Lithium, mean (SD) | 500 (0) | 500 (0) | 500 | 500 | |
| Valproate, mean (SD) | 500 (0) | 250 (0) | 500 | 250 | |
| Risperidone, mean (SD) | 2 (0) | 0 (0) | 2 | 0 | |
| With ECT, n | 1 | ||||
| Without ECT, n | 0 | ||||
| Lithium + valproate | LITH 500 mg/d × 1d (n = 1) | ||||
| Subjects, n | 2 | ||||
| Lithium, mean (SD) | 250 (354) | 1000 (0) | 500 | 1000 | |
| Valproate, mean (SD) | 500 (0) | 1250 (0) | 500 | 1250 | |
| With ECT, n | 0 | ||||
| Without ECT, n | 2 | ||||
| Olanzapine | OLAN 10∼15mg/d × 2d (n = 1) | ||||
| Subjects, n | 2 | ||||
| Olanzapine, mean (SD) | 11.25 (5.30) | 15.00 (0) | 7.5 | 15 | |
| With ECT, n | 1 | ||||
| Without ECT, n | 1 | ||||
| Total, n | Week 0 | Week 8 | n = 9 | ||
| Subjects | 47 | 28 | |||
| With ECT | 20 | 13 | |||
| Without ECT | 27 | 15 |
ECT = electroconvulsive therapy; LITH = lithium; OLAN = olanzapine; VAL = valproate; QUET = quetiapine.
Drug doses reported as mg/day.
Human PBMC preparation and GSK3 measurements
Blood samples were collected at Week 0, Week 4, and Week 8 following clinical evaluation. Approximately 20 ml blood was collected from each subject by venipuncture. PBMCs were extracted from fresh whole blood, as described previously (38), by addition of 0.25-volume of IsoPrep solution (Robbins Scientific Corp, Sunnyvale, CA, USA) into the bottom of the blood-containing tube followed by centrifugation (2,000 rpm for 20 min at room temperature). The cell layer containing PBMCs was transferred to a clean tube and was washed twice with serum-free cell culture media. Approximately 2 × 10⁷ PBMCs were obtained from 20 ml of whole blood.
PBMCs were immediately lysed in ice-cold lysis buffer (10 mM Tris-HCl, pH 7.4, 150 mM NaCl, 1 mM EDTA, 1 mM EGTA, 0.5% NP-40, 10 μg/ml leupeptin, 10 μg/ml aprotinin, 5 μg/ml pepstatin, 0.1 mM β-glycerophosphate, 1 mM phenylmethanesulfonyl fluoride, 1 mM sodium vanadate, and 100 nM okadaic acid). Protein lysate was collected by centrifugation at 14,000 rpm for 10 min, and supernatant was immediately frozen. For immunoblot analysis, all three protein samples from each subject (Weeks 0, 4, and 8) and one from an age- and gender-matched healthy control subject were processed together for electrophoresis and immunoblotting using antibodies specific for phospho-Ser21-GSK3α, phospho-Ser9-GSKβ (Cell Signaling Technology, Danvers, MA, USA), GSK3α and GSK3β (Millipore, Billerica, MA, USA), and β-tubulin (Sigma-Adrich, St. Louis, MO, USA). Protein bands on immunoblots were quantified by densitometry.
Statistical analysis
Statistical analyses were conducted using SPSS (SPSS, Inc., Chicago, IL, USA). All data were checked for assumptions of normal distribution and homogeneity of variance in study samples. Difference between healthy controls and bipolar manic subjects was detected by independent sample t-test if the data passed the homogeneity test, or nonparametric test if the data failed the homogeneity test. Available data from the 47 treated bipolar manic subjects were analyzed by ANOVA to test before- and after-treatment differences (p ≤ 0.05). Any significant difference detected by ANOVA was followed by post-hoc analysis or nonparametric measures. Data from the 28 subjects who provided samples on Weeks 0, 4, and 8 were reanalyzed by repeated measures with ECT treatment as a factor. Pearson's correlation analysis was conducted for treatment responses between clinical measure and GSK3. The results presented may be worth investigating in future large-scale clinical studies.
Results
To determine the activity level of GSK3 in bipolar manic subjects, the baseline levels of total GSK3 and phospho-Ser-GSK3 in PBMCs of 30 medication-free bipolar manic subjects were compared with 30 healthy controls. The total protein levels of both GSK3α and GSK3β were significantly higher in bipolar manic subjects than in healthy controls (Table 3). When phospho-Ser-GSK3 was calculated as the ratio of total GSK3, both phospho-Ser21-GSK3α and phospho-Ser9-GSK3β showed a trend toward being lower in bipolar manic subjects than in healthy controls, but the difference did not reach statistical significance.
Table 3.
The levels of glycogen synthase kinase-3 (GSK3) in bipolar manic patients and healthy controls
| Healthy control | Bipolar manic | p-value | |
|---|---|---|---|
| Subjects, n | 30 | 30 | |
| Male, n | 11 | 10 | |
| Female, n | 19 | 20 | |
| Age, years, mean (SD) | 37.1 (10.9) | 35.5 (11.9) | 0.884 |
| Ratio of total GSK3α/tubulin, mean (SD) | 1.20 (0.41) | 1.48 (0.56) | 0.035 |
| Ratio of pS21/total GSK3α, mean (SD) | 0.97 (0.35) | 0.86 (0.29) | 0.194 |
| Ratio of total GSK3β/tubulin, mean (SD) | 0.36 (0.14) | 0.55 (0.28) | 0.037 |
| Ratio of pS9/total GSK3β, mean (SD) | 2.06 (0.97) | 1.49 (0.62) | 0.070 |
The responses of both clinical symptoms and GSK3 in PBMCs to antimanic treatment were analyzed in 47 bipolar manic subjects whose blood was collected both before and after treatment, as described in the Methods. Manic symptoms significantly improved during the treatment, with a reduction of average YMRS scores from 27.04 ± 4.37 at Week 0 to 4.81 ± 6.05 at Week 4 and 2.20 ± 5.86 at Week 8 (F = 270.4, p < 0.001), including a markedly improved YMRS sleep score in 90% of subjects. When the levels of GSK3 among all 47 bipolar manic subjects at treatment Weeks 0, 4, and 8 were justified as ‘% Week 0 values’, there was a significant increase in phospho-Ser21-GSK3α (F = 4.555, p = 0.012) and a trend of increase in phospho-Ser9-GSK3β during the eight-week treatment (Figs. 1A, 1B). Although the change of phospho-Ser9-GSK3β did not reach statistical significance (F = 2.730, p = 0.069) when data from all 47 subjects were analyzed, a repeated-measure analysis from the 28 subjects who completed the entire 8-week study showed significant increase in phospho-Ser9-GSK3β (F = 3.906, p = 0.027) at both Week 4 (p = 0.049) and Week 8 (p = 0.009). The levels of total GSK3α and GSK3β among the 47 subjects were not significantly different at treatment Week 0, Week 4, and Week 8 (F = 0.375, p = 0.688 for GSK3α, and F = 0.275, p = 0.761 for GSK3β) (Figs. 1A, 1C).
Fig. 1.
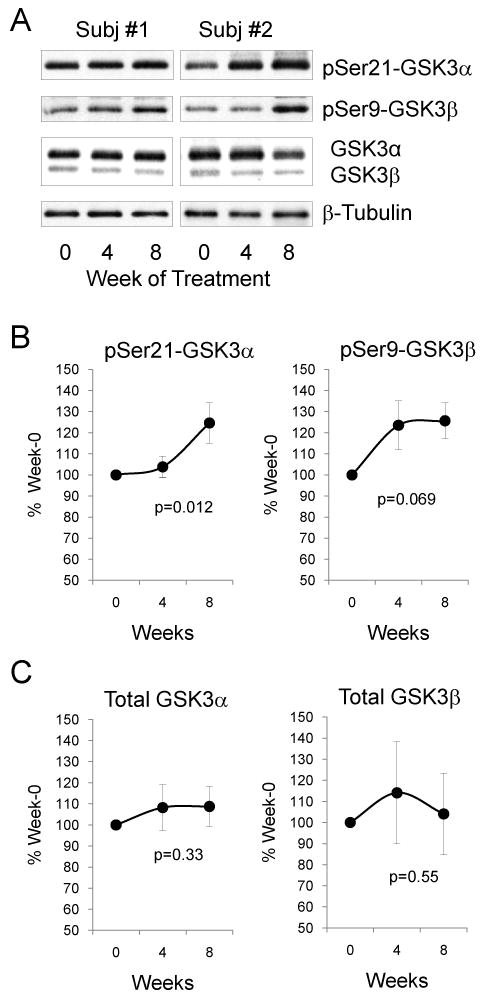
The effect of antimanic treatment on glycogen synthase kinase-3 (GSK3) in peripheral blood mononuclear cells (PBMCs) of bipolar manic subjects. (A) Representative immunoblots from PBMCs of 2 of the 47 bipolar manic subjects. Immunoblots of (B) phospho-Ser21-GSK3α and phospho-Ser9-GSK3β, and (C) total GSK3α and total GSK3β from PBMCs of 47 bipolar manic subjects were quantified and values are expressed as ‘% Week 0’ value of each individual subject. Mean ± SEM, p-values show within-group ANOVA between Week 0, Week 4, and Week 8.
To further analyze the response of phospho-Ser9-GSK3β to treatment, the 47 subjects were grouped by clinical responders (defined as ≥ 50% change from Week 0 in YMRS scores) and increase in phospho-Ser9-GSK3β (> 100% of Week 0 values). At Week 4, 51.1% of total subjects (n = 47) were clinical responders with an increase in phospho-Ser9-GSK3β, and at Week 8, this group of subjects was 71.4% of total remaining subjects (n = 28) (Fig. 2A). However, there was also a group of clinical responders whose phospho-Ser9-GSK3β did not increase during treatment. To evaluate whether the change of phospho-Ser9-GSK3β was due to a variation of total GSK3β among subjects (Fig. 1C), the level of phospho-Ser9-GSK3β was normalized as the ratio of total GSK3β. This analysis among the 47 subjects resulted only in a trend of increase in phospho-Ser9-GSK3β (Fig. 2B). Among all the antimanic treatments used by the 47 subjects (Table 2), the most common regimen was lithium + olanzapine (n = 20). Since both lithium and olanzapine have been reported in several studies to increase the inhibitory serine phosphorylation of GSK3 (43), data from the 20 lithium + olanzapine treated subjects were stratified for further analysis (Table 4). Both lithium and olanzapine were titrated to the tolerable therapeutic doses within the first four weeks of the study period. The serum lithium concentration reached a low therapeutic level at Week 4 and the level remained steady between Week 4 and Week 8 of treatment. The total YMRS and CGI-S scores significantly improved during treatment. The metabolic profiles were satisfactory without significant signs of developing metabolic syndrome during the course of treatment. Lithium + olanzapine treatment significantly increased the ratio of phospho-Ser9-GSK3β to total GSK3β (F = 4.203, p = 0.025) at both Week 4 (p = 0.013) and Week 8 (p = 0.036) (Fig. 2C), but did not change the levels of total GSK3β during the eight weeks of treatment (p = 0.69).
Fig. 2.

Change of phospho-Ser9-GSK3β before and after antimanic treatment of bipolar manic subjects. (A) Phospho-Ser9-GSK3β was plotted against Young Mania Rating Scale (YMRS) score of each individual subject. Data were grouped as (i) clinical responders (defined as > 50% change from Week 0 YMRS score) with an increase in phospho-Ser9-GSK3β; (ii) clinical responders without an increase in phospho-Ser9-GSK3β; (iii) poor clinical responders (defined as < 50% change from Week 0 YMRS score) with an increase in phospho-Ser9-GSK3 β; and (iv) poor clinical responders without an increase in phospho-Ser9-GSK3 β. (B) The ratio of phospho-Ser9-GSK3β to total GSK3β from peripheral blood mononuclear cells (PBMCs) of 47 bipolar manic subjects who received any combination of antimanic treatment (see Table 2). (C) The ratio of phospho-Ser9-GSK3β to total GSK3β from PBMCs of 20 bipolar manic subjects who received lithium + olanzapine treatment. Mean ± SEM, *p < 0.05 in ANOVA post-hoc analysis comparing Week 4 and Week 8 to Week 0. GSK = glycogen synthase kinase-3.
Table 4.
Clinical data of subjects with lithium + olanzapine treatment
| Assessment | Clinical visit | ||
|---|---|---|---|
| Week 0 Mean (SD) | Week 4 Mean (SD) | Week 8 Mean (SD) | |
| Subjects, n | 20 | 20 | 13 |
| Lithium, mg/d | 525.00 (111.80) | 987.50 (221.76) | 980.80 (189.89) |
| Serum lithium level, mEq/L | – | 0.71 (0.16) | 0.62 (0.10) |
| Olanzapine, mg/d | 7.63 (3.86) | 12.63 (5.56) | 7.00 (3.50) |
| YMRS score | 28.50 (4.15) | 3.35 (5.55) | 1.43 (4.80) |
| CGI-S score | 5.25 (0.64) | 1.65 (0.93) | 1.21 (0.58) |
| HAM-D score | 2.40 (2.46) | 0.50 (0.95) | 0.43 (0.85) |
| MADRS score | 4.25 (2.05) | 0.45 (1.05) | 0.71 (1.27) |
| Weight (kg) | 59.50 (11.64) | 60.89 (11.87) | 59.75 (10.72) |
| Heart rate (bpm) | 81.00 (7.47) | 80.32 (5.63) | 78.00 (6.38) |
| Systolic blood pressure (mmHg) | 115.75 (10.92) | 111.67 (12.60) | 113.33 (11.55) |
| Diastolic blood pressure (mmHg) | 78.00 (7.15) | 70.83 (5.49) | 72.50 (7.83) |
| Blood glucose (mmol/L) | 4.79 (0.71) | 4.79 (0.69) | 5.12 (0.44) |
| Cholesterol (mmol/L) | 4.13 (1.01) | 4.64 (1.04) | 4.72 (1.29) |
| Triglycerides (mmol/L) | 1.17 (0.81) | 1.64 (0.95) | 1.91 (0.57) |
| Alanine aminotransferase (U/L) | 20.70 (10.39) | 43.04 (20.41) | 33.10 (22.22) |
| Aspartate aminotransferase (U/L) | 29.70 (18.41) | 34.45 (19.79) | 25.30 (10.74) |
YMRS = Young Mania Rating Scale; CGI-S = Clinical Global Impression for Bipolar Disorder-Severity; HAM-D = Hamilton Depression Rating Scale; MADRS = Montgomery-Åsberg Depression Rating Scale.
To evaluate the effect of concomitant ECT treatment on the levels of GSK3, phospho-Ser21-GSK3α and phospho-Ser9-GSK3β from all 47 medication-treated subjects were grouped as without ECT treatment and with ECT treatment. Somewhat unexpectedly, increase in phospho-Ser21-GSK3α at Week 8 was only apparent in patients without ECT treatment (nonparametric χ2 = 8.377, p = 0.004), but not in patients who received concomitant ECT treatment (Fig. 3A). For phospho-Ser9-GSK3β, although the levels in groups without ECT and with ECT both increased at Week 8 treatment (nonparametric χ2 = 13.848, p < 0.001 and χ2 = 4.363, p = 0.037, respectively), the increase tended to initiate at Week 4 treatment (χ2 = 3.054, p = 0.081) only in patients without ECT treatment (Fig. 3B). This impression was further clarified using data from patients who received lithium + olanzapine treatment, where a significant difference between groups with and without ECT was notable at Week 4 treatment (t = 2.078, p = 0.05) (Fig. 3C). Also, the lithium + olanzapine treatment significantly increased the ratio of phospho-Ser9-GSK3β to total GSK3β in subjects without ECT treatment (F = 4.302, p = 0.045), but not in subjects with ECT treatment (F = 1.336, p = 0.292).
Fig. 3.

The effect of concomitant electroconvulsive (ECT) treatment on phospho-Ser-GSK3 in peripheral blood mononuclear cells (PBMCs) of bipolar manic subjects. (A) Phospho-Ser21-GSK3α and (B) phospho-Ser9-GSK3β from PBMCs of 47 bipolar manic subjects who were grouped by without ECT (n = 27) and with ECT (n = 20) treatment. Values are expressed as ‘% Week 0’. Mean ± SEM, *p < 0.05 in ANOVA when post-treatment values are compared to Week 0. (C) Phospho-Ser9-GSK3β from lithium + olanzapine treated subjects who had no ECT treatment (n = 10 at Week 4, and n = 6 at Week 8) was compared to those who received concomitant ECT treatment (n = 10 at Week 4, and n = 7 at Week 8). Values are expressed as ‘% Week 0’, Mean ± SEM, **p < 0.05 in independent sample t-test when without-ECT treatment group was compared to with-ECT treatment group. (D) The ratio of phospho-Ser9-GSK3β to total GSK3β in lithium + olanzapine treated subjects. Mean ± SEM, *p < 0.05 in ANOVA when post-treatment values are compared to Week 0.
Discussion
The aim of this study was to test whether GSK3 level and its inhibitory serine phosphorylation in human PBMCs are altered in type I bipolar disorder patients during acute antimanic treatment. This study used PBMCs to measure GSK3 because PBMCs are composed predominantly of lymphocytes that express intracellular signal proteins and genes that are regulated by many of the same genetic and environmental influences as neurons in the brain (44, 45) and allow the testing of time-dependent signal transduction responses to pharmacological treatments in humans (46-48). We have previously found that GSK3 and several of its regulatory signaling pathways are expressed in PBMCs and that GSK3 responds to in vitro and in vivo lithium treatment (38, 49). The current study is the first to report the time-dependent response of GSK3 in PBMCs during early treatment of bipolar mania.
The key finding of this study is that antimanic treatment increases serine phosphorylation of GSK3 in PBMCs during an eight-week treatment of bipolar mania, and the increased serine phosphorylation of GSK3 is not due to a change of total GSK3. This study provides additional clinical evidence to support the cumulative findings from preclinical studies showing that lithium and other psychotropics used in mood disorders inhibit GSK3 activity by enhancing the inhibitory serine phosphorylation. As a protein kinase regulated by most pharmacological agents used in mood disorders (18, 19, 34-37), GSK3 is a promising therapeutic target for new drug development. However, limited information is available regarding its response to the clinical treatment of human mood disorders. In our previous study, we found that the level of phospho-Ser9-GSK3β in PBMCs of lithium-treated, clinically stable bipolar disorder patients was eightfold higher than healthy controls who were never exposed to lithium (38), suggesting that the activity of GSK3 in PBMCs is inactivated by lithium. In the current study, we further addressed the question of whether serine phosphorylation of GSK3 is an initial response to antimanic treatment by testing the before- and after-treatment difference in a group of bipolar manic patients. The study was designed to include only type I bipolar disorder patients during a manic episode to ensure that the treatment targeted symptom reduction in a relatively homogeneous patient group. Since these are severely ill patients, however, monotherapy with one pharmacological agent was not sufficient to rapidly reduce manic symptoms. Thus, the study used the TAU approach for effective treatment. Since lithium, valproate, and all atypical antipsychotics have been shown in preclinical animal studies to increase serine phosphorylation of GSK3 (21, 31, 34-37, 50), we hypothesized that single-agent or combination treatment with these drugs would increase serine phosphorylation of GSK3 in PBMCs. Our results largely proved the hypothesis, both when ‘all treatments’ were included and when lithium + olanzapine treatment was analyzed. We did not find a linear correlation between increased phospho-Ser9-GSK3β and YMRS improvement at either 4 or 8 weeks of treatment, and there was a small group of clinical responders whose phospho-Ser9-GSK3β did not increase during treatment. This may be due to the markedly improved YMRS scores in most subjects as a consequence of combined drug treatment and ECT; thus, the responsible treatment component that regulates GSK3 remains to be further clarified in studies using single-drug treatment. Nevertheless, among all drugs involved in this study, lithium is most likely effective in increasing serine phosphorylation of GSK3 in PBMCs since lithium freely penetrates cells and is known to directly inhibit GSK3 and increase GSK3 serine phosphorylation (18, 34, 43). To reserve all analyzable data, this study included data from 9 subjects who received treatment (5 with lithium) for 1-4 days prior to blood collection. The brief treatment time was allowed because evidence from animal studies shows that a therapeutically relevant concentration of lithium (0.8 mEq/L) increases phospho-Ser-GSK3 only after chronic treatment for 28 days (34). Although direct inhibition of GSK3 and acute increase in phospho-Ser-GSK3 can be induced by concentrations of lithium at least twice above therapeutic level (18, 21, 38), subjects in this study were treated according to standard clinical titration schedule, which was not expected to acutely change the level of phospho-Ser-GSK3. The mechanism of GSK3 regulation by valproate is less understood (43), and its effect in PBMCs as a single treatment remains to be determined. The pharmacological effect of atypical antipsychotics depends on the presence of 5-HT2A and dopamine D2 receptors on the cell surface (21, 29, 37), and the function of these receptors in PBMCs remains to be confirmed. Thus, to validate the use of PBMCs in assessing the significance of GSK3 as a therapeutic target in bipolar disorder, parallel studies of the effect of drugs in GSK3 measurements in brains and PBMCs should be conducted in animal models of bipolar disorder in future studies.
Results from this study suggest that ECT treatment may suppress or reduce pharmacologically induced increase in serine phosphorylation of GSK3, at least when both are applied in combination. ECT was applied in these bipolar manic patients mostly during the first three weeks of treatment to rapidly reduce psychosis and behavioral disturbances, but this treatment appears to delay the onset of pharmacological regulation of GSK3. If GSK3 is proved to be a mood-stabilizing therapeutic target, application of ECT during manic treatment should be initiated early and briefly for acute symptom relief, allowing sufficient time for pharmacological agents to inactivate GSK3 along the course of treatment. Electroconvulsive shock (ECS) was reported to change serine phosphorylation of GSK3 in animal brain in a biphasic manner (51, 52). After a single ECS in rats, the serine phosphorylation of GSK3β was immediately decreased, but then increased above basal level within 10 min and maintained at an increased level for more than 30 min. The early effect of ECS was thought to be the result of transient activation of protein phosphatase 2A (PP2A) to reduce GSK3 phosphorylation (53), which in conjunction with the subsequent activation of an upstream protein kinase Akt (52) causes a biphasic phosphorylation of GSK3. However, these measurements were conducted immediately after a single ECS in rats, which is not the same as repeated ECT treatment in bipolar disorder patients. If repeated activation of PP2A by ECT treatment occurs in human PBMCs, it could be a contributing factor for the observed lower level of serine phosphorylation of GSK3 in subjects with ECT treatment. Measuring PP2A activity and phosphorylation of GSK3 and other signal proteins after a series of ECT may elucidate the mechanism of this action. However, since ECT treatment specifically causes brain activation, the results observed in PBMCs may not fully reflect the response of brain GSK3 to ECT. Simultaneous measurement of GSK3 in both the brain and PBMCs after therapeutically relevant ECS application in animals may clarify this possibility.
When GSK3 in this group of severely ill manic patients was compared to that of a group of healthy controls, the between-group difference was more prominent in total GSK3α and GSK3β, whereas phospho-Ser-GSK3 showed a trend of reduction when calculated as the ratio of total GSK3. The elevated total GSK3 with a tendency for lower inhibitory serine phosphorylation suggests that the overall activity of GSK3 in bipolar manic patients is higher than in healthy controls. In another recent comparative study in a U.S. patient population including both type I and type II bipolar disorder subjects, we found prominent reduction in serine phosphorylation of GSK3, but less change in total GSK3, in PBMCs of manic and hypomanic subjects than in healthy controls (22). The two studies agree that the activity of GSK3 is higher in PBMCs of bipolar disorder patients. The different results of these two studies on the level and serine phosphorylation of GSK3 could be the results of characteristic symptoms of type I and type II bipolar disorder, chronicity of the illness, history of previous treatment, racial difference, and different environmental settings; all remain to be evaluated in larger cohort of samples. Furthermore, additional studies are needed to conclude whether the change of serine phosphorylation of GSK3 is a mood state-dependent change, whereas the change of total GSK3 is the trait of the illness. It should also be noted that changes of GSK3 expression and protein level could be tissue-specific, as an increase in total GSK3 proteins was not observed in previous studies using postmortem brains from bipolar disorder subjects (54-56), but lower GSK3 messenger RNA (mRNA) levels were found in teenage suicide victims (57) and reduced GSK3β protein levels were reported in both membrane and cytosol of platelets from bipolar disorder patients (58).
Taken together, results of this study provide clinical evidence that GSK3 is a pharmacological target of psychotropics used in bipolar disorder treatment. Additional studies utilizing a single-drug, clinically monitored design in a large cohort of racially and demographically diverse bipolar manic patients are needed to confirm this pilot finding. Proving the clinical response of GSK3 to pharmacological treatment may ultimately support the development of new drugs targeting the inhibition of GSK3.
Acknowledgments
The authors thank Dr. Richard S. Jope and Dr. Alfred A. Bartolucci for scientific advice and data analysis; Sufen Yang and Liqin Liu for technical assistance; and Dr. Jiong Luo, Dr. Yanfang Zhang, and Dr. Ling Zhang for psychiatric diagnosis. This work was supported by NARSAD Independent Research Award (Xiaohua Li) and Beijing Excellent Talents Fund (Gang Wang).
Xiaohua Li currently receives research funding from NIH, Ortho-McNeil-Janssen, and Otsuka.
Footnotes
Xiaohong Li, Min Liu, Zhuoji Cai, and Gang Wang have no conflicts of interest to report.
References
- 1.Sanchez-Moreno J, Martínez-Arán A, Tabares-Seisdedos R, Torrent C, Vieta E, Ayuso-Mateos JL. Functioning and disability in bipolar disorder: an extensive review. Psychother Psychosom. 2009;78:285–297. doi: 10.1159/000228249. [DOI] [PubMed] [Google Scholar]
- 2.Post RM, Denicoff KD, Leverich GS, et al. Morbidity in 258 bipolar outpatients followed for 1 year with daily prospective ratings on the NIMH life chart method. J Clin Psychiatry. 2003;64:680–690. doi: 10.4088/jcp.v64n0610. [DOI] [PubMed] [Google Scholar]
- 3.Lish JD, Dime-Meenan S, Whybrow PC, Price RA, Hirschfeld RM. The National Depressive and Manic-depressive Association (DMDA) survey of bipolar members. J Affect Disord. 1994;31:281–294. doi: 10.1016/0165-0327(94)90104-x. [DOI] [PubMed] [Google Scholar]
- 4.Martinowich K, Schloesser RJ, Manji HK. Bipolar disorder: from genes to behavior pathways. J Clin Invest. 2009;119:726–736. doi: 10.1172/JCI37703. [DOI] [PMC free article] [PubMed] [Google Scholar]
- 5.Gold PW, Chrousos GP. Organization of the stress system and its dysregulation in melancholic and atypical depression: high vs low CRH/NE states. Mol Psychiatry. 2002;7:254–275. doi: 10.1038/sj.mp.4001032. [DOI] [PubMed] [Google Scholar]
- 6.Pittenger C, Duman RS. Stress, depression, and neuroplasticity: a convergence of mechanisms. Neuropsychopharmacology. 2008;33:88–109. doi: 10.1038/sj.npp.1301574. [DOI] [PubMed] [Google Scholar]
- 7.Gould TD, Einat H. Animal models of bipolar disorder and mood stabilizer efficacy: a critical need for improvement. Neurosci Biobehav Rev. 2007;31:825–831. doi: 10.1016/j.neubiorev.2007.05.007. [DOI] [PMC free article] [PubMed] [Google Scholar]
- 8.Woodgett JR. Molecular cloning and expression of glycogen synthase kinase-3/factor A. Embo J. 1990;9:2431–2438. doi: 10.1002/j.1460-2075.1990.tb07419.x. [DOI] [PMC free article] [PubMed] [Google Scholar]
- 9.Hoeflich KP, Luo J, Rubie EA, Tsao MS, Jin O, Woodgett JR. Requirement for glycogen synthase kinase-3beta in cell survival and NF-kappaB activation. Nature. 2000;406:86–90. doi: 10.1038/35017574. [DOI] [PubMed] [Google Scholar]
- 10.Liang MH, Chuang DM. Regulation and function of glycogen synthase kinase-3 isoforms in neuronal survival. J Biol Chem. 2007;282:3904–3917. doi: 10.1074/jbc.M605178200. [DOI] [PubMed] [Google Scholar]
- 11.Liang MH, Chuang DM. Differential roles of glycogen synthase kinase-3 isoforms in the regulation of transcriptional activation. J Biol Chem. 2006;281:30479–30484. doi: 10.1074/jbc.M607468200. [DOI] [PubMed] [Google Scholar]
- 12.Wang QM, Park IK, Fiol CJ, Roach PJ, DePaoli-Roach AA. Isoform differences in substrate recognition by glycogen synthase kinases 3 alpha and 3 beta in the phosphorylation of phosphatase inhibitor 2. Biochemistry. 1994;33:143–147. doi: 10.1021/bi00167a018. [DOI] [PubMed] [Google Scholar]
- 13.Phiel CJ, Wilson CA, Lee VM, Klein PS. GSK-3alpha regulates production of Alzheimer's disease amyloid-beta peptides. Nature. 2003;423:435–439. doi: 10.1038/nature01640. [DOI] [PubMed] [Google Scholar]
- 14.Force T, Woodgett JR. Unique and overlapping functions of GSK-3 isoforms in cell differentiation and proliferation and cardiovascular development. J Biol Chem. 2009;284:9643–9647. doi: 10.1074/jbc.R800077200. [DOI] [PMC free article] [PubMed] [Google Scholar]
- 15.Chen L, Salinas GD, Li X. Regulation of serotonin 1B receptor by glycogen synthase kinase-3. Mol Pharmacol. 2009;76:1150–1161. doi: 10.1124/mol.109.056994. [DOI] [PMC free article] [PubMed] [Google Scholar]
- 16.Frame S, Cohen P. GSK3 takes centre stage more than 20 years after its discovery. Biochem J. 2001;359:1–16. doi: 10.1042/0264-6021:3590001. [DOI] [PMC free article] [PubMed] [Google Scholar]
- 17.Jope RS, Johnson GVW. The glamour and gloom of glycogen synthase kinase-3. Trends in Biochemical Sci. 2004;29:95–102. doi: 10.1016/j.tibs.2003.12.004. [DOI] [PubMed] [Google Scholar]
- 18.Klein PS, Melton DA. A molecular mechanism for the effect of lithium on development. Proc Natl Acad Sci U S A. 1996;93:8455–8459. doi: 10.1073/pnas.93.16.8455. [DOI] [PMC free article] [PubMed] [Google Scholar]
- 19.Stambolic V, Ruel L, Woodgett JR. Lithium inhibits glycogen synthase kinase-3 activity and mimics wingless signalling in intact cells. Curr Biol. 1996;6:1664–1668. doi: 10.1016/s0960-9822(02)70790-2. [DOI] [PubMed] [Google Scholar]
- 20.Prickaerts J, Moechars D, Cryns K, et al. Transgenic mice overexpressing glycogen synthase kinase 3beta: a putative model of hyperactivity and mania. J Neurosci. 2006;26:9022–9029. doi: 10.1523/JNEUROSCI.5216-05.2006. [DOI] [PMC free article] [PubMed] [Google Scholar]
- 21.Beaulieu JM, Sotnikova TD, Yao WD, et al. Lithium antagonizes dopamine-dependent behaviors mediated by an AKT/glycogen synthase kinase 3 signaling cascade. Proc Natl Acad Sci U S A. 2004;101:5099–5104. doi: 10.1073/pnas.0307921101. [DOI] [PMC free article] [PubMed] [Google Scholar]
- 22.Polter AM, Beurel E, Yang S, et al. Deficiency in the inhibitory serine-phosphorylation of glycogen synthase kinase-3 increases sensitivity to mood disturbances. Neuropsychopharmacology. 2010;35:1761–1774. doi: 10.1038/npp.2010.43. [DOI] [PMC free article] [PubMed] [Google Scholar]
- 23.Gould TD, Einat H, Bhat R, Manji HK. AR-A014418, a selective GSK-3 inhibitor, produces antidepressant-like effects in the forced swim test. Int J Neuropsychopharmacol. 2004;7:387–390. doi: 10.1017/S1461145704004535. [DOI] [PubMed] [Google Scholar]
- 24.O'Brien WT, Harper AD, Jove F, Woodgett JR, et al. Glycogen synthase kinase-3beta haploinsufficiency mimics the behavioral and molecular effects of lithium. J Neurosci. 2004;24:6791–6798. doi: 10.1523/JNEUROSCI.4753-03.2004. [DOI] [PMC free article] [PubMed] [Google Scholar]
- 25.Beaulieu JM, Zhang X, Rodriguiz RM, et al. Role of GSK3 beta in behavioral abnormalities induced by serotonin deficiency. Proc Natl Acad Sci U S A. 2008;105:1333–1338. doi: 10.1073/pnas.0711496105. [DOI] [PMC free article] [PubMed] [Google Scholar]
- 26.Kaidanovich-Beilin O, Milman A, Weizman A, Pick CG, Eldar-Finkelman H. Rapid antidepressive-like activity of specific glycogen synthase kinase-3 inhibitor and its effect on beta-catenin in mouse hippocampus. Biol Psychiatry. 2004;55:781–784. doi: 10.1016/j.biopsych.2004.01.008. [DOI] [PubMed] [Google Scholar]
- 27.Rosa AO, Kaster MP, Binfare RW, et al. Antidepressant-like effect of the novel thiadiazolidinone NP031115 in mice. Prog Neuropsychopharmacol Biol Psychiatry. 2008;32:1549–1556. doi: 10.1016/j.pnpbp.2008.05.020. [DOI] [PubMed] [Google Scholar]
- 28.Frame S, Cohen P, Biondi RM. A common phosphate binding site explains the unique substrate specificity of GSK3 and its inactivation by phosphorylation. Mol Cell. 2001;7:1321–1327. doi: 10.1016/s1097-2765(01)00253-2. [DOI] [PubMed] [Google Scholar]
- 29.Li X, Zhu W, Roh MS, Friedman AB, Rosborough K, Jope RS. In vivo regulation of glycogen synthase kinase-3beta (GSK3beta) by serotonergic activity in mouse brain. Neuropsychopharmacology. 2004;29:1426–1431. doi: 10.1038/sj.npp.1300439. [DOI] [PMC free article] [PubMed] [Google Scholar]
- 30.Mai L, Jope RS, Li X. BDNF-mediated signal transduction is modulated by GSK3beta and mood stabilizing agents. J Neurochem. 2002;82:75–83. doi: 10.1046/j.1471-4159.2002.00939.x. [DOI] [PubMed] [Google Scholar]
- 31.Phiel CJ, Klein PS. Molecular targets of lithium action. Annu Rev Pharmacol Toxicol. 2001;41:789–813. doi: 10.1146/annurev.pharmtox.41.1.789. [DOI] [PubMed] [Google Scholar]
- 32.Rowe MK, Wiest C, Chuang DM. GSK-3 is a viable potential target for therapeutic intervention in bipolar disorder. Neurosci Biobehav Rev. 2007;31:920–931. doi: 10.1016/j.neubiorev.2007.03.002. [DOI] [PMC free article] [PubMed] [Google Scholar]
- 33.Beaulieu JM, Gainetdinov RR, Caron MG. Akt/GSK3 signaling in the action of psychotropic drugs. Annu Rev Pharmacol Toxicol. 2009;49:327–347. doi: 10.1146/annurev.pharmtox.011008.145634. [DOI] [PubMed] [Google Scholar]
- 34.De Sarno P, Li X, Jope RS. Regulation of Akt and glycogen synthase kinase-3 beta phosphorylation by sodium valproate and lithium. Neuropharmacology. 2002;43:1158–1164. doi: 10.1016/s0028-3908(02)00215-0. [DOI] [PubMed] [Google Scholar]
- 35.Chen G, Huang LD, Jiang YM, Manji HK. The mood-stabilizing agent valproate inhibits the activity of glycogen synthase kinase-3. J Neurochem. 1999;72:1327–1330. doi: 10.1046/j.1471-4159.2000.0721327.x. [DOI] [PubMed] [Google Scholar]
- 36.Kozlovsky N, Amar S, Belmaker RH, Agam G. Psychotropic drugs affect Ser9-phosphorylated GSK-3beta protein levels in rodent frontal cortex. Int J Neuropsychopharmacol. 2006;9:337–342. doi: 10.1017/S1461145705006097. [DOI] [PubMed] [Google Scholar]
- 37.Li X, Rosborough KM, Friedman AB, Zhu W, Roth KA. Regulation of mouse brain glycogen synthase kinase-3 by atypical antipsychotics. Int J Neuropsychopharmacol. 2007;10:7–19. doi: 10.1017/S1461145706006547. [DOI] [PubMed] [Google Scholar]
- 38.Li X, Friedman AB, Zhu W, et al. Lithium regulates glycogen synthase kinase-3beta in human peripheral blood mononuclear cells: implication in the treatment of bipolar disorder. Biol Psychiatry. 2007;61:216–222. doi: 10.1016/j.biopsych.2006.02.027. [DOI] [PMC free article] [PubMed] [Google Scholar]
- 39.Young RC, Biggs JT, Ziegler VE, Meyer DA. A rating scale for mania: reliability, validity and sensitivity. Br J Psychiatry. 1978;133:429–435. doi: 10.1192/bjp.133.5.429. [DOI] [PubMed] [Google Scholar]
- 40.Montgomery SA, Åsberg M. A new depression scale designed to be sensitive to change. British Journal of Psychiatry. 1979;134:382–389. doi: 10.1192/bjp.134.4.382. [DOI] [PubMed] [Google Scholar]
- 41.Hamilton M. A rating scale for depression. J Neurol Neurosurg Psychiatry. 1960;23:56–62. doi: 10.1136/jnnp.23.1.56. [DOI] [PMC free article] [PubMed] [Google Scholar]
- 42.Spearing MK, Post RM, Leverich GS, Brandt D, Nolen W. Modification of the Clinical Global Impressions (CGI) scale for use in bipolar illness (BP): the CGI-BP. Psychiatry Res. 1997;73:159–171. doi: 10.1016/s0165-1781(97)00123-6. [DOI] [PubMed] [Google Scholar]
- 43.Li X, Jope RS. Is glycogen synthase kinase-3 a central modulator in mood regulation? Neuropsychopharmacology. 2010;35:2143–2154. doi: 10.1038/npp.2010.105. [DOI] [PMC free article] [PubMed] [Google Scholar]
- 44.Gladkevich A, Kauffman HF, Korf J. Lymphocytes as a neural probe: potential for studying psychiatric disorders. Prog Neuropsychopharmacol Biol Psychiatry. 2004;28:559–576. doi: 10.1016/j.pnpbp.2004.01.009. [DOI] [PubMed] [Google Scholar]
- 45.Tsuang MT, Nossova N, Yager T, et al. Assessing the validity of blood-based gene expression profiles for the classification of schizophrenia and bipolar disorder: a preliminary report. Am J Med Genet B Neuropsychiatr Genet. 2005;133:1–5. doi: 10.1002/ajmg.b.30161. [DOI] [PubMed] [Google Scholar]
- 46.Fisar Z, Raboch J. Depression, antidepressants, and peripheral blood components. Neuro Endocrinol Lett. 2008;29:17–28. [PubMed] [Google Scholar]
- 47.Naydenov AV, MacDonald ML, Ongur D, Konradi C. Differences in lymphocyte electron transport gene expression levels between subjects with bipolar disorder and normal controls in response to glucose deprivation stress. Arch Gen Psychiatry. 2007;64:555–564. doi: 10.1001/archpsyc.64.5.555. [DOI] [PubMed] [Google Scholar]
- 48.Anitha A, Nakamura K, Yamada K, et al. Gene and expression analyses reveal enhanced expression of pericentrin 2 (PCNT2) in bipolar disorder. Biol Psychiatry. 2008;63:678–685. doi: 10.1016/j.biopsych.2007.07.010. [DOI] [PubMed] [Google Scholar]
- 49.Castri P, Iacovelli L, De Blasi A, et al. Reduced insulin-induced phosphatidylinositol-3-kinase activation in peripheral blood mononuclear leucocytes from patients with Alzheimer's disease. Eur J Neurosci. 2007;26:2469–2472. doi: 10.1111/j.1460-9568.2007.05869.x. [DOI] [PubMed] [Google Scholar]
- 50.Chalecka-Franaszek E, Chuang DM. Lithium activates the serine/threonine kinase Akt-1 and suppresses glutamate-induced inhibition of Akt-1 activity in neurons. Proc Natl Acad Sci U S A. 1999;96:8745–8750. doi: 10.1073/pnas.96.15.8745. [DOI] [PMC free article] [PubMed] [Google Scholar]
- 51.Roh MS, Kang UG, Shin SY, et al. Biphasic changes in the Ser-9 phosphorylation of glycogen synthase kinase-3beta after electroconvulsive shock in the rat brain. Prog Neuropsychopharmacol Biol Psychiatry. 2003;27:1–5. doi: 10.1016/s0278-5846(02)00307-x. [DOI] [PubMed] [Google Scholar]
- 52.Kang UG, Roh MS, Jung JR, et al. Activation of protein kinase B (Akt) signaling after electroconvulsive shock in the rat hippocampus. Prog Neuropsychopharmacol Biol Psychiatry. 2004;28:41–44. doi: 10.1016/S0278-5846(03)00173-8. [DOI] [PubMed] [Google Scholar]
- 53.Kang UG, Jeon WJ, Kim Y, et al. Transient activation of protein phosphatase 2A induced by electroconvulsive shock in the rat frontal cortex. Neurosci Lett. 2005;390:171–175. doi: 10.1016/j.neulet.2005.08.020. [DOI] [PubMed] [Google Scholar]
- 54.Lesort M, Greendorfer A, Stockmeier C, Johnson GV, Jope RS. Glycogen synthase kinase-3beta, beta-catenin, and tau in postmortem bipolar brain. J Neural Transm. 1999;106:1217–1222. doi: 10.1007/s007020050235. [DOI] [PubMed] [Google Scholar]
- 55.Kozlovsky N, Belmaker RH, Agam G. Low GSK-3beta immunoreactivity in postmortem frontal cortex of schizophrenic patients. Am J Psychiatry. 2000;157:831–833. doi: 10.1176/appi.ajp.157.5.831. [DOI] [PubMed] [Google Scholar]
- 56.Agam G, Shatiel G, Kozlovsky N, Shimon H, Belmaker RH. Lithium inhibitable enzymes in postmortem brain of bipolar patients. J Psychiatr Res. 2003;37:433–442. doi: 10.1016/s0022-3956(03)00044-x. [DOI] [PubMed] [Google Scholar]
- 57.Pandey GN, Dwivedi Y, Rizavi HS, et al. GSK-3beta gene expression in human postmortem brain: regional distribution, effects of age and suicide. Neurochem Res. 2009;34:274–285. doi: 10.1007/s11064-008-9770-1. [DOI] [PubMed] [Google Scholar]
- 58.Pandey GN, Ren X, Rizavi HS, Dwivedi Y. Glycogen synthase kinase-3beta in the platelets of patients with mood disorders: effect of treatment. J Psychiatr Res. 2010;44:143–148. doi: 10.1016/j.jpsychires.2009.07.009. [DOI] [PubMed] [Google Scholar]