Abstract
The Wnt signaling pathway is a robust regulator of skeletal homeostasis. Gain-of-function mutations promote high bone mass, whereas loss of Lrp5 or Lrp6 co-receptors decrease bone mass. Similarly, mutations in antagonists of Wnt signaling influence skeletal integrity, in an inverse relation to Lrp receptor mutations. Loss of the Wnt antagonist Sclerostin (Sost) produces the generalized skeletal hyperostotic condition of sclerosteosis, which is characterized by increased bone mass and density due to hyperactive osteoblast function. Here we demonstrate that prostaglandin E2 (PGE2), a paracrine factor with pleiotropic effects on osteoblasts and osteoclasts, decreases Sclerostin expression in osteoblastic UMR106.01 cells. Decreased Sost expression correlates with increased expression of Wnt/TCF target genes Axin2 and Tcf3. We also show that the suppressive effect of PGE2 is mediated through a cyclic AMP/PKA pathway. Furthermore, selective agonists for the PGE2 receptor EP2 mimic the effect of PGE2 upon Sost, and siRNA reduction in Ptger2 prevents PGE2-induced Sost repression. These results indicate a functional relationship between prostaglandins and the Wnt/β-catenin signaling pathway in bone.
Introduction
There remains considerable effort dedicated toward understanding the signaling pathways that promote skeletal anabolism. Prostaglandins (PG), such as prostaglandin E2 (PGE2), mediate osteoprogenitor proliferation [1], [2], [3] and differentiation [4], [5]. Mechanical loading in vitro and in vivo induces expression of the enzyme responsible for PG synthesis, COX-2 [6], [7], [8], whose function is required for load-induced bone formation [9], [10]. Similarly, PG administration in vivo increases bone mass via periosteal and endosteal responses [11]. Further, inhibition of PG synthesis delays fracture healing [12], [13] and promotes the formation of non-unions [14], [15], whereas localized PGE2 enhances bone healing [16], [17], [18], [19].
Osteoblast differentiation is also regulated by the Wnt signaling pathway [20]. Binding of Wnt ligands to a complex of Frizzled and Lrp5 or Lrp6 co-receptors promotes the stabilization of the transcription factor β-catenin, formation of a complex with TCF/LEF, and induction of Wnt target genes like Axin2 and Tcf3 [21], [22]. Activating mutations in Lrp5 cause high bone mass [23], , whereas Lrp5 deletion decreases bone mass [25], [26] and prevents load-induced bone formation [27]. Control of Wnt signaling involves sequestration of Wnts by soluble decoy receptors like sFRPs [28], [29], or Lrp5 antagonists, like Dkk1 and Sclerostin.
Deletion of the gene encoding Sclerostin (Sost) causes a rare sclerosing bone dysplasia, sclerosteosis (OMIM ID 269500) in both humans and murine knockout models [30], [31], [32], [33]; a related disease, van Buchem's disease (OMIM ID 239100), is caused by a distal noncoding deletion that removes regulatory elements required for the transcriptional of the Sost gene in adult bone [32]. Both sclerosteosis and van Buchem disease are characterized by general skeletal hyperostosis owing to hyperactive osteoblast activity. In contrast, over-expression of Sost causes osteopenia [34], [35] and limb deformities [36]. Mechanistically, Sclerostin was initially characterized as a BMP antagonist [34], [37], [49], but more recent reports recognize it as a potent Wnt antagonist that binds to Lrp5 and Lrp6 [38], [39], [40], [41] to increase the rate of receptor internalization [42]. Keller and Kneissel showed that PTH reduces Sost expression via PKA [43], as did Bellido et al. [44], and we have previously demonstrated that the regulatory element ECR5 contained within the van Buchem deletion region is necessary for bone-specific Sost expression in transgenic mice [35], and confers PTH responsiveness, in vitro [45]. Recently, we have also shown that a Sost null mutation partially rescues the Lrp6+/− skeletal phenotype in Sost−/−;Lrp6+/− animals [36].
Whereas both prostaglandins and Wnt signaling have parallel functions during bone anabolism, there is limited evidence for cross-talk between these two signaling pathways in pre-osteoblasts and in transformed cells. In this study, we examined the influence of PGE2 on Sclerostin transcription and Wnt signaling, in osteoblastic cells. We demonstrate that prostaglandin E2, a long-recognized regulator of osteoblast and osteoclast formation activity, decreases Sost expression and thereby increases Wnt signaling in osteoblastic cells. We also show that PGE2 transcriptional effect on Sost is mediated through the EP2 receptor (Ptger2) and cAMP, and involves mitigation of endogenous BMP and Mef2 signaling. These results attribute a novel function of prostaglandins in the regulation of Wnt signaling via suppression of the Wnt antagonist Sclerostin.
Results
Prostaglandin E2 decreases Sost transcription
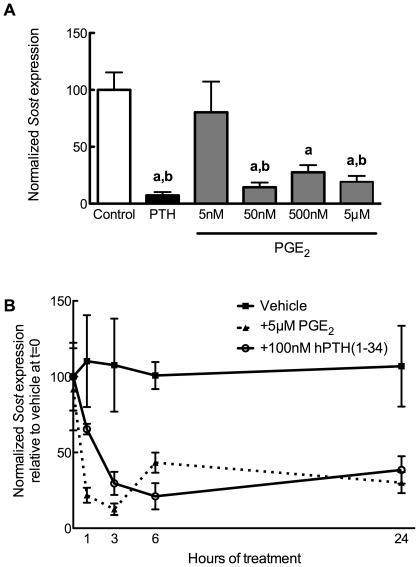
Although both prostaglandins and Wnt signaling have been characterized as robust regulators of skeletal formation and homeostasis [9], [24], [46], [47], [48], there is sparse evidence whether there is direct interaction between these pathways. To that end, we first sought whether PGE2 demonstrated an effect upon the transcription of Sclerostin. To test this, UMR106.01 cells were chosen, as they phenotypically resemble mature osteoblasts and express high levels of Sost [43], [50], [51]. UMR106.01 cells were treated with 5 nM–5 µM PGE2 for 3 hours, after which time RNA was collected and analyzed via quantitative PCR (qPCR) for Sost expression. There was no influence of 5 nM PGE2 on Sost expression, while there was steady and progressive decrease in Sost levels upon 50 nM–5 µM PGE2 treatment ( Figure 1A ). This inhibitory effect upon Sost was not observed when cells were treated with another osteotropic prostaglandin, PGF2α (5 nM–5 µM; data not shown). The inhibitory effect of PGE2 was rapid, with statistically significant suppression of Sost observed after one hour of treatment, and this was maintained throughout 24 hours of culture ( Figure 1B ).
Figure 1. PGE2 decreases Sost expression.
(A) Human PTH(1–34) (100 nM) or PGE2 (5 nM–5 µM) or vehicle control (0.05% DMSO) was added to UMR 106.01 cells for 3 hours. Total RNA was collected and analyzed for Sost and Rpl32 expression by qPCR. n = 6–10 samples per treatment. a indicates p<0.05 versus Control; b indicates P<0.05 versus 5 nM PGE2. (B) Sost mRNA expression was quantified in UMR 106.01 cells after 0, 1, 2, 3, 6, or 24 hours treatment with 5 µM PGE2 or vehicle control. n = 4 samples per treatment. For PGE2, each time point is significantly different (p<0.05) from Control, while for PTH, every time point except 1 hr is significantly different (p<0.05) from Control.
Prostaglandin E2 influences Wnt signaling without affecting Dkk1
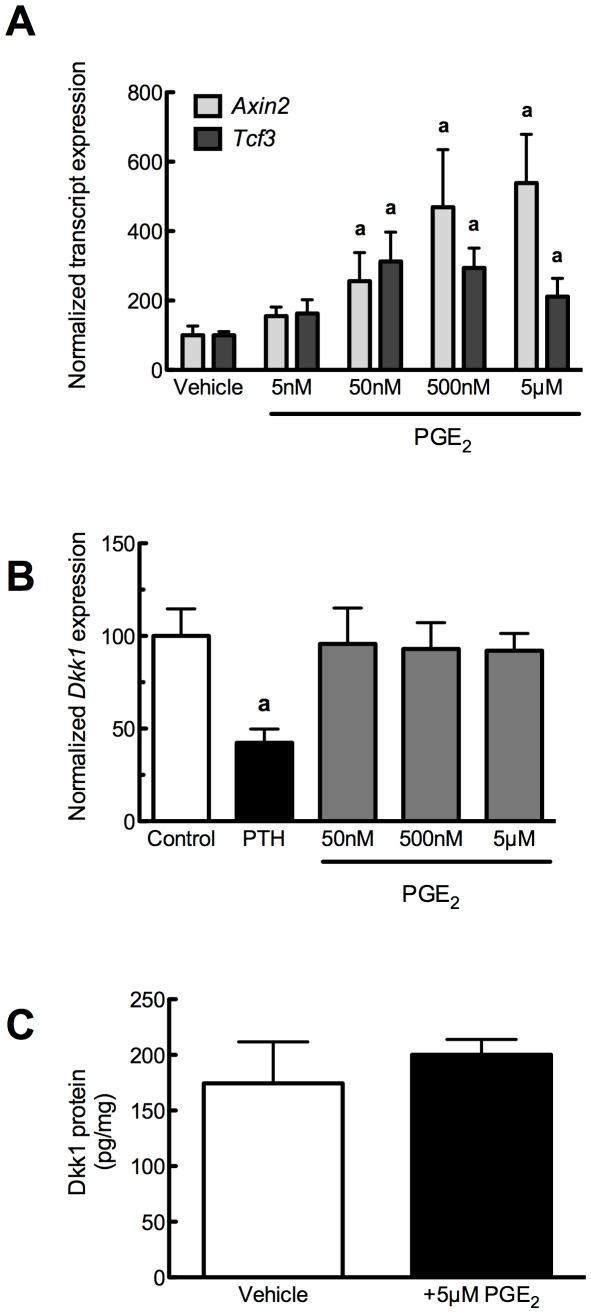
Functional decrease in the expression of the Wnt antagonist Sost should effectively increase markers of β-catenin/TCF signaling, such as Axin2 and Tcf3. To that end, we observed that PGE2, in the same dosing range that decreased Sost, significantly increased Axin2 and Tcf3 expression after 24 hour culture ( Figure 2A ), suggesting that PGE2-induced decreases in Sost removed a suppressive effect of endogenous Wnt antagonists upon osteoblast function. Dickkopf1 (Dkk1) inhibits Wnt signaling in the same manner as does Sclerostin [42]. Whereas 50 nM–5 µM PGE2 dramatically reduced Sost transcript and protein (not shown) levels, PGE2 had no effect on Dkk1 transcript ( Figure 2B ) nor its protein ( Figure 2C ) expression, suggesting that Sost repression is the primary mechanism of enhanced Wnt signaling in response to PGE2 treatment.
Figure 2. PGE2 increases Wnt signaling without affecting Dkk1.
(A) PGE2 (5 nM–5 µM) or vehicle control (0.05% DMSO) was added to UMR 106.01 cells for 24 hours. Total RNA was collected and analyzed for Axin2, Tcf3, and Rpl32 expression by qPCR. n = 4 samples. Compared to vehicle control, a indicates p<0.05. (B) Human PTH(1–34) (100 nM) or PGE2 (50 nM–5 µM) or vehicle control (0.05% DMSO) was added to UMR 106.01 cells for 3 hours. Total RNA was collected and analyzed for Dkk1 and Rpl32 expression by qPCR. n = 8 samples. Compared to vehicle control, a indicates p<0.05.
PGE2 decreases Sost through cAMP-dependent mechanisms
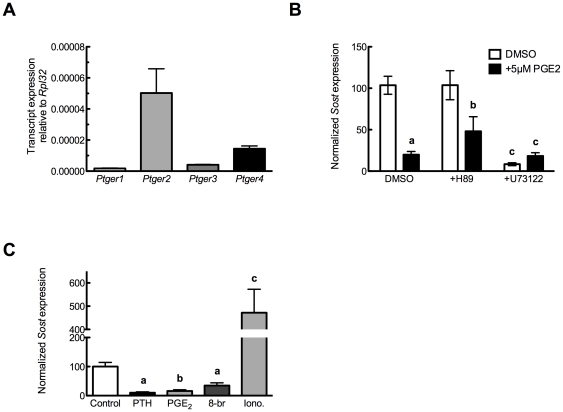
UMR 106.01 cells express all four classes of PGE2 receptors (EP1–EP4, encoded by Ptger1–Ptger4; Figure 3A ), which are linked to the synthesis or mobilization of cAMP and Ca2+ i. EP2 and EP4 increase cAMP levels, while EP1 increases Ca2+ i through a PLC-dependent mechanism; EP3 increases Ca2+ i and decreases cAMP [52]. To define which receptor(s) are responsible for mediating the suppressive effects of PGE2 upon Sost, UMR 106.01 cells were treated with 5 µM PGE2 in the presence of antagonists of protein kinase A (H-89, 2.5 µM) or phospolipase C (U73122, 10 µM) for 3 hours, after which time total RNA was collected and analyzed for Sost levels. In the absence of PGE2, inhibition of PLC/IP3/Ca2+ i signaling decreased basal Sost levels ( Figure 3B ), suggesting that release of intracellular calcium is important for maintaining Sost expression. In the presence of PGE2, the addition of H-89 appeared to attenuate PGE2-induced Sost suppression ( Figure 3B ) although this did not reach statistical significance (p<0.1 versus 5 µM PGE2 alone). In contrast, the addition of PGE2 to U73122-treated cells demonstrated no change compared to U73122 alone. The role of cAMP and Ca2+ i mobilization in suppressing Sost was tested using selective agonists. UMR106.01 cells treated with the cAMP mimetic 8-bromo-cAMP (1 mM) demonstrated similar suppression of Sost as 5 µM PGE2-treated cells ( Figure 3C ), whereas 1.3 µM ionomycin treatment significantly increased Sost expression. These data indicate that PGE2 receptors linked to increased cAMP—Ptger2 or Ptger4—are involved in the capacity for PGE2 to decrease Sost.
Figure 3. PGE2 receptor expression and influence of PGE2 selective agonists upon Sost expression.
(A) UMR106.01 cells analyzed for Ptger1, Ptger2, Ptger3, and Ptger4 transcript expression by qPCR. Data are normalized to Rpl32. n = 4 samples. (B) UMR106.01 cells were cultured with DMSO as vehicle control, 100 nM hPTH(1–34), 5 µM PGE2 in the presence and absence of inhibitors of protein kinase A (H-89, 2.5 µM) or phospholipase C (U73122, 10 µM), for 3 hours. Total RNA was analyzed for Sost and normalized to Rpl32. n = 4–8 samples. Compared to solvent control, a indicates p<.001 and b indicates p<0.05; c indicates p<.001. (C) UMR106.01 cells were cultured with DMSO as vehicle control, 100 nM hPTH(1–34), the cell-permeant cyclic AMP analogue 8-br-cAMP (1 mM) or the calcium ionophore ionomycin (1.3 µM) for 3 hours, after which total RNA was collected and analyzed for Sost and Rpl32. n = 4–8 samples. Versus Control, a indicates p<0.05, b indicates p<0.01, and c indicates p<0.001.
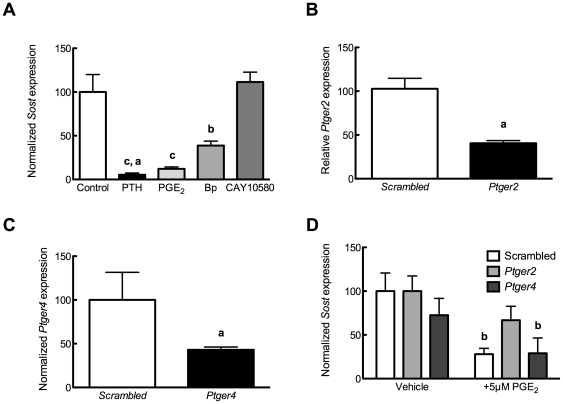
Specific agonists for EP2 (butaprost, [53]) or EP4 (CAY10580, [54]) were also tested for their ability to mimic the suppressive effects of PGE2 on Sost transcription. Butaprost mimicked the ability of PGE2 to decrease Sost, whereas CAY10580 had no effect on Sost levels ( Figure 4A ). siRNA directed against Ptger2 ( Figure 4B ) or Ptger4 ( Figure 4C ) reproducibly decreased target transcript expression by 60% relative to non-silencing, scrambled siRNAs. Knock-down of Ptger2, but not Ptger4, significantly impaired the ability of PGE2 to suppress Sost expression ( Figure 4D ), indicating the requirement for the Ptger2 receptor for PGE2-specific activation of Wnt signaling.
Figure 4. PGE2 signals through Ptger2 to decrease Sost expression.
(A) Cells were cultured for 3 hours in the presence of PTH (100 nM), PGE2, EP2 agonist butaprost, or EP4 agonist CAY10580 (each 500 nM). Sost expression was analyzed by qPCR and normalized to Rpl32. n = 5 samples. Compared to vehicle control, b indicates p<0.01 and c indicates p<0.001; a indicates p<0.01 versus CAY10580. (B) UMR106.01 cells were cultured with 50 nM of scrambled or Ptger2 siRNA for 48 hours, after which Ptger2 expression was examined by qPCR. n = 4 samples. Compared to vehicle control, a indicates p<0.05. (C) UMR106.01 cells were cultured with 50 nM of scrambled or Ptger4 siRNA for 48 hours, after which Ptger4 expression was examined by qPCR. n = 4 samples. Compared to vehicle control, a indicates p<0.05. (D) UMR106.01 cells were cultured with 50 nM of scrambled, Ptger2, or Ptger4 siRNA for 48 hours, then with 5 µM PGE2 for 3 hours, after which time total RNA was collected and analyzed for Sost and Rpl32. n = 5 samples. Compared to vehicle control, b indicates p<0.01.
Cycloheximide, but not Actinomycin D, influences PGE2 suppression of Sclerostin
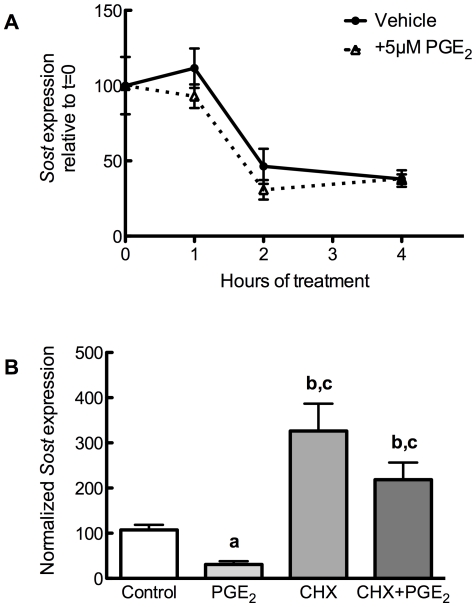
We examined the transcriptional and translational mechanisms whereby PGE2 regulates Sost expression. UMR106.01 cells were treated with 5 µM PGE2 for 3 hours in the presence or absence of the RNA polymerase II inhibitor Actinomycin D (2.5 µg/mL), after which time total RNA was collected and analyzed. The suppressive influence of PGE2 on Sost transcription was consistent in cells treated with or without actinomycin D ( Figure 5A ), indicating that PGE2 does not promote the degradation of Sost transcript.
Figure 5. Effects of actinomycin D or cycloheximide upon PGE2 suppression of Sclerostin.
(A) UMR106.01 cells were serum-starved for 1 hour, treated with 2.5 µg/mL actinomycin D with or without 5 µM PGE2, and collected 3 hours later. cDNA was prepared for qPCR analysis of Sost and Rpl32. n = 4 samples. (B) UMR 106.01 cells were treated with combinations of 10 µg/mL cycloheximide and 5 µM PGE2 for 3 hours. Samples were analyzed by qPCR for Sost and Rpl32. n = 4 samples. Compared to vehicle control, a indicates p<0.05 and b indicates p<0.001; compared to 5 µM PGE2, c indicates p<0.001.
Next, UMR106.01 cells were treated with or without 5 µM PGE2 for 3 hours in the presence or absence of the protein translation inhibitor cycloheximide (CHX; 10 µg/mL). In the absence of PGE2, CHX increased Sost transcript ( Figure 5B ); in cells treated with PGE2 and CHX, there was no suppressive effect of PGE2 upon Sost expression, indicating that PGE2 requires de novo protein synthesis in order to decrease Sost. Similar results were observed after 1 hour of CHX or PGE2 treatment (data not shown).
Transcriptional regulation of Sost by PGE2 does not involve Mef2 or BMPs
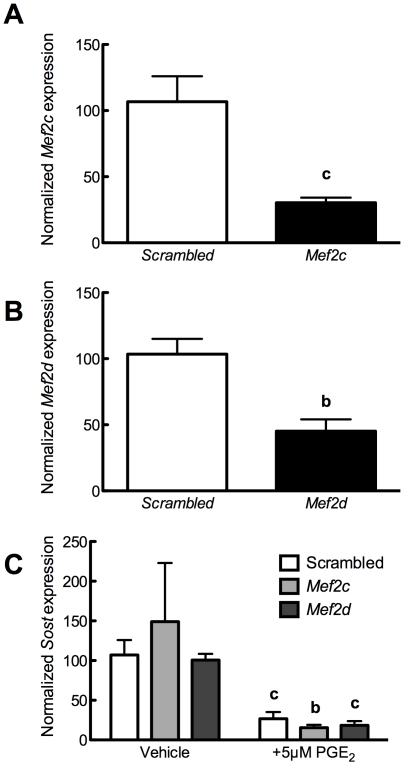
We have previously demonstrated that the MEF2 family of transcription factors are responsible for sensitizing the Sost distal enhancer ECR5 to PTH [45]. We employed siRNA against Mef2c or Mef2d in order to determine whether these transcription factors are involved in the capacity for PGE2 to decrease Sost. 48 hours after transfection, expression of Mef2c ( Figure 6A ) and Mef2d ( Figure 6B ) was reduced approximately 70% and 55%, respectively, compared to scrambled siRNA controls. Knock-down of Mef2c or Mef2d did not alter the ability of 5 µM PGE2 to decrease Sost transcript ( Figure 6C ), suggesting that PGE2 does not decrease Sost expression by disrupting Mef2 activity.
Figure 6. Reductions in MEF2 expression do not impair PGE2 decrease of Sost.
(A) UMR106.01 cells were cultured with 50 nM of scrambled or Ptger4 siRNA for 48 hours, after which Mef2c expression was examined by qPCR. n = 4 samples. Compared to scrambled control, c indicates p<0.001. (B) UMR106.01 cells were cultured with 50 nM of scrambled or Ptger4 siRNA for 48 hours, after which Mef2d expression was examined by qPCR. n = 4 samples. Compared to scrambled control, c indicates p<0.01. (C) UMR106.01 cells were cultured with 50 nM of scrambled, Mef2c, or Mef2d siRNA for 48 hours, then with 5 µM PGE2 for 3 hours, after which time total RNA was collected and analyzed for Sost and Rpl32. n = 5 samples. Compared to target siRNA control, b indicates p<0.01 and c indicates p<0.001.
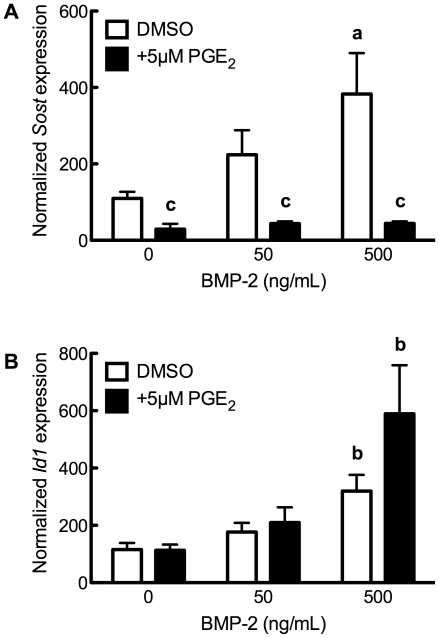
We, and others, have previously demonstrated the transcriptional influence of bone morphogenetic proteins on Sost: exogenous BMPs or constitutively-active BMP receptor 1A increase Sost expression [50], [51], [55], whereas dominant-negative BMP Receptor 1A decreases Sost transcription [55]. To examine whether PGE2 signaling disrupted BMP induction of Sost, UMR106.01 cells co-cultured with 5 µM PGE2 and BMP-2 (0–500 ng/mL) for 3 hours. BMP-2-treated cells increased Sost expression ( Figure 7A ), whereas co-culture with PGE2 prevented Sost induction. BMP-2 increased Id1, a direct Smad target gene, independent of PGE2 ( Figure 7B ), indicating that BMP signaling was unaffected by PGE2 treatment. These data suggest that PGE2 decreases Sost transcription independent of the BMP signaling, and hence the effect of PGE2 upon Sost is downstream of BMPs.
Figure 7. PGE2 decreases Sost without affecting BMP signaling.
(A) Cells were treated with BMP-2 (0–500 ng/mL) in the presence or absence of 5 µM PGE2 for 3 hours, after which (A) Sost or (B) Id1 expression was monitored. Compared to vehicle control, a indicates p<0.05 and b indicates p<0.01; compared to BMP-2 without PGE2; , c indicates p<0.001.
PTH does not require prostaglandins to decrease Sost
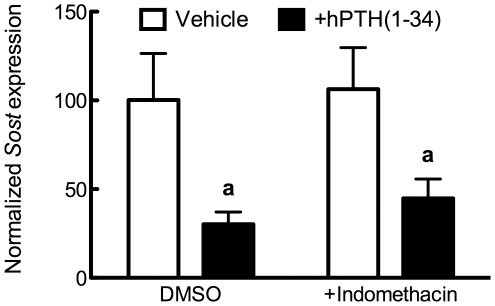
PTH increases COX-2 expression and subsequent synthesis and release of prostaglandins [56], . Because both PTH and PGE2 decrease Sost transcription through cAMP/PKA mechanisms, we next examined whether the capacity for PTH to decrease Sost required prostaglandins. Cells were treated for 24 hours in reduced serum (2%) conditions in the presence of 0.05% DMSO or 1 µM indomethacin; thereafter, a subset of cells were treated for 24 hours in the presence of 100 nM hPTH(1–34). As shown in Figure 8 , there was a similar decrease in Sost expression in cells treated with PTH with or without indomethacin co-treatment. Thus, PTH does not require prostaglandins to decrease Sost transcription, suggesting that PTH and PGE2 function through independent, parallel pathways that converge upstream of Sclerostin's transcriptional regulation.
Figure 8. PTH decreases Sost expression independent of prostaglandins.
Cells were exposed to 1 µM indomethacin for 24 hours, then treated with 100 nM hPTH(1–34) or vehicle control for 24 further hours. Sost expression was analyzed by qPCR and normalized to Rpl32. Compared to vehicle or indomethacin control, a indicates p<0.05.
Discussion
Sclerostin is a robust inhibitor of bone formation, such that its absence leads to increased bone formation, and in high amounts it causes bone loss. Thus, regulation of its expression, as well as that of other potent skeletally anabolic or catabolic proteins, is under intensive investigation as a therapy for those afflicted with osteoporosis, or as a means of hastening fracture repair. Indeed, a monoclonal antibody which inhibits Sclerostin function has already been shown to increase bone formation and strength in ovariectomized rats beyond that of non-ovariectomized controls [58] and in aged male rats [59]. Despite its clinical importance in an aging population, the molecular mechanisms controlling Sclerostin expression are only beginning to be unraveled [43], [45]. Within this work, we demonstrate that PGE2, a paracrine signaling agent with diverse effects on skeletal homeostasis, decreases Sost transcription through the EP2 receptor subclass (encoded by Ptger2). Reductions in Sost transcription by PGE2 was shown to involve cAMP and PKA, de novo protein synthesis, and to occur independently of BMP or MEF2 signaling.
PGE2 decreases Sost expression via PKA and Ptger2
We observed rapid suppression of Sost by PGE2 between 50 nM–5 µM, with a calculated IC50 of 41 nM (data not shown). Reductions in Sost transcript in response to PGE2 were rapid, occurring within 1 hr of PGE2 addition, and were sustained, remaining at 30% expression compared to vehicle-treated samples after 24 hours of culture. These results are similar to in vivo calvarial and in vitro cell culture models treated with PTH [43], as well as murine models of constitutively-active PTHR1 receptor [44], [60].
Osteoblastic cells express all Ptger receptor genes [61], [62], suggesting that PGE2 can exert biological effects through both cAMP and Ca2+ i signaling pathways. Much of the anabolic effect of PGE2 is mediated through cAMP via EP2 and EP4 [63]. The cAMP analogue 8-bromo-cAMP mimicked the effect of PGE2 upon Sost transcription. Inhibition of PLC/IP3 with U73122 did not prevent PGE2 from decreasing Sost, indicating that this pathway is not obligate. Interestingly, the calcium ionophore, ionomycin, significantly increased Sost transcription nearly 5-fold over vehicle controls after 3 hours of treatment. This would suggest stimulation of MEF2 transcriptional activity in response to increased Ca2+ i, as has been shown in skeletal muscle fibers [64], [65]. Keller and Kneissel have shown a modest decrease in Sost transcription in response to a similar dose of ionomycin [43], but they measured Sost levels after 24 hours of ionomycin treatment (rather than 3 hours, as in the study herein). Whether these contrasting results are due to timing of ionomycin treatment, or are secondary to prolonged cellular stress due to supra-physiologic Ca2+ i [66], remains to be elucidated.
The requirement for cAMP/PKA to decrease Sost thus implicated either EP2 or EP4 receptor. Butaprost, a selective agonist for EP2 [67], decreased Sost transcription by 70%, whereas CAY10580, an EP4 agonist [54], had no significant effect upon Sost levels. The EP2 receptor was further implicated in mediating the suppressive effects of PGE2, as siRNA directed against Ptger2, but not scrambled or Ptger4 siRNA, prevented PGE2-induced decreases in Sost. In total, these data indicate that PGE2 signals through EP2 to decrease Sost expression.
PGE2 and PTH decrease Sost through parallel pathways
PTH has also been shown to increase COX-2 expression and PG release [56], [57]. Because PTH and PGE2 are both capable of mobilizing the same second messengers (cAMP and IP3), and because both PTH and PGE2 decreased Sost transcription through similar mechanisms involving cAMP and MEF2, we examined whether PTH required PGE2 (or other PGs) in order to decrease Sost. Inhibition of COX-1 and COX-2 function with 1 µM indomethacin increased Sost expression (data not shown), indicating tonic suppression of Sost by endogenously-produced prostaglandins. Cells treated with both PTH and indomethacin continued to demonstrate suppression of Sost, indicating that PTH does not require prostaglandins to decrease Sost levels in mature osteoblastic cells.
There are several distinctions that must be made regarding Sost regulation by PTH and PGE2. Keller and Kneissel [43] demonstrated that PTH rapidly decreases Sost expression in UMR106.01 cells through a cyclic AMP-dependent pathway. Leupin et al. identified the MEF2 family of transcription factors as a requirement for driving bone-specific Sost expression, and as a target of PTH [45]. Within, we demonstrate that PGE2, like PTH, decreases Sost in a cyclic AMP-dependent pathway. While PTH decreases Sost expression through unknown interactions with MEF2C and MEF2D, we continued to observe Sost suppression in cells transfected with Mef2c or Mef2d siRNA, demonstrating one key difference between PGE2 and PTH. Similarly, inhibition of de novo protein synthesis with cycloheximide maintains PTH suppression of Sost [43], whereas cycloheximide prevented PGE2 reductions in Sost. These data indicate that, while both PGE2 and PTH use cAMP to decrease Sost, there is divergence downstream from cAMP/PKA in the signaling pathways utilized by PTH or PGE2 for Sost suppression.
Current FDA-approved therapies for combating osteoporosis are limited to drugs, like bisphosphonates, that inhibit bone resorption. Intermittent PTH is the only FDA-approved therapy that promotes bone formation, although treatment is currently limited to 18 months. The sclerosing bone dysplasias sclerosteosis and van Buchem disease are caused by decreased or absent Sclerostin expression, and thereby implicate Sclerostin as a very potent inhibitor of bone formation. Thus, mechanisms for manipulating Sost expression may likely provide a powerful means of increasing bone mass. Within, we have elucidated a novel mechanism of Sclerostin regulation. Continued efforts to modulate its expression and/or activity will likely allow for novel anabolic agents for conditions of bone loss.
Materials and Methods
Cell culture- UMR106.01 cells, which express phenotypic markers of mature osteoblasts [68], were cultured in MEM with Earle's Salts (Invitrogen) supplemented with 10% fetal bovine serum (FBS; Invitrogen) and 1% penicillin and streptomycin (P&S; Invitrogen). Cells were routinely sub-cultured, using 0.05% trypsin/EDTA when 80–90% confluent; for experiments, cells were seeded into 35 mm2 dishes at 5 k/cm2, and experiments were performed two days thereafter.
Chemicals and reagents- PGE2 and PGF2α (Cayman Chemical) were dissolved in DMSO as stock concentrations of 10 mM. Human PTH(1–34) (Bachem) was dissolved in HBSS+0.1% BSA and stored at 100 µM aliquots. H-89 or 8-br-cAMP (EMD Biosciences) were dissolved in sterile water; U73122, ionomycin (both EMD Biosciences), butaprost, or CAY10580 (both Cayman Chemical) were dissolved in DMSO.
Quantitative PCR- At the indicated time, cells were washed with PBS and total RNA was collected using RNeasy Mini kit (Qiagen). Total RNA (200–1000 ng) was reverse-transcribed with QuantiTect Reverse Transcription Kit (Qiagen), which includes a genomic DNA elimination step. qPCR was performed using QuantiFast Probe PCR Kit (Qiagen) on a Mastercycler® realplex2 (Eppendorf). Proprietary primer and TaqMan probe sets were purchased from Applied Biosystems. Amplification conditions were 95°C for 3 minutes, followed by 40 cycles at 95°C for 3 seconds and 60°C for 30 seconds. Quantitative PCR results were normalized to loading control (Rpl32 or Tbp) transcript level to yield ΔCt, then normalized to control conditions to generate ΔΔCt. Relative or fold change in expression was subsequently calculated using the formula 2−ΔCt or 2−ΔΔCt, as described in [69].
Dkk1 ELISA- For measurement of Dkk1 protein production, cells were prepared as described above and cultured for 24 hours in 0.05% DMSO or 5 µM PGE2. Conditioned media and whole cell protein lysates were collected and frozen at −20 C until analysis. Dkk1 protein levels in conditioned media were analyzed using a commercially available ELISA against murine Dkk1 (R & D Systems), and results were normalized to whole cell protein concentration.
siRNA - small, interfering RNA against Ptger2, Ptger4, Mef2c, and Mef2d was purchased from Qiagen, as was scrambled, non-silencing control. Cells were seeded at a density of 40,000 cells per well in a 24-well plate in media supplemented with 10% FBS and 1% P/S. 30 minutes thereafter, 50 nM scrambled, non-silencing or Ptger2 was prepared with HiperFect (Qiagen) in 100 µL of serum- and antibiotic-free media. 20 minutes later, siRNA/HiperFect/media was overlayed on top of the cells, which were returned to the incubator. Experiments were performed 48 hours later.
Statistical analysis- Each data set was acquired a minimum of three times, in duplicate. qPCR data were first analyzed relative to the internal control Rpl32, then normalized to vehicle control, in order to minimize inter-experimental variation. Results are expressed as mean±standard error of the mean. Data were analyzed by Kruskal–Wallis or ANOVA followed by Dunnet or Tukey post-hoc tests where appropriate. p<0.05 was considered statistically significant.
Footnotes
Competing Interests: The authors have declared that no competing interests exist.
Funding: The project described was supported by Award Number R03AR057547 from the National Institute of Arthritis and Musculoskeletal and Skin Diseases (DCG), R01AG022305 from the National Institute of Aging (CEY), DK075730 from the National Institute of Diabetes and Digestive and Kidney Diseases (GGL), and a grant from The Alliance for Better Bone Health (DCG). This work performed under the auspices of the U. S. Department of Energy by Lawrence Livermore National Laboratory under Contract DE-AC52-07NA27344. The funders had no role in study design, data collection and analysis, decision to publish, or preparation of the manuscript.
References
- 1.Feyen JH, Di Bon A, van der Plas A, Lowik CW, Nijweide PJ. Effects of exogenous prostanoids on the proliferation of osteoblast-like cells in vitro. Prostaglandins. 1985;30:827–840. doi: 10.1016/0090-6980(85)90011-5. [DOI] [PubMed] [Google Scholar]
- 2.Hakeda Y, Yoshino T, Natakani Y, Kurihara N, Maeda N, et al. Prostaglandin E2 stimulates DNA synthesis by a cyclic AMP-independent pathway in osteoblastic clone MC3T3-E1 cells. J Cell Physiol. 1986;128:155–161. doi: 10.1002/jcp.1041280204. [DOI] [PubMed] [Google Scholar]
- 3.Minamizaki T, Yoshiko Y, Kozai K, Aubin JE, Maeda N. EP2 and EP4 receptors differentially mediate MAPK pathways underlying anabolic actions of prostaglandin E2 on bone formation in rat calvaria cell cultures. Bone. 2009;44:1177–1185. doi: 10.1016/j.bone.2009.02.010. [DOI] [PubMed] [Google Scholar]
- 4.Hakeda Y, Nakatani Y, Hiramatsu M, Kurihara N, Tsunoi M, et al. Inductive effects of prostaglandins on alkaline phosphatase in osteoblastic cells, clone MC3T3-E1. J Biochem. 1985;97:97–104. doi: 10.1093/oxfordjournals.jbchem.a135072. [DOI] [PubMed] [Google Scholar]
- 5.Flanagan AM, Chambers TJ. Stimulation of bone nodule formation in vitro by prostaglandins E1 and E2. Endocrinology. 1992;130:443–448. doi: 10.1210/endo.130.1.1309342. [DOI] [PubMed] [Google Scholar]
- 6.Klein-Nulend J, Burger EH, Semeins CM, Raisz LG, Pilbeam CC. Pulsating fluid flow stimulates prostaglandin release and inducible G/H synthase mRNA expression in primary mouse bone cells. J Bone Miner Res. 1997;12:45–51. doi: 10.1359/jbmr.1997.12.1.45. [DOI] [PubMed] [Google Scholar]
- 7.Chen NX, Ryder KD, Pavalko FM, Turner CH, Burr DB, et al. Calcium regulates fluid shear-induced cytoskeletal reorganization and gene expression in osteoblasts. Am J Physiol. 2000;278:C989–997. doi: 10.1152/ajpcell.2000.278.5.C989. [DOI] [PubMed] [Google Scholar]
- 8.Wadhwa S, Godwin SL, Peterson DR, Epstein MA, Raisz LG, et al. Fluid flow induction of cyclo-oxygenase 2 gene expression in osteoblasts is dependent on an extracellular signal-regulated kinase signaling pathway. J Bone Miner Res. 2002;17:266–274. doi: 10.1359/jbmr.2002.17.2.266. [DOI] [PubMed] [Google Scholar]
- 9.Pead MJ, Lanyon LE. Indomethacin modulation of load-related stimulation of new bone formation in vivo. Calcif Tissue Int. 1989;45:34–40. doi: 10.1007/BF02556658. [DOI] [PubMed] [Google Scholar]
- 10.Forwood MR. Inducible cyclo-oxygenase (COX-2) mediates the induction of bone formation by mechanical loading in vivo. J Bone Miner Res. 1996;11:1688–1693. doi: 10.1002/jbmr.5650111112. [DOI] [PubMed] [Google Scholar]
- 11.Jee WS, Ma YF. The in vivo anabolic actions of prostaglandins in bone. Bone. 1997;21:297–304. doi: 10.1016/s8756-3282(97)00147-6. [DOI] [PubMed] [Google Scholar]
- 12.Gerstenfeld LC, Einhorn TA. COX inhibitors and their effects on bone healing. Expert Opin Drug Saf. 2004;3:131–136. doi: 10.1517/eods.3.2.131.27335. [DOI] [PubMed] [Google Scholar]
- 13.Simon AM, Manigrasso MB, O'Connor JP. Cyclo-oxygenase 2 function is essential for bone fracture healing. J Bone Miner Res. 2002;17:963–976. doi: 10.1359/jbmr.2002.17.6.963. [DOI] [PubMed] [Google Scholar]
- 14.Giannoudis PV, MacDonald DA, Matthews SJ, Smith RM, Furlong AJ, et al. Nonunion of the femoral diaphysis. The influence of reaming and non-steroidal anti-inflammatory drugs. J Bone Joint Surg Br. 2000;82:655–658. doi: 10.1302/0301-620x.82b5.9899. [DOI] [PubMed] [Google Scholar]
- 15.Burd TA, Hughes MS, Anglen JO. Heterotopic ossification prophylaxis with indomethacin increases the risk of long-bone nonunion. J Bone Joint Surg Br. 2003;85:700–705. [PubMed] [Google Scholar]
- 16.Li M, Ke HZ, Qi H, Healy DR, Li Y, et al. A novel, non-prostanoid EP2 receptor-selective prostaglandin E2 agonist stimulates local bone formation and enhances fracture healing. J Bone Miner Res. 2003;18:2033–2042. doi: 10.1359/jbmr.2003.18.11.2033. [DOI] [PubMed] [Google Scholar]
- 17.Paralkar VM, Borovecki F, Ke HZ, Cameron KO, Lefker B, et al. An EP2 receptor-selective prostaglandin E2 agonist induces bone healing. Proc Natl Acad Sci U S A. 2003;100:6736–6740. doi: 10.1073/pnas.1037343100. [DOI] [PMC free article] [PubMed] [Google Scholar]
- 18.Axelrad TW, Kakar S, Einhorn TA. New technologies for the enhancement of skeletal repair. Injury. 2007;38(Suppl 1):S49–62. doi: 10.1016/j.injury.2007.02.010. [DOI] [PubMed] [Google Scholar]
- 19.Cameron KO, Lefker BA, Ke HZ, Li M, Zawistoski MP, et al. Discovery of CP-533536: an EP2 receptor selective prostaglandin E2 (PGE2) agonist that induces local bone formation. Bioorg Med Chem Lett. 2009;19:2075–2078. doi: 10.1016/j.bmcl.2009.01.059. [DOI] [PubMed] [Google Scholar]
- 20.Bodine PV, Komm BS. Wnt signaling and osteoblastogenesis. Rev Endocr Metab Disord. 2006;7:33–39. doi: 10.1007/s11154-006-9002-4. [DOI] [PubMed] [Google Scholar]
- 21.Akiyama T. Wnt/beta-catenin signaling. Cytokine Growth Factor Rev. 2000;11:273–282. doi: 10.1016/s1359-6101(00)00011-3. [DOI] [PubMed] [Google Scholar]
- 22.Nusse R. WNT targets. Repression and activation. Trends Genet. 1999;15:1–3. doi: 10.1016/s0168-9525(98)01634-5. [DOI] [PubMed] [Google Scholar]
- 23.Gong Y, Slee RB, Fukai N, Rawadi G, Roman-Roman S, et al. LDL receptor-related protein 5 (LRP5) affects bone accrual and eye development. Cell. 2001;107:513–523. doi: 10.1016/s0092-8674(01)00571-2. [DOI] [PubMed] [Google Scholar]
- 24.Little RD, Carulli JP, Del Mastro RG, Dupuis J, Osborne M, et al. A mutation in the LDL receptor-related protein 5 gene results in the autosomal dominant high-bone-mass trait. Am J Hum Genet. 2002;70:11–19. doi: 10.1086/338450. [DOI] [PMC free article] [PubMed] [Google Scholar]
- 25.Kato M, Patel MS, Levasseur R, Lobov I, Chang BH, et al. Cbfa1-independent decrease in osteoblast proliferation, osteopenia, and persistent embryonic eye vascularization in mice deficient in Lrp5, a Wnt coreceptor. J Cell Biol. 2002;157:303–314. doi: 10.1083/jcb.200201089. [DOI] [PMC free article] [PubMed] [Google Scholar]
- 26.Holmen SL, Giambernardi TA, Zylstra CR, Buckner-Berghuis BD, Resau JH, et al. Decreased BMD and limb deformities in mice carrying mutations in both Lrp5 and Lrp6. J Bone Miner Res. 2004;19:2033–2040. doi: 10.1359/JBMR.040907. [DOI] [PubMed] [Google Scholar]
- 27.Sawakami K, Robling AG, Ai M, Pitner ND, Liu D, et al. The Wnt Co-receptor LRP5 is essential for skeletal mechanotransduction but not for the anabolic bone response to parathyroid hormone treatment. J Biol Chem. 2006;281:23698–23711. doi: 10.1074/jbc.M601000200. [DOI] [PubMed] [Google Scholar]
- 28.Bodine PV, Zhao W, Kharode YP, Bex FJ, Lambert AJ, et al. The Wnt antagonist secreted frizzled-related protein-1 is a negative regulator of trabecular bone formation in adult mice. Mol Endocrinol. 2004;18:1222–1237. doi: 10.1210/me.2003-0498. [DOI] [PubMed] [Google Scholar]
- 29.Bodine PV, Billiard J, Moran RA, Ponce-de-Leon H, McLarney S, et al. The Wnt antagonist secreted frizzled-related protein-1 controls osteoblast and osteocyte apoptosis. J Cell Biochem. 2005;96:1212–1230. doi: 10.1002/jcb.20599. [DOI] [PubMed] [Google Scholar]
- 30.Balemans W, Van Den Ende J, Freire Paes-Alves A, Dikkers FG, Willems PJ, et al. Localization of the gene for sclerosteosis to the van Buchem disease-gene region on chromosome 17q12-q21. Am J Hum Genet. 1999;64:1661–1669. doi: 10.1086/302416. [DOI] [PMC free article] [PubMed] [Google Scholar]
- 31.Balemans W, Ebeling M, Patel N, Van Hul E, Olson P, et al. Increased bone density in sclerosteosis is due to the deficiency of a novel secreted protein (SOST). Hum Mol Genet. 2001;10:537–543. doi: 10.1093/hmg/10.5.537. [DOI] [PubMed] [Google Scholar]
- 32.Brunkow ME, Gardner JC, Van Ness J, Paeper BW, Kovacevich BR, et al. Bone dysplasia sclerosteosis results from loss of the SOST gene product, a novel cystine knot-containing protein. Am J Hum Genet. 2001;68:577–589. doi: 10.1086/318811. [DOI] [PMC free article] [PubMed] [Google Scholar]
- 33.Li X, Ominsky MS, Niu QT, Sun N, Daugherty B, et al. Targeted deletion of the sclerostin gene in mice results in increased bone formation and bone strength. J Bone Miner Res. 2008;23:860–869. doi: 10.1359/jbmr.080216. [DOI] [PubMed] [Google Scholar]
- 34.Winkler DG, Sutherland MK, Geoghegan JC, Yu C, Hayes T, et al. Osteocyte control of bone formation via sclerostin, a novel BMP antagonist. Embo J. 2003;22:6267–6276. doi: 10.1093/emboj/cdg599. [DOI] [PMC free article] [PubMed] [Google Scholar]
- 35.Loots GG, Kneissel M, Keller H, Baptist M, Chang J, et al. Genomic deletion of a long-range bone enhancer misregulates sclerostin in Van Buchem disease. Genome Res. 2005;15:928–935. doi: 10.1101/gr.3437105. [DOI] [PMC free article] [PubMed] [Google Scholar]
- 36.Collette NM, Genetos DC, Murugesh D, Harland RM, Loots GG. Genetic evidence that SOST inhibits WNT signaling in the limb. Dev Biol. 2010;342:169–179. doi: 10.1016/j.ydbio.2010.03.021. [DOI] [PMC free article] [PubMed] [Google Scholar]
- 37.Kusu N, Laurikkala J, Imanishi M, Usui H, Konishi M, et al. Sclerostin is a novel secreted osteoclast-derived bone morphogenetic protein antagonist with unique ligand specificity. J Biol Chem. 2003;278:24113–24117. doi: 10.1074/jbc.M301716200. [DOI] [PubMed] [Google Scholar]
- 38.Li X, Zhang Y, Kang H, Liu W, Liu P, et al. Sclerostin binds to LRP5/6 and antagonizes canonical Wnt signaling. J Biol Chem. 2005;280:19883–19887. doi: 10.1074/jbc.M413274200. [DOI] [PubMed] [Google Scholar]
- 39.Semenov M, Tamai K, He X. SOST is a ligand for LRP5/LRP6 and a Wnt signaling inhibitor. J Biol Chem. 2005;280:26770–26775. doi: 10.1074/jbc.M504308200. [DOI] [PubMed] [Google Scholar]
- 40.Ellies DL, Viviano B, McCarthy J, Rey JP, Itasaki N, et al. Bone density ligand, Sclerostin, directly interacts with LRP5 but not LRP5G171V to modulate Wnt activity. J Bone Miner Res. 2006;21:1738–1749. doi: 10.1359/jbmr.060810. [DOI] [PubMed] [Google Scholar]
- 41.Semenov MV, He X. LRP5 mutations linked to high bone mass diseases cause reduced LRP5 binding and inhibition by SOST. J Biol Chem. 2006;281:38276–38284. doi: 10.1074/jbc.M609509200. [DOI] [PubMed] [Google Scholar]
- 42.Morvan F, Boulukos K, Clement-Lacroix P, Roman Roman S, Suc-Royer I, et al. Deletion of a single allele of the Dkk1 gene leads to an increase in bone formation and bone mass. J Bone Miner Res. 2006;21:934–945. doi: 10.1359/jbmr.060311. [DOI] [PubMed] [Google Scholar]
- 43.Keller H, Kneissel M. SOST is a target gene for PTH in bone. Bone. 2005;37:148–158. doi: 10.1016/j.bone.2005.03.018. [DOI] [PubMed] [Google Scholar]
- 44.Bellido T, Ali AA, Gubrij I, Plotkin LI, Fu Q, et al. Chronic elevation of parathyroid hormone in mice reduces expression of sclerostin by osteocytes: a novel mechanism for hormonal control of osteoblastogenesis. Endocrinology. 2005;146:4577–4583. doi: 10.1210/en.2005-0239. [DOI] [PubMed] [Google Scholar]
- 45.Leupin O, Kramer I, Collette NM, Loots GG, Natt F, et al. Control of the SOST bone enhancer by PTH using MEF2 transcription factors. J Bone Miner Res. 2007;22:1957–1967. doi: 10.1359/jbmr.070804. [DOI] [PMC free article] [PubMed] [Google Scholar]
- 46.Chyun YS, Raisz LG. Stimulation of bone formation by prostaglandin E2. Prostaglandins. 1984;27:97–103. doi: 10.1016/0090-6980(84)90223-5. [DOI] [PubMed] [Google Scholar]
- 47.Jorgensen HR, Svanholm H, Host A. Bone formation induced in an infant by systemic prostaglandin-E2 administration. Acta Orthop Scand. 1988;59:464–466. doi: 10.3109/17453678809149406. [DOI] [PubMed] [Google Scholar]
- 48.Holmen SL, Zylstra CR, Mukherjee A, Sigler RE, Faugere MC, et al. Essential role of beta-catenin in postnatal bone acquisition. J Biol Chem. 2005;280:21162–21168. doi: 10.1074/jbc.M501900200. [DOI] [PubMed] [Google Scholar]
- 49.Poole KE, van Bezooijen RL, Loveridge N, Hamersma H, Papapoulos SE, et al. Sclerostin is a delayed secreted product of osteocytes that inhibits bone formation. Faseb J. 2005;19:1842–1844. doi: 10.1096/fj.05-4221fje. [DOI] [PubMed] [Google Scholar]
- 50.Papanicolaou SE, Phipps RJ, Fyhrie DP, Genetos DC. Modulation of sclerostin expression by mechanical loading and bone morphogenetic proteins in osteogenic cells. Biorheology. 2009;46:389–399. doi: 10.3233/BIR-2009-0550. [DOI] [PubMed] [Google Scholar]
- 51.Genetos DC, Toupadakis CA, Raheja LF, Wong A, Papanicolaou SE, et al. Hypoxia decreases sclerostin expression and increases Wnt signaling in osteoblasts. J Cell Biochem. 2010;110:457–467. doi: 10.1002/jcb.22559. [DOI] [PMC free article] [PubMed] [Google Scholar]
- 52.Sugimoto Y, Narumiya S. Prostaglandin E receptors. J Biol Chem. 2007;282:11613–11617. doi: 10.1074/jbc.R600038200. [DOI] [PubMed] [Google Scholar]
- 53.Kiriyama M, Ushikubi F, Kobayashi T, Hirata M, Sugimoto Y, et al. Ligand binding specificities of the eight types and subtypes of the mouse prostanoid receptors expressed in Chinese hamster ovary cells. Br J Pharmacol. 1997;122:217–224. doi: 10.1038/sj.bjp.0701367. [DOI] [PMC free article] [PubMed] [Google Scholar]
- 54.Billot X, Chateauneuf A, Chauret N, Denis D, Greig G, et al. Discovery of a potent and selective agonist of the prostaglandin EP4 receptor. Bioorg Med Chem Lett. 2003;13:1129–1132. doi: 10.1016/s0960-894x(03)00042-8. [DOI] [PubMed] [Google Scholar]
- 55.Kamiya N, Ye L, Kobayashi T, Mochida Y, Yamauchi M, et al. BMP signaling negatively regulates bone mass through sclerostin by inhibiting the canonical Wnt pathway. Development. 2008;135:3801–3811. doi: 10.1242/dev.025825. [DOI] [PMC free article] [PubMed] [Google Scholar]
- 56.Kawaguchi H, Raisz LG, Voznesensky OS, Alander CB, Hakeda Y, et al. Regulation of the two Prostaglandin G/H Synthases by parathyroid hormone, interleukin-1, cortisol, and prostaglandin E2 in cultured neonatal mouse calvariae. Endocrinology. 1994;135:1157–1164. doi: 10.1210/endo.135.3.8070358. [DOI] [PubMed] [Google Scholar]
- 57.Maciel FM, Sarrazin P, Morisset S, Lora M, Patry C, et al. Induction of cyclooxygenase-2 by parathyroid hormone in human osteoblasts in culture. J Rheumatol. 1997;24:2429–2435. [PubMed] [Google Scholar]
- 58.Li X, Ominsky MS, Warmington KS, Morony S, Gong J, et al. Sclerostin antibody treatment increases bone formation, bone mass, and bone strength in a rat model of postmenopausal osteoporosis. J Bone Miner Res. 2009;24:578–588. doi: 10.1359/jbmr.081206. [DOI] [PubMed] [Google Scholar]
- 59.Li X, Warmington KS, Niu QT, Asuncion FJ, Barrero M, et al. Inhibition of sclerostin by monoclonal antibody increases bone formation, bone mass and bone strength in aged male rats. J Bone Miner Res. 2010 doi: 10.1002/jbmr.182. [DOI] [PubMed] [Google Scholar]
- 60.O'Brien CA, Plotkin LI, Galli C, Goellner JJ, Gortazar AR, et al. Control of bone mass and remodeling by PTH receptor signaling in osteocytes. PLoS ONE. 2008;3:e2942. doi: 10.1371/journal.pone.0002942. [DOI] [PMC free article] [PubMed] [Google Scholar]
- 61.Suda M, Tanaka K, Natsui K, Usui T, Tanaka I, et al. Prostaglandin E receptor subtypes in mouse osteoblastic cell line. Endocrinology. 1996;137:1698–1705. doi: 10.1210/endo.137.5.8612504. [DOI] [PubMed] [Google Scholar]
- 62.Lee CM, Genetos DC, You Z, Yellowley CE. Hypoxia regulates PGE(2) release and EP1 receptor expression in osteoblastic cells. J Cell Physiol. 2007;212:182–188. doi: 10.1002/jcp.21017. [DOI] [PMC free article] [PubMed] [Google Scholar]
- 63.Blackwell KA, Raisz LG, Pilbeam CC. Prostaglandins in bone: bad cop, good cop? Trends Endocrinol Metab. 2010;21:294–301. doi: 10.1016/j.tem.2009.12.004. [DOI] [PMC free article] [PubMed] [Google Scholar]
- 64.Wu H, Naya FJ, McKinsey TA, Mercer B, Shelton JM, et al. MEF2 responds to multiple calcium-regulated signals in the control of skeletal muscle fiber type. EMBO J. 2000;19:1963–1973. doi: 10.1093/emboj/19.9.1963. [DOI] [PMC free article] [PubMed] [Google Scholar]
- 65.Blaeser F, Ho N, Prywes R, Chatila TA. Ca(2+)-dependent gene expression mediated by MEF2 transcription factors. J Biol Chem. 2000;275:197–209. doi: 10.1074/jbc.275.1.197. [DOI] [PubMed] [Google Scholar]
- 66.Hamamura K, Liu Y, Yokota H. Microarray analysis of thapsigargin-induced stress to the endoplasmic reticulum of mouse osteoblasts. J Bone Miner Metab. 2008;26:231–240. doi: 10.1007/s00774-007-0825-1. [DOI] [PubMed] [Google Scholar]
- 67.Gardiner PJ. Characterization of prostanoid relaxant/inhibitory receptors (psi) using a highly selective agonist, TR4979. Br J Pharmacol. 1986;87:45–56. doi: 10.1111/j.1476-5381.1986.tb10155.x. [DOI] [PMC free article] [PubMed] [Google Scholar]
- 68.Partridge NC, Alcorn D, Michelangeli VP, Ryan G, Martin TJ. Morphological and biochemical characterization of four clonal osteogenic sarcoma cell lines of rat origin. Cancer Res. 1983;43:4308–4314. [PubMed] [Google Scholar]
- 69.Livak KJ, Schmittgen TD. Analysis of relative gene expression data using real-time quantitative PCR and the 2(-Delta Delta C(T)) Method. Methods. 2001;25:402–408. doi: 10.1006/meth.2001.1262. [DOI] [PubMed] [Google Scholar]


